Background: Mitochondria produce one-carbon units for cytoplasmic nucleotide and methyl group synthesis.
Results: MTHFD2L uses both NAD+ and NADP+ and is expressed in embryonic tissues during neural tube closure.
Conclusion: This cofactor specificity allows for rapid response to changing metabolic conditions.
Significance: These findings help explain why mammals possess two distinct mitochondrial isozymes that switch expression during neural tube closure.
Keywords: Folate Metabolism, Mitochondrial Metabolism, Multifunctional Enzymes, NAD, Neurodevelopment
Abstract
Mammalian mitochondria are able to produce formate from one-carbon donors such as serine, glycine, and sarcosine. This pathway relies on the mitochondrial pool of tetrahydrofolate (THF) and several folate-interconverting enzymes in the mitochondrial matrix. We recently identified MTHFD2L as the enzyme that catalyzes the oxidation of 5,10-methylenetetrahydrofolate (CH2-THF) in adult mammalian mitochondria. We show here that the MTHFD2L enzyme is bifunctional, possessing both CH2-THF dehydrogenase and 5,10-methenyl-THF cyclohydrolase activities. The dehydrogenase activity can use either NAD+ or NADP+ but requires both phosphate and Mg2+ when using NAD+. The NADP+-dependent dehydrogenase activity is inhibited by inorganic phosphate. MTHFD2L uses the mono- and polyglutamylated forms of CH2-THF with similar catalytic efficiencies. Expression of the MTHFD2L transcript is low in early mouse embryos but begins to increase at embryonic day 10.5 and remains elevated through birth. In adults, MTHFD2L is expressed in all tissues examined, with the highest levels observed in brain and lung.
Introduction
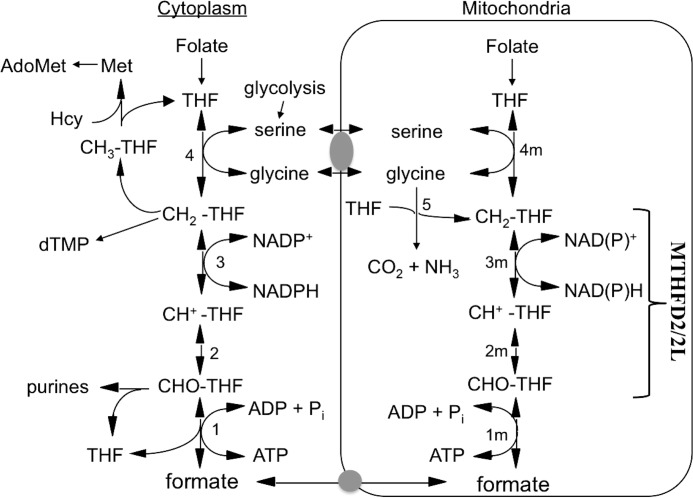
Folate-dependent one-carbon (1C)2 metabolism is highly compartmentalized in eukaryotes, and mitochondria play a critical role in cellular 1C metabolism (reviewed in Ref. 1). The cytoplasmic and mitochondrial compartments are metabolically connected by the transport of 1C donors such as serine, glycine, and formate across the mitochondrial membranes in a mostly unidirectional flow (clockwise in Fig. 1). In mitochondria, the 1C units are oxidized to formate and released into the cytoplasm, where the formate is reattached to tetrahydrofolate (THF) for use in de novo purine biosynthesis or further reduced for either thymidylate synthesis or remethylation of homocysteine to methionine. The 1C unit interconverting activities represented in Fig. 1 by reactions 1–3 (1m–3m in mitochondria) are catalyzed by members of the methylenetetrahydrofolate dehydrogenase (MTHFD) family in eukaryotes. The cytoplasmic MTHFD1 protein is a trifunctional enzyme possessing 10-formyl-THF (10-CHO-THF) synthetase, 5,10-methenyl-THF (CH+-THF) cyclohydrolase, and 5,10-methylene-THF (CH2-THF) dehydrogenase activities (Fig. 1, reactions 1–3).
FIGURE 1.
Mammalian one-carbon metabolism. Reactions 1–4 are in both the cytoplasmic and the mitochondrial (m) compartments. Reactions 1, 2, and 3, 10-formyl-THF synthetase, 5,10-methenyl-THF cyclohydrolase, and 5,10-methylene-THF dehydrogenase, respectively, are catalyzed by trifunctional C1-THF synthase in the cytoplasm (MTHFD1). In mammalian mitochondria, reaction 1m is catalyzed by monofunctional MTHFD1L, and reactions 2m and 3m are catalyzed by bifunctional MTHFD2 or MTHFD2L. Reactions 4 and 4m are catalyzed by serine hydroxymethyltransferase and reaction 5 by the glycine cleavage system. Gray ovals represent putative metabolite transporters. Hcy, homocysteine; dTMP, thymidylate.
In contrast to the single trifunctional enzyme found in the cytoplasm, three distinct MTHFD isozymes, encoded by three distinct genes, are now known to catalyze reactions 1m–3m (Fig. 1) in mammalian mitochondria. The final step in the mammalian mitochondrial pathway to formate (Fig. 1, reaction 1m) is catalyzed by MTHFD1L, a monofunctional 10-CHO-THF synthetase (2). The CH2-THF dehydrogenase reaction (Fig. 1, reaction 3m) is catalyzed by two homologous enzymes, MTHFD2 and MTHFD2L. MTHFD2 was initially identified in 1985 as an NAD+-dependent 5,10-methylene-THF dehydrogenase (3). Upon purification, this protein was found to be a bifunctional enzyme (4), also possessing CH+-THF cyclohydrolase activity (Fig. 1, reaction 2m). This enzyme, now referred to as MTHFD2, has been extensively characterized with respect to kinetics, substrate specificity, and expression profile (3, 5–10).
In 2011 we reported the discovery of a new mammalian mitochondrial CH2-THF dehydrogenase, termed MTHFD2L (11). MTHFD2L is homologous to MTHFD2, sharing 60–65% identity. Recombinant rat MTHFD2L exhibits NADP+-dependent CH2-THF dehydrogenase activity when expressed in yeast (11), but the enzyme was not purified in that study. In addition, it could not be determined whether MTHFD2L was bifunctional because CH+-THF cyclohydrolase assays are unreliable in crude extracts. This new isozyme is expressed in adult mitochondria (11), whereas MTHFD2 is expressed only in transformed mammalian cells and embryonic or nondifferentiated tissues (3).
The existence of these two CH2-THF dehydrogenases (MTHFD2 and MTHFD2L) in mammalian mitochondria raises several questions. Do the two enzymes differ in their catalytic activity or in their substrate or cofactor specificity? Do they differ in their tissue distribution or expression profiles? To answer these questions, we report here the purification and kinetic characterization of MTHFD2L and its embryonic and adult gene expression profiles. We show that MTHFD2L possesses CH+-THF cyclohydrolase activity and can use either NAD+ or NADP+ in its CH2-THF dehydrogenase activity. MTHFD2L is expressed during mouse embryonic development, and there appears to be a switch from MTHFD2 to MTHFD2L expression at about the time of neural tube closure. A comparison of the enzymatic characteristics and expression profiles of MTHFD2 and MTHFD2L revealed differences that may shed light on the roles of these two isozymes in adult and embryonic 1C metabolism.
EXPERIMENTAL PROCEDURES
Chemicals and Reagents
All reagents were of the highest commercial grade available. NAD+ and NADP+ were purchased from U. S. Biological (Swampscott, MA) and Sigma, respectively. HRP-conjugated goat anti-rabbit IgG was from Invitrogen, and the ECL Plus chemiluminescence detection kit was from GE Healthcare Life Sciences. Polyclonal antibodies specific for MTHFD2L were produced in rabbits by the Dept. of Veterinary Sciences, M. D. Anderson Cancer Center, Bastrop, TX. THF was prepared by the hydrogenation of folic acid (Sigma) using platinum oxide as a catalyst and purification of the THF product on a DEAE cellulose column (Sigma) (12, 13). CH2-THF was prepared nonenzymatically from THF and formaldehyde (Fisher) (14). The yield of CH2-THF was determined by solving the equilibria of THF, formaldehyde, and β-mercaptoethanol (15). The preparation of CH+-THF from 5-CHO-THF (MP Biomedicals, Solon, OH) was conducted as described previously (16). Oligonucleotide primers were obtained from Integrated DNA Technologies (Coralville, IA). Tetrahydropteroylpentaglutamate (H4PteGlu5) was prepared by a modified NaBH4 reduction from the corresponding pteroylpentaglutamate (PteGlu5) (Schircks Laboratories, Jona, Switzerland), as described previously (17). Further preparation of 5,10-CH2-H4PteGlu5 was accomplished by incubation with formaldehyde as described previously (14).
Mice
All animals used within this study were maintained according to protocols approved by the Institutional Animal Care and Use Committee of The University of Texas at Austin and conform to the National Institutes of Health Guide for the Care and Use of Laboratory Animals.
Cloning of Rat MTHFD2L
RNA isolation and cDNA construction of rat MTHFD2L were conducted as described previously (11). Removal of the mitochondrial targeting sequence from the full-length rat MTHFD2L cDNA was accomplished by PCR amplification using primers rMTHFD2LΔ1–40_forward (5′-GTCATCACCATCACCATCACGGATCCATGGCGACGCGGGCC-3′ and rMTHFD2LΔ1–40_reverse (5′-ACCTTAGCGGCCGCAGATCTGGTACCCTAGTAGGTGATATTCT-3′) (start codon is in bold, and underlined portions are complementary to the rat MTHFD2L cDNA). The mitochondrial targeting sequence (amino acids 1–40) was predicted by MitoProt (18). The resulting PCR-amplified fragment was cloned into the pET22b vector (Novagen, EMD Biosciences). The pET22b-rMTHFD2LΔ1–40 was further subcloned into a YEp24-based yeast expression vector containing the Saccharomyces cerevisiae MET6 promoter using sequence- and ligation-independent cloning (17, 19). The YEp24 vector was modified to include a multiple cloning site and an N-terminal His6 tag (11). This construct (YEp24-rMTHFD2LΔ1–40) should produce a protein of 307 residues (N-terminal Met + 2 Gly + 6 His + 298 MTHFD2L residues) with a calculated molecular mass of 33,180 kDa.
Expression and Purification of MTHFD2L
The YEp24-rMTHFD2LΔ1–40 construct was transformed into yeast strain MWY4.4 (ser1 ura3–52 trp1 his4 leu2 ade3–65 Δmtd1) using a high efficiency lithium acetate yeast transformation procedure (20, 21). Transformed cells were grown in synthetic minimal medium (YMD) containing 0.7% (w/v) yeast nitrogen base without amino acids (Difco Bacto) and 2% (w/v) glucose supplemented with l-serine (375 mg/liter), l-tryptophan (20 mg/liter), l-histidine (20 mg/liter), l-leucine (30 mg/liter), and adenine (20 mg/liter). Cultures were grown at 30 °C in a rotary shaker at 200 rpm and were harvested at 3–4 A600 by centrifugation at 8000 × g for 5 min at 4 °C. The cell pellet was suspended in 2 ml of 25 mm Tris-Cl (pH 7.5) containing 1% (w/v) sodium carbonate, 10 mm β-mercaptoethanol, and 1 mm phenylmethanesulfonyl fluoride (PMSF)/gram wet weight. The suspended cells were disrupted with glass beads using a FastPrep FP120 cell disrupter (MP Biomedicals) followed by incubation for 30 min at 4 °C to facilitate dissociation of MTHFD2L from cellular membranes. Cell debris was removed by centrifugation at 30,000 × g for 30 min at 4 °C. The extracted MTHFD2L protein was then dialyzed at 4 °C overnight against 25 mm Tris-Cl, 10 mm β-mercaptoethanol, 1 mm PMSF, 20% (v/v) glycerol, and 500 mm KCl at pH 8.5. Concentrated cell lysate (∼15 ml) was added to 9 ml of Ni2+-charged His-Bind resin (Novagen, Darmstadt, Germany) in 15 ml of binding buffer (final concentration: 25 mm Tris-Cl, 10 mm β-mercaptoethanol, 1 mm PMSF, 20% (v/v) glycerol, 500 mm KCl, and 20 mm imidazole at pH 8.5). The slurry was mixed for 3 h at 4 °C and then packed into a column. The column was washed at room temperature with 40 column volumes of wash buffer containing 25 mm Tris-Cl, 10 mm β-mercaptoethanol, 1 mm PMSF, 500 mm KCl, 10% (v/v) isopropanol, and 60 mm imidazole (pH 8.5) at a flow rate of 2–3 ml/min. His-tagged MTHFD2L was eluted at 4 °C at 0.5–1 ml/min with binding buffer containing 250 mm imidazole. Fractions containing active enzyme were determined by assaying for CH2-THF dehydrogenase activity (see below), and protein concentration was determined using the Bio-Rad protein assay reagent. Purified MTHFD2L was stored at −20 °C in 25 mm Tris-Cl, 10 mm β-mercaptoethanol, 100 mm KCl, and 50% (v/v) glycerol at a final pH of 7.5. Purity of enzyme preparations was evaluated by SDS-PAGE. Enzyme stability was confirmed by assaying CH2-THF dehydrogenase activity in aliquots of stored enzyme over a 1-week period. The purified enzyme retained ∼75% 5,10-CH2THF dehydrogenase activity after 1 week of storage, and all kinetic analyses were performed within 1 week of enzyme purification.
5,10-Methylene-THF Dehydrogenase and 5,10-Methenyl-THF Cyclohydrolase Assays
A microplate assay was used for determination of kinetic parameters as described previously (22). CH2-THF dehydrogenase activity was determined by an end point assay (2). The reaction buffer consisted of 50 mm HEPES (pH 8.0), 100 mm KCl, 5 mm MgCl2, 0.4 mm CH2-THF, 40 mm β-mercaptoethanol, and either NAD+ (1 mm) or NADP+ (6 mm). Potassium phosphate (25 mm) was also included for the NAD+-dependent activity. To determine the cofactor specificity of the MTHFD2L enzyme in conditions that more closely resembled physiological conditions, reaction buffer contained 50 mm HEPES (pH 8.0), 100 mm KCl, 0.5 mm MgCl2, 10 mm potassium phosphate, 40 mm β-mercaptoethanol, and different cofactors including NAD+ (0.2 mm) or NADP+ (0.05 mm) and varying concentrations of CH2-THF. Sixty μl of reaction mixture without CH2-THF and 20 μl of purified MTHFD2L were mixed, and the enzyme reaction was initiated by the addition of 20 μl of CH2-THF followed by incubation at 30 °C for 5 min. The reaction was quenched with 200 μl of 3% perchloric acid, and the plate was read at 350 nm on an Infinite M200 (Tecan, Männedorf, Switzerland). The path length was corrected using near-infrared measurements (23).
CH+-THF cyclohydrolase activity was determined by a continuous assay (24) in microplate format. The enzyme reaction was incubated at 30 °C with MTHFD2L containing 200 mm potassium maleate (pH 7.4), 20 mm β-mercaptoethanol, and varying concentrations of CH+-THF. The activity was monitored by observing the decrease in absorbance of CH+-THF at 355 nm.
For the determination of kinetic parameters, the initial rate data were fitted to the Michaelis-Menten equation by nonlinear regression using Prism (GraphPad, La Jolla, CA). Inhibition of NADP+-dependent dehydrogenase activity by phosphate ion was examined by assays at four fixed phosphate ion concentrations at varying concentrations of NADP+. Over the 5-min period of measurement, 20% or less of the substrate was converted to product, ensuring that initial rates were observed. Ki was calculated from a global fit of the data to a competitive inhibition model using Prism.
RNA Isolation and cDNA Synthesis
Tissue was collected from six male and six female C57BL/6 mice between 4 and 6 weeks of age. Embryos were dissected at the days indicated. For embryonic days 8.5–11.5, five embryos were pooled for each time point; for embryonic days 12.5–17.5, three embryos were pooled for each time point. Tissue and embryos were washed with PBS and then stored in RNAlater (Applied Biosystems Inc. (ABI)). Embryos from each day were pooled prior to RNA isolation. RNA was isolated using TRI reagent (ABI) and treated with TurboDnase (Invitrogen) following the manufacturer's instructions. RNA quality was verified by confirmation of the presence of 28S and 18S rRNA bands on an agarose gel. cDNA was synthesized using SuperScript III (Invitrogen) and random hexamers.
Real-time PCR
Primers against mouse MTHFD1, MTHFD1L, MTHFD2, MTHFD2L, eEF2 (eukaryotic translation elongation factor 2), and TBP (TATA-box-binding protein) were designed using Primer-BLAST (25) to yield an amplicon between 95 and 125 base pairs long and cross at least one exon-exon junction (see Table 1). Primers were checked individually against plasmids containing mouse MTHFD1, MTHFD1L, MTHFD2, and MTHFD2L to ensure that the primer pairs were specific to the target gene. Quantitative real-time PCR was performed using SYBR Green (Qiagen) on an ABI ViiA 7 using a two-step program (50 °C for 2 min and then 95 °C for 10 min followed by 40 cycles of 95 °C for 15 s and 60 °C for 15 s). The specificity of the reaction was verified by melt curve analysis. Relative expression values from embryos were calculated by normalizing to TBP (26), and values from adult tissues were normalized to eEF2 (27).
TABLE 1.
Primers used for gene expression profiling of the MTHFD gene family in mouse embryos and adult organs
| Primer name | Sequence | Location |
|---|---|---|
| MTHFD1 F | 5′-TTCATCCCATGCACACCCAA-3′ | Exon 6 |
| MTHFD1 R | 5′-ATGCATGGGTGCACCAACTA-3′ | Exon 7 |
| MTHFD1L F | 5′-GGACCCACTTTTGGAGTGAA-3′ | Exon 12 |
| MTHFD1L R | 5′-ATGTCCCCAGTCAGGTGAAG-3′ | Exon 14 |
| MTHFD2 F | 5′-ACAGATGGAGCTCACGAACG-3′ | Exon 5 |
| MTHFD2 R | 5′-TGCCAGCGGCAGATATTACA-3′ | Exon 6 |
| MTHFD2L F1 | 5′-GGCGGGAAGATCCAAGAACG-3′ | Exon 6 |
| MTHFD2L R1 | 5′-CGCTATCGTCACCGTTGCAT-3′ | Exon 7 |
| MTHFD2L F2 | 5′-GGCCAGCAGAGAGAAGAGACT-3′ | Exon 2 |
| MTHFD2L R2 | 5′-CCATGATTCCACTCCTTGCT-3′ | Exon 3 |
| MTHFD2L F3 | 5′-GAGGTGATGCAACGGTGAC-3′ | Exon 7 |
| MTHFD2L R3 | 5′-GAATACCCGCAGCCACTATG-3′ | Exon 8 |
| eEF2 F | 5′-CGCATCGTGGAGAACGTCAA-3′ | Exon 4 |
| eEF2 R | 5′-GCCAGAACCAAAGCCTACGG-3′ | Exon 5 |
| TBP F | 5′-CATGGACCAGAACAACAGCC-3′ | Exon 2 |
| TBP R | 5′-TAAGTCCTGTGCCGTAAGGC-3′ | Exon 3 |
We have shown previously that MTHFD2L is alternatively spliced at exons 2 and 8 (11). To determine the abundance of the splice variants of MTHFD2L containing exon 2 or exon 8, we designed primer pairs that would bind in exons 2 and 3 or in exons 7 and 8, so that they would produce only a product from splice variants containing exon 2 or exon 8, respectively. The expression values for these primer pairs were normalized to the expression levels found using primers MTHFD2L F1 and R1, which bind in exons 6 and 7. There is no evidence for alternative splicing of these exons, and they are thus assumed to represent the total amount of MTHFD2L transcript, including all splice variants.
In Situ Hybridization of Whole Mouse Embryos
Mouse embryos ranging from E9.5 to 12.5 were hybridized as described previously using digoxigenin-labeled UTP RNA probes (28). Antisense probes were constructed as described previously (28) by in vitro transcription using T7 RNA polymerase to transcribe from Riken clone 1110019K23 (29) linearized with BamHI. Sense probes were made by linearizing with XhoI and transcribing with T3 RNA polymerase.
Yeast Complementation Assay
Exon 8 was removed from pET22b-rMTHFD2L by overlap extension PCR (30) using the primers rD2L-x8 5′/HindIII F (5′-ATCTAAGCTTATGGCGACGCGGGCCCGT-3′), rD2L-x8 5′ R (5′-TAACAG CTGCAGCCACTATGATAATCT-3′), rD2L-x8 3′ F (5′-CTGCAGCTGTTAAGAAGAAGGCCAGC-3′), and rD2L-x8 3′/BamHI R (V5) (5′-TGAT GGATCC A GTAGGTGATATTCTTGGCAGCCAG-3′). Following PCR, rMTHFD2L-x8 was subcloned into YEp24ES (11, 17) using the HindIII and BamHI restriction sites. Plasmids were transformed into the yeast strain MWY4.5 (ser1 ura3–52 trp1 leu2 his4 ade3–30/65 Δmtd1), and transformants were selected for uracil prototrophy. The in vivo complementation assay was performed in this yeast strain as described previously (11).
Preparation of crude yeast lysates and immunoblotting were carried out as described previously (11). The protein concentration was determined by BCA assay (Thermo Fisher Scientific). NAD+-dependent CH2-THF dehydrogenase activity in the lysates was assayed with MgCl2 and potassium phosphate as described above.
RESULTS
Expression and Purification of Rat MTHFD2L
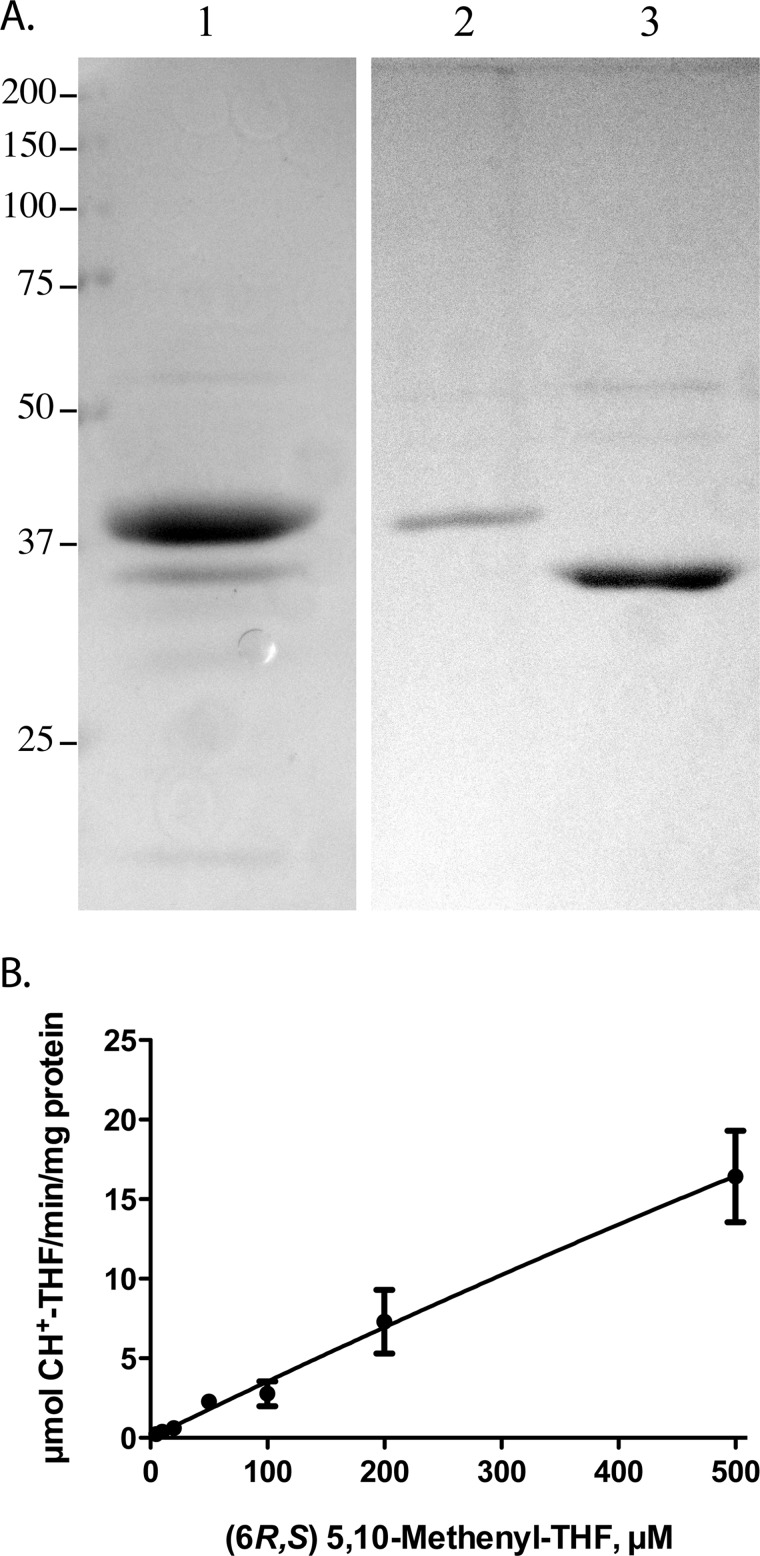
Our initial characterization of mammalian MTHFD2L relied on the recombinant full-length rat protein expressed in yeast crude extracts. Difficulties in purification, likely because of its tight association with membranes (11), prevented us from conducting a full enzymatic characterization of MTHFD2L in that study. In the present study, we overcame these problems by using several strategies. To increase the yield of recombinant protein, we replaced the mitochondrial targeting sequence of the rat MTHFD2L with an N-terminal His tag for localization in the yeast cytosol (31). Despite the loss of its targeting sequence, the protein remained associated with cellular membranes; so we included sodium carbonate in the extraction buffer to release MTHFD2L from membranes (32). Finally, we washed the Ni2+ column at room temperature rather than at 4 °C to eliminate contamination from endogenous yeast proteins (33). This washing step allowed the purification of MTHFD2L to greater than 95% homogeneity (Fig. 2A, cf. lanes 1 and 3). The mobility of the purified protein is consistent with the expected size of 33 KDa.
FIGURE 2.
Purified rat MTHFD2L possesses cyclohydrolase activity. A, His6-tagged rat MTHFD2L was purified by immobilized nickel affinity chromatography as described under “Experimental Procedures.” Lane 1 shows the imidazole elution after washing the column at 4 °C. In a second experiment, the column was washed at room temperature instead of 4 °C. Lane 2 shows the room temperature wash fractions. Lane 3 shows the imidazole elution after washing at room temperature. B, dependence of cyclohydrolase activity on (6R,S)5,10-methenyl-THF concentration. Results shown are the means ± S.E. of five replicates (error bars are included for all data points but are obscured by the data symbol when the scatter is small).
MTHFD2L Possesses 5,10-Methenyl-THF Cyclohydrolase Activity
MTHFD2L exhibits robust CH+-THF cyclohydrolase activity, confirming the bifunctional nature of this enzyme. The specific activity shown in Fig. 2B is ∼11-fold higher than the buffer-catalyzed rate. Cyclohydrolase activity could not be determined at saturating conditions due to the high absorbance of substrate, and thus accurate values for kcat and Km could not be calculated.
Steady-state Kinetics and Cofactor Specificity of 5,10-Methylene-THF Dehydrogenase Activity
We reported previously that recombinant full-length rat MTHFD2L expressed in yeast exhibits NADP+-dependent CH2-THF dehydrogenase activity in crude extracts (11). Purified MTHFD2L exhibited both NAD+- and NADP+-dependent CH2-THF dehydrogenase activity using either mono- or pentaglutamylated CH2-THF (CH2-H4PteGlu1 and CH2-H4PteGlu5, respectively). The kinetic parameters are given in Table 2. Values for kcat and Km differed between the polyglutamylation states of the CH2-THF substrate, but they were not sensitive to the redox cofactor in the dehydrogenase reaction (NAD+ or NADP+). The Km values for CH2-H4PteGlu5 were ∼3.5 times higher than those of CH2-H4PteGlu1 regardless of the redox cofactor. However, this was accompanied by a similar increase in kcat, resulting in similar kcat/Km values (Table 2). Using CH2-H4PteGlu1, the Km values for NAD+ and NADP+ were 147 ± 16 and 537 ± 54 μm, respectively (Table 2).
TABLE 2.
Kinetic parameters for MTHFD2L 5,10-methylene-THF dehydrogenase activity
Enzyme assays were performed as described under “Experimental Procedures.” CH2-THF kinetic parameters were determined using saturating concentrations of NAD+ (1.0 mm) or NADP+ (6.0 mm). When NAD+ was used, potassium phosphate (25 mm) and MgCl2 (5 mm) were also included. Redox cofactor kinetic parameters were determined using saturating concentrations of CH2-H4PteGlu1 (400 μm).
| Substrate |
Km |
kcat | kcat/Km | |
|---|---|---|---|---|
| NAD+/NADP+ | CH2THF | |||
| μm | s−1 | s−1μm−1 | ||
| NAD+ | 147 ± 16 | 3.6 ± 0.1 | 0.025 | |
| CH2-H4PteGlu1 | 40 ± 5 | 2.7 ± 0.07 | 0.067 | |
| CH2-H4PteGlu5 | 130 ± 30 | 8.8 ± 0.4 | 0.068 | |
| NADP+ | 537 ± 54 | 1.1 ± 0.04 | 0.002 | |
| CH2-H4PteGlu1 | 42 ± 7 | 1.3 ± 0.05 | 0.030 | |
| CH2-H4PteGlu5 | 153 ± 39 | 7.2 ± 0.5 | 0.047 | |
Although the dehydrogenase activity of the bifunctional MTHFD2 (an isozyme of MTHFD2L) is classified as NAD+-specific, it can also utilize NADP+ at a reduced efficiency (6). The NAD+-dependent activity of MTHFD2 requires Mg2+ and inorganic phosphate (Pi) (6). To explore redox cofactor specificity in MTHFD2L, we measured specific activity using saturating levels of NAD+ or NADP+ in the presence of Mg2+ and/or Pi (Fig. 3A). When NAD+ was used, the dehydrogenase activity of MTHFD2L was strongly dependent on the presence of Mg2+ and Pi in combination. Using CH2-H4PteGlu1 and NAD+, the Km values for Mg2+ and Pi were 233 ± 62 and 293 ± 59 μm, respectively. When NADP+ was used, MTHFD2L activity was increased slightly with Mg2+. Inorganic phosphate appeared to counteract the Mg2+ effect with NADP+ (Fig. 3A).
FIGURE 3.
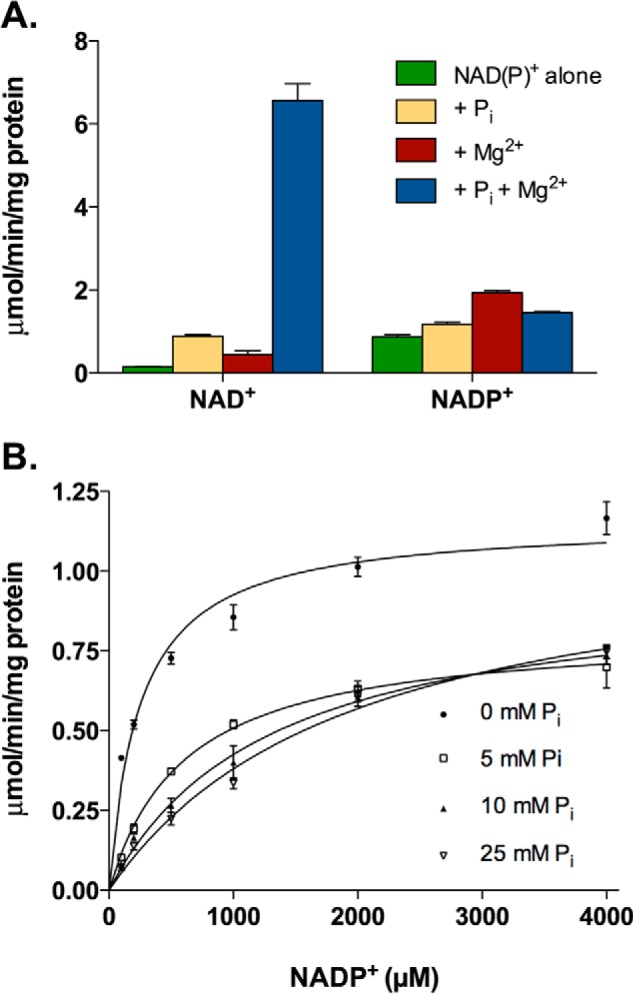
5,10-Methylene-THF dehydrogenase activity of MTHFD2L. A, purified MTHFD2L was assayed for NAD+- and NADP+-dependent 5,10-methylene-THF dehydrogenase activity in the presence or absence of Pi and Mg2+. Enzyme activity is expressed as μmol product/min/mg of protein. Each column represents the mean ± S.E. of triplicate determinations. Reaction buffer contained 50 mm HEPES (pH 8.0), 100 mm KCl, 0.4 mm 5,10-CH2-THF, and 40 mm β-mercaptoethanol. NAD+ was used at 1.0 mm and NADP+ at 6.0 mm. Mg2+ and Pi were tested by including 5.0 mm MgCl2 and 25 mm potassium phosphate where indicated. B, inhibition of NADP+-dependent 5,10-methylene-THF dehydrogenase activity by inorganic phosphate. Each point represents the mean ± S.E. of triplicate determinations (error bars are included for all data points but are obscured by the data symbol when the scatter is small). The curves represent nonlinear fits to the Michaelis-Menten model. The reaction buffer (as in A) contained 5.0 mm MgCl2 and varying concentrations of NADP+. Potassium phosphate concentrations were 0 (●), 5 (□), 10 (▴), and 25 (▿) mm.
Because MTHFD2 shows inhibition of NADP+-dependent dehydrogenase activity by inorganic phosphate (6), we sought to determine if MTHFD2L behaves in the same way. We observed that increasing concentrations of phosphate ion reduced the NADP+-dependent dehydrogenase activity of MTHFD2L (Fig. 3B). The data fit best to a competitive inhibition model with a Ki of 1.9 ± 0.3 mm.
Cofactor Specificity at Physiological Concentrations of Mg2+, Pi, and CH2-THF
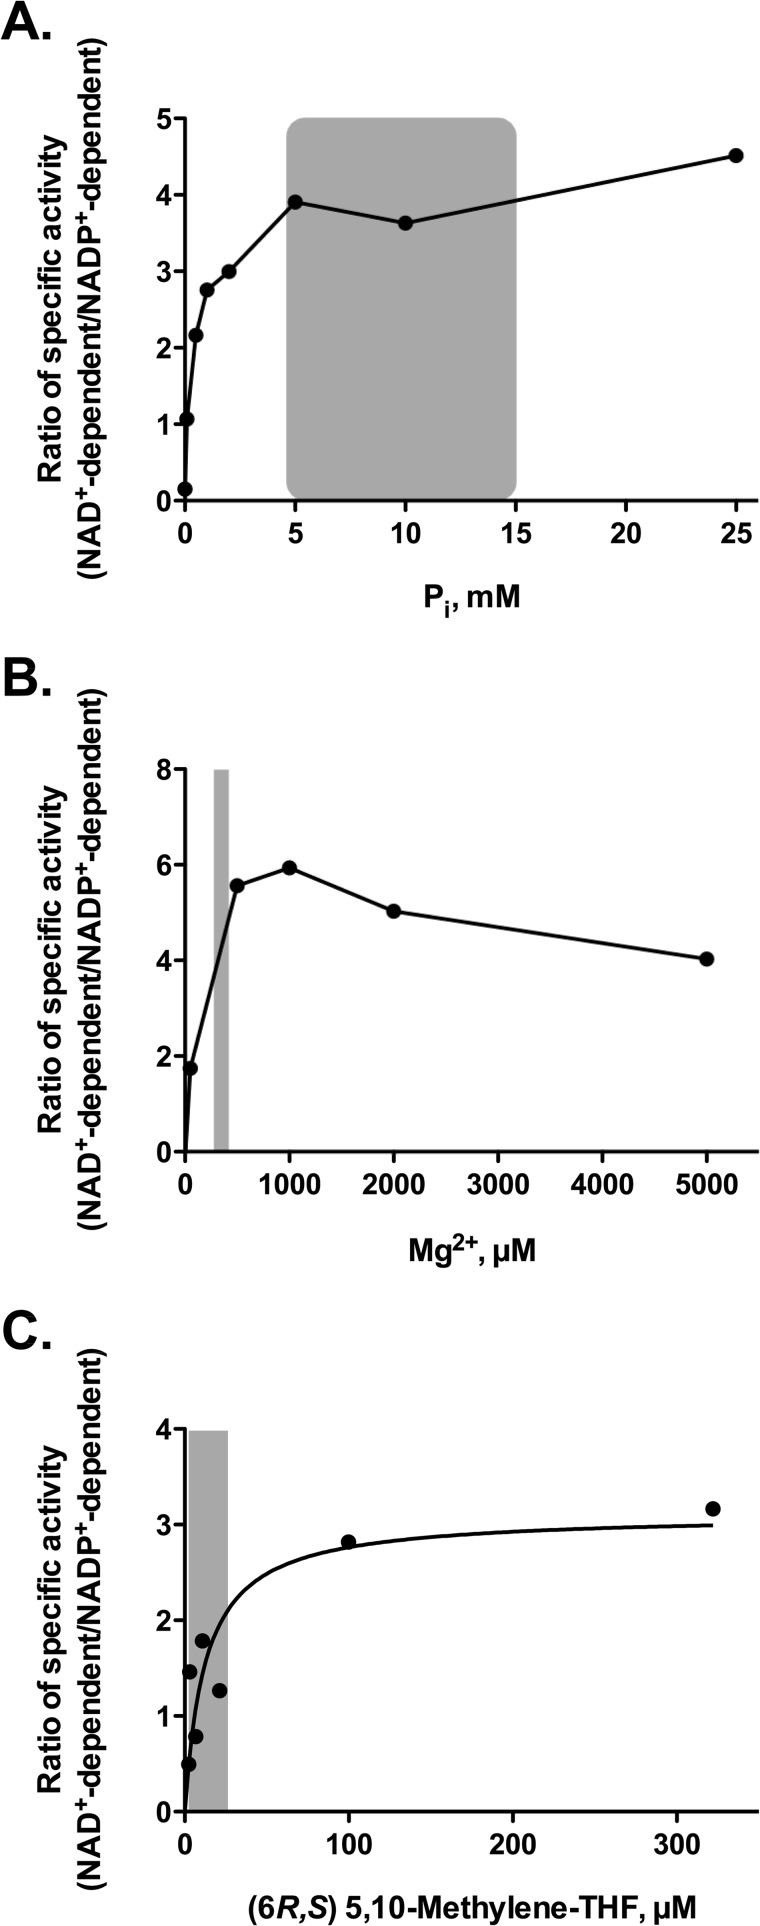
To better understand the cofactor preference (NAD+ versus NADP+) of the MTHFD2L dehydrogenase activity under physiologically relevant substrate conditions, we repeated the assay at a wide range of Pi, Mg2+, and CH2-THF concentrations. The range used includes concentrations estimated to exist in the matrix compartment of mammalian mitochondria (CH2-THF = 2.5–25 μm, Mg2+ = 0.5 mm, Pi = 10 mm; see the legend to Fig. 4 for references). For each component, the ratio of NAD+-dependent to NADP+-dependent dehydrogenase activities was plotted (Fig. 4). The data indicate that there is an ∼3.5-fold preference for NAD+ at physiological Pi concentrations (Fig. 4A) and a 5–6-fold preference for NAD+ at physiological Mg2+ concentrations (Fig. 4B). At high concentrations of CH2-THF, MTHFD2L clearly prefers NAD+ (Fig. 4C). However, as the CH2-THF concentration is lowered to more physiological levels, the ratio approaches 1, and at the lowest CH2-THF concentrations, the enzyme is more active with NADP+. This suggests that cofactor preference will be very sensitive to CH2-THF concentration in vivo.
FIGURE 4.
Redox cofactor specificity of MTHFD2L at physiological concentrations of Pi, Mg2+, and 5,10-CH2-THF. The ratio of NAD+- to NADP+-dependent 5,10-methylene-THF activity was plotted as a function of increasing concentrations of inorganic phosphate (A), Mg2+ (B), or 5,10-CH2-THF (C). Reaction buffer (described in the legend for Fig. 3) contained either 1 mm NAD+ or 6 mm NADP+. 5,10-CH2-THF was included at 0.4 mm (A and B) or varied (C). For dependence on Pi concentration (A), 5 mm MgCl2 was included for both NAD+- and NADP+-dependent reactions. For dependence on Mg2+ concentration (B), 25 mm potassium phosphate was included in NAD+-dependent but not NADP+-dependent reactions. For dependence on 5,10-CH2-THF concentration, 5 mm MgCl2 and 25 mm Pi were included in NAD+-dependent reactions. For the NADP+-dependent reactions, only 5 mm MgCl2 was included. Reported mitochondrial matrix substrate concentration ranges (indicated by shaded areas) are 5–15 mm for Pi (47–49), 0.3–0.4 mm for Mg2+ (48, 49), and 2.5–25 μm for 5,10-CH2THF (37–40), respectively. The best estimates found for in vivo mitochondrial NADP+ and NAD+ concentrations are NADP+ = 80 μm and NAD+ = 240 μm (42, 43). The data in C were fit to the Michaelis-Menten equation. The 5,10-CH2-THF concentration that gave the half-maximal ratio of NAD+- to NADP+-dependent 5,10-methylene-THF activity was 12.5 μm.
Gene Expression Profile of MTHFD Gene Family in Mouse Embryos
It has been reported previously that the MTHFD2 gene is expressed in early embryos, but its expression declines as the embryo approaches birth, and the MTHFD2 enzyme is found only in nondifferentiated tissues in adults (9, 28). We determined the relative expression profiles of all four MTHFD gene family members in mouse embryos using real-time PCR, normalizing to TBP (TATA-box-binding protein) expression. TBP has been determined to be stably expressed at multiple stages of embryonic development, making it a suitable housekeeping gene for real-time PCR experiments involving embryos (26). MTHFD1 and MTHFD1L transcript expression was highest at E8.5 and subsequently decreased until expression increased again at E13.5–17.5 (Fig. 5). MTHFD2 expression was low at all embryonic days examined. MTHFD2L was also expressed at all embryonic days examined. MTHFD2L expression was low at E8.5 but increased beginning at E10.5 (Fig. 5). These profiles suggest that a switch between MTHFD2 and MTHFD2L expression occurs approximately between embryonic days 8.5 and 10.5 during mouse embryogenesis.
FIGURE 5.
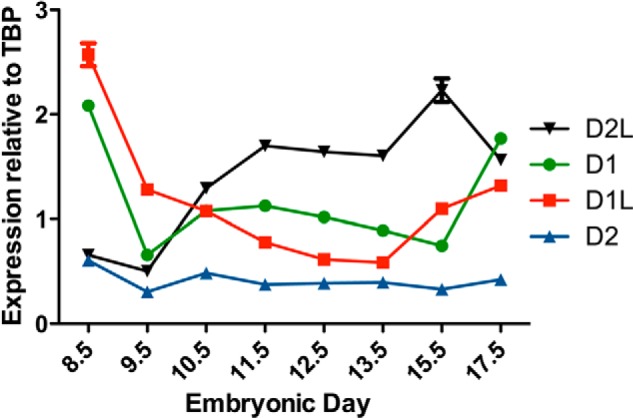
Temporal expression profile of MTHFD gene family in mouse embryos. The relative expression profiles of MTHFD1 (●), MTHFD1L (■), MTHFD2 (▴), and MTHFD2L (▾) was determined by real-time PCR as described under “Experimental Procedures.” The age of the embryos from which the RNA was obtained is indicated in embryonic days (birth occurs at ∼E20.0). mRNA expression was normalized to that of the TBP transcript. Each point represents the mean ± S.E. of triplicate determinations (error bars are included for all data points but are obscured by the data symbol when the scatter is small).
In situ hybridization of whole mouse embryos (Fig. 6) revealed that MTHFD2L is expressed in the neural tube and the forebrain, midbrain, and hindbrain, suggesting a possible role in neural tube development. Other areas of intense staining included the branchial arches and limb buds, particularly along the progress zone.
FIGURE 6.
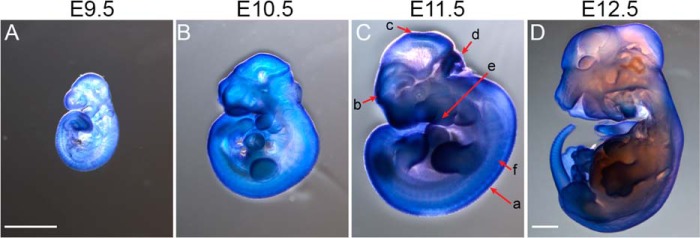
Spatial distribution of MTHFD2L expression in mouse embryos. In situ hybridizations of whole mount embryos ranging from E9.5 to E12.5 (A–D) were performed using digoxigenin-labeled UTP RNA probes as described under “Experimental Procedures.” C, as shown on the E11.5 embryo, MTHFD2L is especially prominent in the neural tube (a), forebrain (b), midbrain (c), hindbrain (d), branchial arches (e), and somites (f). Embryos A–C were imaged at the same magnification (×20). Embryo D was imaged at ×12.5 magnification. Scale bars correspond to 1 mm.
Gene Expression Profile of MTHFD Gene Family in Adult Mice
Expression of adult MTHFD genes from male and female mice was normalized to the expression of eEF2, a housekeeping gene that is stably expressed in a wide array of adult tissues (27). The MTHFD2L transcript was expressed in all of the tissues examined, with the highest expression observed in brain and lung and lower expression in liver and kidney (Fig. 7). As has been reported previously, MTHFD1 showed the highest expression in liver and kidney (34). MTHFD1L was most highly expressed in brain and spleen. The MTHFD2 transcript could be detected at low levels in most tissues, but only testis and spleen expressed it at even a modest level. The expression patterns of the four transcripts were similar in males and females.
FIGURE 7.
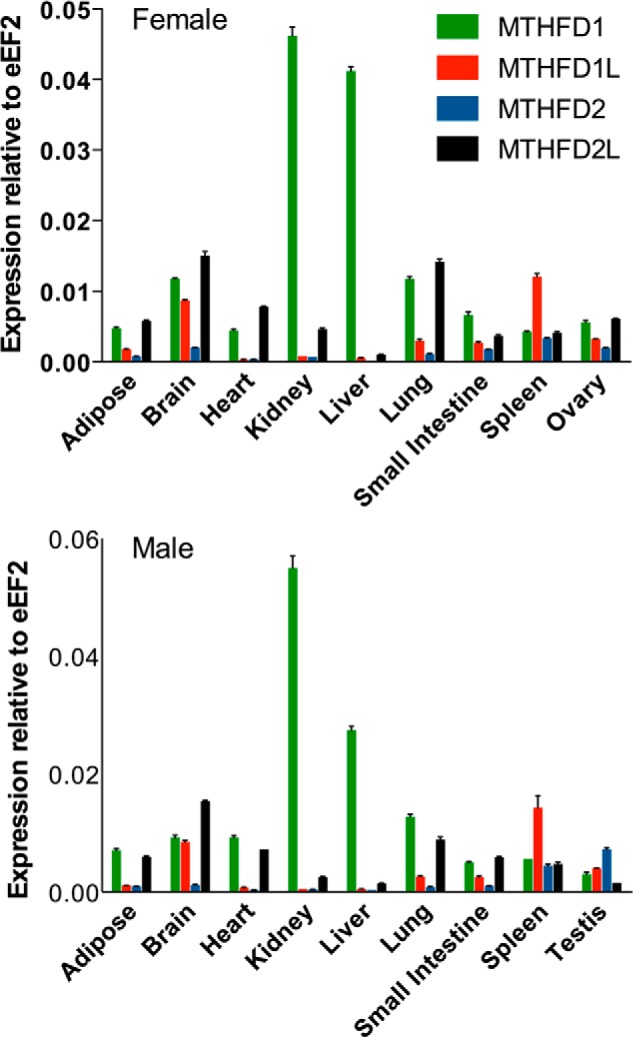
Expression profile of MTHFD gene family in adult mouse tissues. The relative expression profiles of MTHFD1 (green), MTHFD1L (red), MTHFD2 (blue), and MTHFD2L (black) was determined by real-time PCR as described under “Experimental Procedures.” mRNA expression was normalized to that of the eEF2 transcript in female (top) and male (bottom) adult mice. Each column represents the mean ± S.E. of triplicate determinations.
Alternative Splicing of MTHFD2L
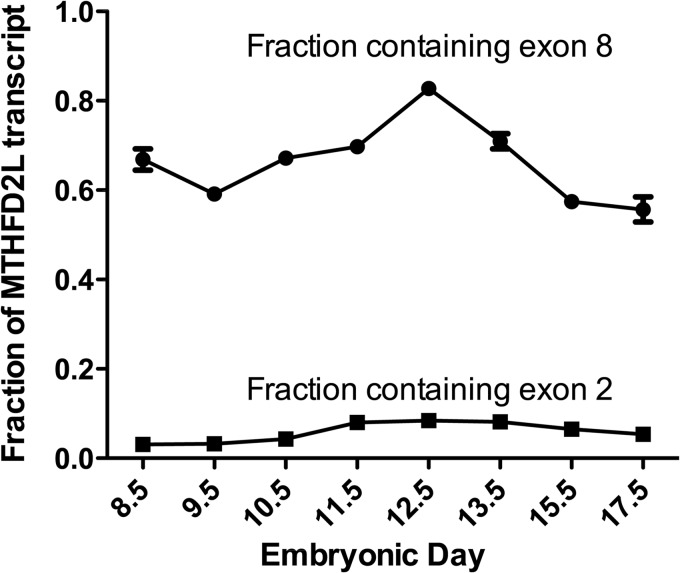
We have shown previously that MTHFD2L is alternatively spliced at exons 2 and 8 (11), with either exon skipped or included in the mature mRNA. The skipping of exon 2 and inclusion of exon 8 produces an enzymatically active enzyme of 347 residues (including the 40-residue mitochondrial targeting sequence) (11). The inclusion of exon 2 results in the introduction of an early stop codon. However, translation beginning from an ATG in exon 3 is predicted to produce a truncated protein missing the mitochondrial targeting sequence. When exon 8 is skipped, exon 7 is spliced to exon 9 with the reading frame intact, resulting in deletion of 43 codons. Using total embryo RNA from embryos ages E8.5 to E17.5, we observed that exon 2 was present in less than 10% of the transcripts in all of the embryonic days examined (Fig. 8), indicating that the vast majority of MTHFD2L transcripts encode a mitochondrial targeting sequence. Exon 8, on the other hand, was found to be missing in 20–45% of the MTHFD2L transcripts throughout embryogenesis (Fig. 8).
FIGURE 8.
MTFHD2L splice variants during mouse development. The relative abundance of exon 2- (■) and exon 8-containing (●) MTHFD2L transcripts was determined by real-time PCR and analyzed as described under “Experimental Procedures.” Each point represents the mean ± S.E. of triplicate determinations (‘bars are included for all data points but are obscured by the data symbol when the scatter is small).
To determine what effect the removal of exon 8 would have on MTHFD2L activity, MTHFD2L lacking exon 8 was expressed in yeast. NAD+-dependent CH2-THF dehydrogenase activity could not be detected in crude yeast lysate from yeast cells transformed with the truncated construct (YEp-rD2L-x8; data not shown). NAD+-dependent CH2-THF dehydrogenase activity was easily detectable in lysate from yeast cells transformed with the full-length construct.
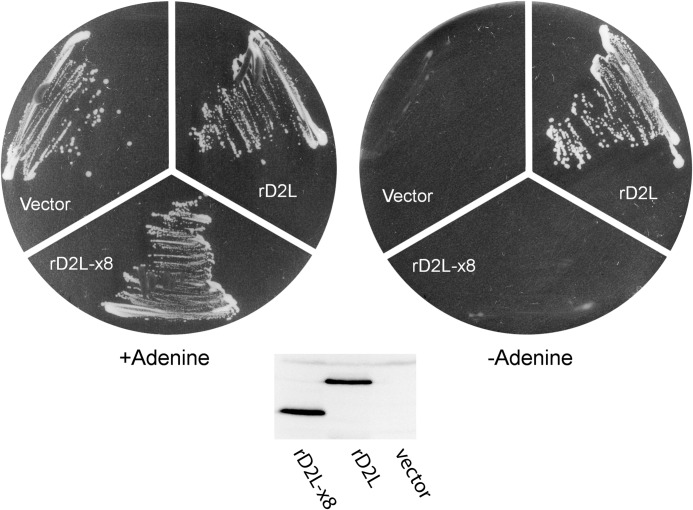
We next asked whether MTHFD2L lacking exon 8 was active in vivo, using a yeast complementation assay (11). Briefly, this assay uses yeast strain MWY4.5, which lacks cytoplasmic CH2-THF dehydrogenase activities as well as the 10-formyl-THF synthetase activity of the cytoplasmic trifunctional C1-THF synthase (35). Wild-type yeast can produce 10-CHO-THF for de novo purine biosynthesis from serine using either cytoplasmic or mitochondrial 1C pathways (36) (see Fig. 1). However, MWY4.5 is blocked in both pathways to 10-CHO-THF. This blockage creates a requirement for adenine in the growth medium (35). Cytoplasmically localized MTHFD2L lacking exon 8 should rescue the adenine requirement of MWY4.5 if it is catalytically active in vivo. Transformants of MWY4.5 harboring YEp-rD2L-x8, YEp-rD2L (full-length MTHFD2L) (11), or empty vector (YEp24ES) were streaked onto yeast minimal plates containing serine as a one-carbon donor or serine + adenine and incubated at 30 °C. As shown in Fig. 9, full-length MTHFD2L, expressed from YEp-rD2L as a positive control, fully complemented the adenine requirement of MWY4.5, as observed previously (11). However, MTHFD2L lacking exon 8, expressed from the rD2L-x8 plasmid, did not complement the adenine requirement. An immunoblot of crude yeast lysates from these transformants confirmed that the truncated protein was expressed at a level similar to that of the full-length protein in control cells (Fig. 9, inset). These in vitro and in vivo results suggest that the MTHFD2L variant lacking exon 8 does not function as a CH2-THF dehydrogenase.
FIGURE 9.
Expression of MTHFD2L lacking exon 8 in yeast. S. cerevisiae strain MWY4.5 (ser1 ura3 trp1 leu2 his4 ade3–30/65 Δmtd1) was transformed to uracil prototrophy with YEp-rD2L (wild type), YEp-rD2L-x8 (lacking exon 8), or empty vector (YEp24ES). Ura+ transformants were streaked onto yeast minimal plates containing serine as a one-carbon donor plus adenine (left) or serine alone (right) and incubated at 30 °C for 4 days. Both plates also contained leucine, tryptophan, and histidine to support the other auxotrophic requirements of MWY4.5. Inset, immunoblot of whole cell lysate from MWY4.5 transformed with the indicated plasmids. Each lane was loaded with 50 μg of protein. The blot was probed with polyclonal antibodies against MTHFD2L (1:1000 dilution).
DISUSSION
The experiments described here demonstrate that the mammalian MTHFD2L isozyme, like MTHFD1 and MTHFD2, possesses both CH2-THF dehydrogenase and CH+-THF cyclohydrolase activities (Fig. 2). The dehydrogenase activity of this bifunctional enzyme can use either NAD+ or NADP+ but requires both phosphate and Mg2+ when using NAD+ (Fig. 3A). The NADP+-dependent dehydrogenase activity of MTHFD2L is inhibited by inorganic phosphate (Fig. 3B). MTHFD2L can use the mono- and polyglutamylated forms of CH2-THF with similar catalytic efficiencies (kcat/Km; Table 2). Expression of the MTHFD2L transcript is low in early mouse embryos, begins to increase at E10.5, and continues through birth (Fig. 5). In adults, MTHFD2L was expressed in all tissues examined, with the highest levels observed in brain and lung (Fig. 7).
How do these cofactor requirements compare with those of the other CH2-THF dehydrogenase/CH+-THF cyclohydrolase found in mammalian mitochondria? The MTFHD2 isozyme has been named NAD+-dependent methylenetetrahydrofolate dehydrogenase-methenyltetrahydrofolate cyclohydrolase (6, 10) but in fact exhibits dehydrogenase activity with NADP+, albeit with a much higher Km and lower Vmax (6). In fact, the redox cofactor requirements of the two isozymes are quite similar: both exhibit lower Km values for NAD+ than for NADP+; their NAD+-dependent activities require phosphate and Mg2+; and their NADP+-dependent activities are inhibited by phosphate. The absolute requirement of the NAD+-dependent activity of MTHFD2 for Mg2+ and Pi has been characterized in great detail by Mackenzie and co-workers (10). MTHFD2 uses Mg2+ and Pi to convert an NADP binding site into an NAD binding site. Pi binds in close proximity to the 2′-hydroxyl of NAD and competes with NADP binding. Mg2+ plays a role in positioning Pi and NAD. Mackenzie and co-workers (10) identified several amino acid residues in MTHFD2 that are involved in the Pi and Mg2+ binding, and these residues are highly conserved in MTHFD2L in mammals. It is thus likely that Mg2+ and Pi play a mechanistically similar role in the NAD+-dependent dehydrogenase activity of MTHFD2L as well.
At saturating levels of CH2-THF, using NAD+ as a cofactor, the kcat/Km value for the CH2-THF dehydrogenase reaction of MTHFD2 is 2.9 s−1μm−1 (8). This value is ∼45-fold higher than the efficiency exhibited by MTHFD2L (kcat/Km = 0.067 s−1μm−1). These differences in kinetic parameters are unlikely to be due to different assay conditions. When we performed the CH2-THF dehydrogenase assay under buffer conditions that were used to characterize MTHFD2 (MOPS (pH 7.3)) rather than the HEPES (pH 8.0) used in this article, we did not observe significant changes in the values for kcat or Km (data not shown).
The apparent preference of MTHFD2L for NAD+ (Fig. 3A) is most dramatic at nonphysiological levels of phosphate, Mg2+, and folate cofactor. When these experiments were repeated at more physiologically relevant substrate concentrations, MTHFD2L showed much less preference for NAD+ (Fig. 4). In fact, at CH2-THF concentrations below 10 μm, the enzyme is more active with NADP+ than with NAD+ (Fig. 4C). Given that estimates for mitochondrial matrix levels of CH2-THF range from 2.5 to 25 μm (37–40), it is likely that MTHFD2L exhibits dual redox cofactor specificity in vivo.
The use of NAD+ versus NADP+ in this step can have a dramatic effect on the rate and direction of flux of one-carbon units through this pathway in mitochondria. The oxidation state of mitochondrial pools of NAD+ and NADP+ is dictated by mitochondrial respiration (41), which in turn is linked to nutrition, differentiation, and proliferation (42). Measurements in liver suggest that the redox potential of the NAD+/NADH matrix pool is typically 75–100 mV more positive than that of the NADP+/NADPH matrix pool (41, 43). Thus, the ratio of CH2-THF to 10-CHO-THF in the matrix (reactions 3m and 2m in Fig. 1) will be shifted much further toward 10-CHO-THF with a CH2-THF dehydrogenase linked to the NAD+/NADH pool versus the NADP+/NADPH pool (6, 7). A cyclohydrolase/dehydrogenase with dual cofactor specificity, such as MTHFD2L, would be able to adapt immediately to changing metabolic conditions, shifting the equilibrium between CH2-THF and 10-CHO-THF (and formate) depending on the relative levels of oxidized cofactor (NAD+ or NADP+) in the mitochondrial matrix. We do not know whether the MTHFD2 isozyme might also exhibit dual redox cofactor specificity in vivo, as it was not characterized at physiologically relevant substrate concentrations (6, 10).
We determined expression profiles for the entire MTHFD family of genes during mouse embryogenesis (Fig. 5) and in adult tissues (Fig. 7). The results for MTHFD1 (cytoplasmic reactions 1–3 (Fig. 1)) and MTHFD1L (mitochondrial reaction 1m) are qualitatively similar to previously reported transcript expression patterns in mouse embryos based on a staged Northern blot (28). Both transcripts are highest in early embryos and decrease during embryonic days 9.5–15.5, only to increase again as the embryo approaches birth. MTHFD2 and MTHFD2L, on the other hand, exhibit very different expression profiles. MTHFD2 expression was low in all embryonic days examined, whereas expression of the MTHFD2L transcript increased beginning at E10.5 and remained elevated through birth (Fig. 5). These data reveal a switch from MTHFD2 to MTHFD2L expression at about the time of neural tube closure in mouse embryos. The spatial expression of MTHFD2L is localized to the neural tube, developing brain, branchial arches, and limb buds (Fig. 6). These regions are also areas where MTHFD2 and MTHFD1L are expressed (28), suggesting a role for the mitochondrial folate pathway in these embryonic tissues.
Why might mammals possess these two distinct mitochondrial dehydrogenase/cyclohydrolase isozymes? It appears that under most conditions, the majority of 1C units for cytoplasmic processes are derived from mitochondrial formate (1). Oxidation of mitochondrial CH2-THF is essential for the production of 10-CHO-THF, which is processed by MTHFD1L to provide formate for cytoplasmic export (Fig. 1). This formate is then reattached to THF for use in de novo purine biosynthesis or further reduced for either thymidylate synthesis or remethylation of homocysteine to methionine. Modeling studies suggest that the oxidation step (reaction 3m (Fig. 1)), catalyzed by either MTHFD2 or MTHFD2L, is a critical control point for mitochondrial 1C metabolism. Using an in silico model, Nijhout et al. (37) observed that the exclusion of CH2-THF dehydrogenase and CH+-THF cyclohydrolase activities from the mitochondrial folate pathway results in loss of formate export and a dramatic increase in mitochondrial serine production for gluconeogenesis. When CH2-THF dehydrogenase and CH+-THF cyclohydrolase activities are included in the model, the mitochondrial folate pathway produces formate for cytosolic export, where it is incorporated into purines, thymidylate, and the methyl cycle (37). Christensen and MacKenzie (44) have proposed that the level of MTHFD2 expression could act as a metabolic switch to control the balance between serine and formate production.
We suggest that the existence of two mitochondrial dehydrogenase/cyclohydrolase isozymes in mammals (MTHFD2 and MTHFD2L) reflects the need to tightly regulate flux through this oxidation step in response to changing metabolic conditions and needs. For example, de novo purine biosynthesis is especially important in rapidly dividing cells, such as during embryogenesis. Thus, early embryos express both MTHFD2 and MTHFD2L isozymes, ensuring that mitochondrial formate production is adequate to support de novo purine biosynthesis. Indeed, embryonic growth and neural tube closure requires mitochondrial formate production (45). Compared with embryos, however, adult mammals do not have a high demand for de novo purine biosynthesis (46). The loss of expression of MTHFD2 as the embryos approach birth may reflect the lower demand for de novo purine biosynthesis in neonate and adult mammals.
In addition to switching between expressing one or two mitochondrial CH2-THF dehydrogenase/CH+-THF cyclohydrolase enzymes, there may be other ways of regulating MTHFD2L expression such as alternative splicing. We have shown previously that an exon 8 deletion is present in adult tissues (11). We observed significant expression of this same splice variant of MTHFD2L throughout embryogenesis (Fig. 8). However the protein that would be produced from the transcript lacking exon 8 did not show activity in vitro or in vivo (Fig. 9), and the function of this splice variant is unknown.
Acknowledgments
We thank Nafee Talukder for assistance with the purification of recombinant MTHFD2L and Jordan Lewandowski for performing the in situ hybridizations.
This work was supported, in whole or in part, by National Institutes of Health Grants F32HD074428 (to J. M.) from the Eunice Kennedy Shriver NICHD and GM086856 (to D. R. A.) from NIGMS.
- 1C
- one carbon
- THF
- tetrahydrofolate
- CH+-THF
- 5,10-methenyltetrahydrofolate
- CH2-THF
- 5,10-methylenetetrahydrofolate
- 10-CHO-THF
- 10-formyltetrahydrofolate
- MTHFD
- methylenetetrahydrofolate dehydrogenase
- eEF2
- eukaryotic translation elongation factor 2
- TBP
- TATA-box-binding protein.
REFERENCES
- 1. Tibbetts A. S., Appling D. R. (2010) Compartmentalization of mammalian folate-mediated one-carbon metabolism. Annu. Rev. Nutr. 30, 57–81 [DOI] [PubMed] [Google Scholar]
- 2. Walkup A. S., Appling D. R. (2005) Enzymatic characterization of human mitochondrial C1-tetrahydrofolate synthase. Arch. Biochem. Biophys. 442, 196–205 [DOI] [PubMed] [Google Scholar]
- 3. Mejia N. R., MacKenzie R. E. (1985) NAD-dependent methylenetetrahydrofolate dehydrogenase is expressed by immortal cells. J. Biol. Chem. 260, 14616–14620 [PubMed] [Google Scholar]
- 4. Mejia N. R., Rios-Orlandi E. M., MacKenzie R. E. (1986) NAD-dependent methylenetetrahydrofolate dehydrogenase-methenyltetrahydrofolate cyclohydrolase from ascites tumor cells: purification and properties. J. Biol. Chem. 261, 9509–9513 [PubMed] [Google Scholar]
- 5. Mejia N. R., MacKenzie R. E. (1988) NAD-dependent methylenetetrahydrofolate dehydrogenase-methenyltetrahydrofolate cyclohydrolase in transformed cells is a mitochondrial enzyme. Biochem. Biophys. Res. Comm. 155, 1–6 [DOI] [PubMed] [Google Scholar]
- 6. Yang X. M., MacKenzie R. E. (1993) NAD-dependent methylenetetrahydrofolate dehydrogenase-methenyltetrahydrofolate cyclohydrolase is the mammalian homolog of the mitochondrial enzyme encoded by the yeast MIS1 gene. Biochemistry 32, 11118–11123 [DOI] [PubMed] [Google Scholar]
- 7. Pelletier J. N., MacKenzie R. E. (1995) Binding and interconversion of tetrahydrofolates at a single site in the bifunctional methylenetetrahydrofolate dehydrogenase/cyclohydrolase. Biochemistry 34, 12673–12680 [DOI] [PubMed] [Google Scholar]
- 8. Pawelek P. D., MacKenzie R. E. (1998) Methenyltetrahydrofolate cyclohydrolase is rate limiting for the enzymatic conversion of 10-formyltetrahydrofolate to 5,10- methylenetetrahydrofolate in bifunctional dehydrogenase-cyclohydrolase enzymes. Biochemistry 37, 1109–1115 [DOI] [PubMed] [Google Scholar]
- 9. Di Pietro E., Wang X. L., MacKenzie R. E. (2004) The expression of mitochondrial methylenetetrahydrofolate dehydrogenase-cyclohydrolase supports a role in rapid cell growth. Biochim. Biophys. Acta 1674, 78–84 [DOI] [PubMed] [Google Scholar]
- 10. Christensen K. E., Mirza I. A., Berghuis A. M., Mackenzie R. E. (2005) Magnesium and phosphate ions enable NAD binding to methylenetetrahydrofolate dehydrogenase-methenyltetrahydrofolate cyclohydrolase. J. Biol. Chem. 280, 34316–34323 [DOI] [PubMed] [Google Scholar]
- 11. Bolusani S., Young B. A., Cole N. A., Tibbetts A. S., Momb J., Bryant J. D., Solmonson A., Appling D. R. (2011) Mammalian MTHFD2L Encodes a mitochondrial methylenetetrahydrofolate dehydrogenase isozyme expressed in adult tissues. J. Biol. Chem. 286, 5166–5174 [DOI] [PMC free article] [PubMed] [Google Scholar]
- 12. Blakley R. L. (1957) The interconversion of serine and glycine: preparation and properties of catalytic derivatives of pteroylglutamic acid. Biochem. J. 65, 331–342 [DOI] [PMC free article] [PubMed] [Google Scholar]
- 13. Curthoys N. P., Rabinowitz J. C. (1971) Formyltetrahydrofolate synthetase: binding of adenosine triphosphate and related ligands determined by partition equilibrium. J. Biol. Chem. 246, 6942–6952 [PubMed] [Google Scholar]
- 14. Appling D. R., West M. G. (1997) Monofunctional NAD-dependent, 5,10-methylenetetrahydrofolate dehydrogenase from Saccharomyces cerevisiae. Methods Enzymol. 281, 178–188 [DOI] [PubMed] [Google Scholar]
- 15. Kallen R. G., Jencks W. P. (1966) The mechanism of the condensation of formaldehyde with tetrahydrofolic acid. J. Biol. Chem. 241, 5851–5863 [PubMed] [Google Scholar]
- 16. Rabinowitz J. C. (1963) Preparation and properties of 5,10-methenyltetrahydrofolic acid and 10-formyltetrahydrofolic acid. Methods Enzymol. 6, 814–815 [Google Scholar]
- 17. Suliman H. S., Sawyer G. M., Appling D. R., Robertus J. D. (2005) Purification and properties of cobalamin-independent methionine synthase from Candida albicans and Saccharomyces cerevisiae. Arch. Biochem. Biophys. 441, 56–63 [DOI] [PubMed] [Google Scholar]
- 18. Claros M. G., Vincens P. (1996) Computational method to predict mitochondrially imported proteins and their targeting sequences. Eur. J. Biochem. 241, 779–786 [DOI] [PubMed] [Google Scholar]
- 19. Li M. Z., Elledge S. J. (2007) Harnessing homologous recombination in vitro to generate recombinant DNA via SLIC. Nat. Methods 4, 251–256 [DOI] [PubMed] [Google Scholar]
- 20. West M. G., Barlowe C. K., Appling D. R. (1993) Cloning and characterization of the Saccharomyces cerevisiae gene encoding NAD-dependent 5,10-methylenetetrahydrofolate dehydrogenase. J. Biol. Chem. 268, 153–160 [PubMed] [Google Scholar]
- 21. Gietz R. D., Woods R. A. (2002) Transformation of yeast by lithium acetate/single-stranded carrier DNA/polyethylene glycol method. Methods Enzymol. 350, 87–96 [DOI] [PubMed] [Google Scholar]
- 22. Wagner W., Breksa A. P., 3rd, Monzingo A. F., Appling D. R., Robertus J. D. (2005) Kinetic and structural analysis of active site mutants of monofunctional NAD-dependent 5,10-methylenetetrahydrofolate dehydrogenase from Saccharomyces cerevisiae. Biochemistry 44, 13163–13171 [DOI] [PubMed] [Google Scholar]
- 23. Palmer K. F., Williams D. (1974) Optical properties of water in the near infrared. J. Opt. Soc. Am. 64, 1107–1110 [Google Scholar]
- 24. Barlowe C. K., Appling D. R. (1990) Isolation and characterization of a novel eukaryotic monofunctional NAD+-dependent 5,10-methylenetetrahydrofolate dehydrogenase. Biochemistry 29, 7089–7094 [DOI] [PubMed] [Google Scholar]
- 25. Ye J., Coulouris G., Zaretskaya I., Cutcutache I., Rozen S., Madden T. L. (2012) Primer-BLAST: a tool to design target-specific primers for polymerase chain reaction. BMC Bioinformatics 13, 134. [DOI] [PMC free article] [PubMed] [Google Scholar]
- 26. Willems E., Mateizel I., Kemp C., Cauffman G., Sermon K., Leyns L. (2006) Selection of reference genes in mouse embryos and in differentiating human and mouse ES cells. Int. J. Dev. Biol. 50, 627–635 [DOI] [PubMed] [Google Scholar]
- 27. Kouadjo K. E., Nishida Y., Cadrin-Girard J. F., Yoshioka M., St-Amand J. (2007) Housekeeping and tissue-specific genes in mouse tissues. BMC Genomics 8, 127. [DOI] [PMC free article] [PubMed] [Google Scholar]
- 28. Pike S. T., Rajendra R., Artzt K., Appling D. R. (2010) Mitochondrial C1-THF synthase (MTHFD1L) supports flow of mitochondrial one-carbon units into the methyl cycle in embryos. J. Biol. Chem. 285, 4612–4620 [DOI] [PMC free article] [PubMed] [Google Scholar]
- 29. Kawai J., Shinagawa A., Shibata K., Yoshinom M., Itoh M., Ishii Y., Arakawa T., Hara A., Fukunishi Y., Konno H., Adachi J., Fukuda S., Aizawa K., Izawa M., Nishi K., Kiyosawa H., Kondo S., Yamanaka I., Saito T., Okazaki Y., Gojobori T., Bono H., Kasukawa T., Saito R., Kadota K., Matsuda H., Ashburner M., Batalov S., Casavant T., Fleischmann W., Gaasterland T., Gissi C., King B., Kochiwa H., Kuehl P., Lewis S., Matsuo Y., Nikaido I., Pesole G., Quackenbush J., Schriml L. M., Staubli F., Suzuki R., Tomita M., Wagner L., Washio T., Sakai K., Okido T., Furuno M., Aono H., Baldarelli R., Barsh G., Blake J., Boffelli D., Bojunga N., Carninci P., de Bonaldo M. F., Brownstein M. J., Bult C., Fletcher C., Fujita M., Gariboldi M., Gustincich S., Hill D., Hofmann M., Hume D. A., Kamiya M., Lee N. H., Lyons P., Marchionni L., Mashima J., Mazzarelli J., Mombaerts P., Nordone P., Ring B., Ringwald M., Rodriguez I., Sakamoto N., Sasaki H., Sato K., Schönbach C., Seya T., Shibata Y., Storch K. F., Suzuki H., Toyo-oka K., Wang K. H., Weitz C., Whittaker C., Wilming L., Wynshaw-Boris A., Yoshida K., Hasegawa Y., Kawaji H., Kohtsuki S., Hayashizaki Y, RIKEN Genome Exploration Research Group Phase II Team, and the FANTOM Consortium (2001) Functional annotation of a full-length mouse cDNA collection. Nature 409, 685–690 [DOI] [PubMed] [Google Scholar]
- 30. Ho S. N., Hunt H. D., Horton R. M., Pullen J.K., Pease L. R. (1989) Site-directed mutagenesis by overlap extension using the polymerase chain reaction. Gene. 77, 51–59 [DOI] [PubMed] [Google Scholar]
- 31. Zhang L., Joshi A. K., Smith S. (2003) Cloning, expression, characterization, and interaction of two components of a human mitochondrial fatty acid synthase: malonyltransferase and acyl carrier protein. J. Biol. Chem. 278, 40067–40074 [DOI] [PubMed] [Google Scholar]
- 32. Prasannan P., Appling D. R. (2009) Human mitochondrial C1-tetrahydrofolate synthase: submitochondrial localization of the full-length enzyme and characterization of a short isoform. Arch. Biochem. Biophys. 481, 86–93 [DOI] [PMC free article] [PubMed] [Google Scholar]
- 33. Dihazi H., Kessler R., Eschrich K. (2001) One-step purification of recombinant yeast 6-phosphofructo-2-kinase after the identification of contaminants by MALDI-TOF MS. Protein Expr. Purif. 21, 201–209 [DOI] [PubMed] [Google Scholar]
- 34. Thigpen A. E., West M. G., Appling D. R. (1990) Rat C1-tetrahydrofolate synthase: cDNA isolation, tissue-specific levels of the mRNA, and expression of the protein in yeast. J. Biol. Chem. 265, 7907–7913 [PubMed] [Google Scholar]
- 35. West M. G., Horne D. W., Appling D. R. (1996) Metabolic role of cytoplasmic isozymes of 5,10-methylenetetrahydrofolate dehydrogenase in Saccharomyces cerevisiae. Biochemistry 35, 3122–3132 [DOI] [PubMed] [Google Scholar]
- 36. Barlowe C. K., Appling D. R. (1990) Molecular genetic analysis of Saccharomyces cerevisiae C1-tetrahydrofolate synthase mutants reveals a noncatalytic function of the ADE3 gene product and an additional folate-dependent enzyme. Mol. Cell. Biol. 10, 5679–5687 [DOI] [PMC free article] [PubMed] [Google Scholar]
- 37. Nijhout H. F., Reed M. C., Lam S. L., Shane B., Gregory J. F., 3rd, Ulrich C. M. (2006) In silico experimentation with a model of hepatic mitochondrial folate metabolism. Theor. Biol. Med. Model. 3, 40. [DOI] [PMC free article] [PubMed] [Google Scholar]
- 38. Seither R. L., Trent D. F., Mikulecky D. C., Rape T. J., Goldman I. D. (1989) Folate-pool interconversions and inhibition of biosynthetic processes after exposure of L1210 leukemia cells to antifolates: experimental and network thermodynamic analyses of the role of dihydrofolate polyglutamates in antifolate action in cells. J. Biol. Chem. 264, 17016–17023 [PubMed] [Google Scholar]
- 39. Horne D. W., Patterson D., Cook R. (1989) Effect of nitrous oxide inactivation of vitamin B12-dependent methionine synthetase on the subcellular distribution of folate coenzymes in rat liver. Arch. Biochem. Biophys. 270, 729–733 [DOI] [PubMed] [Google Scholar]
- 40. Eto I., Krumdieck C. L. (1982) Determination of three different pools of reduced one-carbon-substituted folates. III. Reversed-phase high-performance liquid chromatography of the azo dye derivatives of p-aminobenzoylpoly-γ-glutamates and its application to the study of unlabeled endogenous pteroylpolyglutamates of rat liver. Anal. Biochem. 120, 323–329 [DOI] [PubMed] [Google Scholar]
- 41. Veech R. L. (1987) Pyridine nucleotides and control of metabolic processes, in Pyridine Nucleotide Coenzymes: Chemical, Biochemical, and Medical Aspects, Part B (Dolphin D., Poulson R., Avramovic O., eds) pp. 79–105, John Wiley & Sons, New York [Google Scholar]
- 42. Yang H., Yang T., Baur J. A., Perez E., Matsui T., Carmona J. J., Lamming D. W., Souza-Pinto N. C., Bohr V. A., Rosenzweig A., de Cabo R., Sauve A. A., Sinclair D. A. (2007) Nutrient-sensitive mitochondrial NAD+ levels dictate cell survival. Cell 130, 1095–1107 [DOI] [PMC free article] [PubMed] [Google Scholar]
- 43. Sies H. (1982) Nicotinamide nucleotide compartmentation, in Metabolic Compartmentation (Sies H., ed) pp. 205–231, Academic Press, New York [Google Scholar]
- 44. Christensen K. E., MacKenzie R. E. (2006) Mitochondrial one-carbon metabolism is adapted to the specific needs of yeast, plants and mammals. Bioessays 28, 595–605 [DOI] [PubMed] [Google Scholar]
- 45. Momb J., Lewandowski J. P., Bryant J. D., Fitch R., Surman D. R., Vokes S. A., Appling D. R. (2013) Deletion of Mthfd1l causes embryonic lethality and neural tube and craniofacial defects in mice. Proc. Natl. Acad. Sci. U.S.A. 110, 549–554 [DOI] [PMC free article] [PubMed] [Google Scholar]
- 46. Alexiou M., Leese H. J. (1992) Purine utilisation, de novo synthesis and degradation in mouse preimplantation embryos. Development 114, 185–192 [DOI] [PubMed] [Google Scholar]
- 47. Albe K. R., Butler M. H., Wright B. E. (1990) Cellular concentrations of enzymes and their substrates. J. Theor. Biol. 143, 163–195 [DOI] [PubMed] [Google Scholar]
- 48. Corkey B. E., Duszynski J., Rich T. L., Matschinsky B., Williamson J. R. (1986) Regulation of free and bound magnesium in rat hepatocytes and isolated mitochondria. J. Biol. Chem. 261, 2567–2574 [PubMed] [Google Scholar]
- 49. Saleet Jafri M., Kotulska M. (2006) Modeling the mechanism of metabolic oscillations in ischemic cardiac myocytes. J. Theor. Biol. 242, 801–817 [DOI] [PubMed] [Google Scholar]


