

Background: Estrogen receptor α (ERα) mediates the effects of 17β-estradiol in mammary gland, and it is associated with the development of breast cancer tumors.
Results: Tristetraprolin (TTP) represses ERα transactivation through its interaction with histone deacetylases.
Conclusion:TTP acts as a novel ERα corepressor.
Significance: TTP reduces estradiol-induced cell proliferation and tumor growth, suggesting it may be important in breast cancer development.
Keywords: Corepressor Transcription, Estrogen Receptor, Gene Regulation, Hormone Receptors, Nuclear Receptors, Tristetraprolin
Abstract
Estrogen receptor α (ERα) mediates the effects of 17β-estradiol (E2) in normal mammary gland, and it is a key participant in breast cancer tumor development. ERα transactivation activity is mediated by the synergistic interaction of two domains designated AF1 and AF2. The function of AF2 is to recruit coactivator and corepressor proteins that allow ERα to oscillate between the roles of transcriptional activator and repressor. In contrast, the mechanism responsible for AF-1 transcriptional activity is not completely understood. In this study, we identified tristetraproline (TTP) as a novel ERα-associated protein. TTP expression in MCF7 cells repressed ERα transactivation and reduced MCF7 cell proliferation and the ability of the cells to form tumors in a mouse model. We show that TTP transcriptional activity is mediated through its recruitment to the promoter region of ERα target genes and its interaction with histone deacetylases, in particular with HDAC1. TTP expression attenuates the coactivating activity of SRC-1, suggesting that exchange between TTP and other coactivators may play an important role in fine-tuning ERα transactivation. These results indicate that TTP acts as a bona fide ERα corepressor and suggest that this protein may be a contributing factor in the development of E2-dependent tumors in breast cancer.
Introduction
The estrogen receptor α (ERα)4 is a ligand-activated transcription factor that mediates the effects of the hormone estrogen (17β-estradiol; E2) on cell proliferation and differentiation in normal mammary gland. However, ERα is also associated with tumor development and progression in 70–80% of breast cancer patients (1). ERα is a 595-amino acid protein characterized by the presence of functionally independent domains that include a DNA-binding domain (DBD), a ligand-binding domain, and two transactivation domains designated AF1 and AF2, respectively (2). AF1 is located at the N-terminal region of ERα, and its transcriptional activity is constitutive. In contrast, AF2 is located at the C-terminal region of the nuclear receptor and exhibits ligand-dependent transcriptional activity (3, 4). Both domains mediate ERα transactivation activity through the synergistic interaction of their unique functional properties.
The mechanism responsible for ERα transactivation is best understood in the context of AF2. This transactivation domain acts as a docking interphase for the recruitment of coactivator or corepressor protein complexes. Mechanistically, the binding of E2 induces a major structural rearrangement in ERα, enabling the ligand-binding domain/AF2 domain to interact with multiple coactivator proteins (5, 6). Coactivators, such as SRC-1, SRC-3, and CBP/p300, possess histone acetyltransferase activity, which enhances transcriptional activation through the relaxation of chromatin structure (7, 8). In the absence of E2, AF2 interacts with repressor protein complexes that include NCoR and SMRT and histone deacetylases (HDACs) (9, 10) that promote chromatin condensation (11, 12). The exchange of coactivators and corepressors constitutes the basis of a sophisticated regulatory mechanism that fine-tunes ERα transactivation activity and allows this transcription factor to oscillate between the roles of activator and repressor of gene expression (13).
In contrast, the mechanism responsible for the E2-independent transcriptional activity of AF1 is not clearly understood. Molecular and functional studies have shown that phosphorylation of several serine residues in AF1, in particular serine 118, plays a key role in the cross-talk between the steroid and growth factor-dependent signal transduction pathways (14, 15). This process is thought to play an important function in the coordinated regulation of multiple genes by mitogenic stimuli in hormonally responsive normal tissues, and it has been associated with tumor development and resistance to endocrine therapy in breast cancer (16).
It has been proposed that the different functions of AF1 are mediated by a mechanism that involves its interaction with different coregulator proteins (17). However, only a small number of AF1-associated coregulators have been identified, including BTF3 (basal transcription factor 3), SRA1 (steroid receptor RNA activator), RNA-binding DEAD-box proteins p72/p68, CoCoA (coiled-coil coactivator), hMMS19 (human homologue of the yeast nucleotide excision repair gene MMS19), SPBP (stromelysin-1 platelet-derived growth factor-responsive element-binding protein), and Smad4 (18–24). The highly diverse nature of these cell factors suggests that the different AF1 functions may be mediated by a vast collection of coregulators that need to be identified in order to understand the contribution of this domain to ERα transactivation.
In this report, we used a yeast two-hybrid screen to identify novel AF1-associated coregulators of ERα. Our results identified a 326-amino acid protein, containing two zinc finger motifs, that had been previously identified as G0S24/ZFP36/TTP (hereafter TTP) (25, 26). Expression of TTP in MCF7 cells reduces ERα transactivation by interacting with its AF1 and DNA-binding domains. We demonstrate that TTP and ERα are recruited to the promoter region of the E2-responsive pS2 gene, suggesting that TTP functions as a bona fide nuclear receptor corepressor. We show further that TTP transcriptional activity is mediated through its interaction with histone deacetylases, in particular with HDAC1. Finally, we show that TTP interaction with ERα reduces proliferation of MCF7 cells and their ability to promote tumor formation in mice. We propose that TTP functions as a tumor suppressor through the down-regulation of ERα transactivation and suggest that its expression may be an important factor in tumor development in breast cancer.
EXPERIMENTAL PROCEDURES
Reagents and Antibodies
Estradiol (17β-estradiol), 4-hydroxytamoxifen, and Geneticin (G418) were from Sigma-Aldrich, and [35S]methionine was purchased from Promega. Human ERα antibody was purchased from Santa Cruz Biotechnology, Inc., and anti-FLAG antibody and TTP polyclonal antibody were from Sigma-Aldrich. Anti-HDAC1 and anti-SRC-1 antibodies were from Cell Signaling Technology, Inc. TTP knockdown assays were performed using TTP siRNA mixture and control siRNA from Santa Cruz Biotechnology. Lipofectamine 2000 was purchased from Invitrogen.
Plasmids
pcDNA3.1-ERα and ERE-Tk-LUC vectors were kindly provided by Dr. W. Lee Kraus (Cornell University), and pcDNA-SRC-1 and pcDNA-SRC-3 were a gift of Dr. R. Kurokawa (Saitama Medical University). Human full-length TTP mRNA (GenBankTM accession no. NM_003407.3) was amplified by RT-PCR and cloned into the mammalian expression vector pcDNA3.1 (Invitrogen), and FLAG-tagged proteins were expressed using the mammalian expression vector pCMV-3Tag-1A (Agilent Technologies, Santa Clara, CA). Glutathione S-transferase (GST)-TTP full-length and deletion constructs were generated by subcloning into GST pGEX-4T-1 (Amersham Biosciences). The sequences of all constructs were verified by DNA sequencing at LARAGEN Inc. (Culver City, CA). The 5XUAS-Tk-LUC reporter construct and PM vector used to express TTP and HDAC1 as fusion proteins with the heterologous DNA-binding domain of GAL4 were a gift from Dr. Xiang-Jiao Yang (McGill University). FLAG-tagged HDAC1, HDAC2, HDAC3, and HDAC7 in the mammalian expression vector pCMXFLAG were kindly provided by Ron Evans (University of California, San Diego).
Yeast Two-hybrid Screening
A yeast two-hybrid screen was performed using the matchmaker two-hybrid system kit (Clontech). Briefly, a cDNA fragment encoding the AF1 domain (amino acids 1–180) of ERα was subcloned into the pAS2.1 vector. A human mammary gland cDNA library in pACT2 plasmid was screened with bait construct pAS2.1/AF1 using sequential polyethylene glycol/lithium acetate transformation, according to the manufacturer's instructions.
Y190 yeast cells harboring pAS2–1/AF1 and transformed with the cDNA library were plated on medium lacking tryptophan, leucine, and histidine (SD/−Leu −Trp −His) containing 25 mm 3-amino-1,2,4-triazole and incubated for 2–4 days at 30 °C. The resulting colonies were assayed for β-galactosidase activity. The positive AD plasmids were transformed into Escherichia coli DH5α cells for DNA sequencing and identification using BLAST analysis.
Immunofluorescence and Confocal Microscopy Studies
The cellular location of ERα and TTP was determined by indirect immunofluorescence. Briefly, MCF7 cells were grown on glass coverslips and fixed with freshly prepared 3% paraformaldehyde solution. The cells were incubated first with primary antibodies and then with secondary antibodies conjugated with Alexa- 546 (red) and Alexa-488 (green; both from Molecular Probes, Inc., Eugene, OR). Prolong-Gold Antifade reagent with DAPI (blue; Invitrogen) was used to counterstain the DNA. Confocal scanning analysis was done using an Olympus BX51 W1 confocal microscope. Each slide was examined for each stain at three excitation wavelengths (488, 546, and 633 nm).
Cell Culture and Transfection Assays
HepG2, CV-1, MCF7, and ZR75-1 cells were obtained from the American Type Culture Collection (Manassas, VA) and maintained in α-minimum Eagle's medium supplemented with 5% FBS, 100 units/ml penicillin, and 100 μg/ml streptomycin in a humidified atmosphere containing 5% CO2 at 37 °C. Cells were seeded into tissue culture dishes containing phenol red-free DMEM supplemented with 5% charcoal/dextran-treated FBS and cultured for 36–40 h before all experimental treatments with hormone. Cells were transfected using the calcium phosphate-DNA coprecipitation method, which typically included 2 μg of ERE-Tk-LUC reporter, 0.1 μg of pCMVβGal (transfection control), 1 μg of pcDNA3.1-ERα, and 0.25–1.0 μg of pcDNA3.1-TTP or other test vector. After 6 h, the cells were washed twice with phosphate-buffered saline and treated with either 100 nm E2 or carrier (ethanol) for 48 h in phenol red-free DMEM supplemented with 5% stripped FBS. Cells were then washed and harvested in potassium phosphate lysis buffer containing 1% Triton X-100. Luciferase and β-galactosidase activities were measured using a monolight 3010 luminometer (Pharmingen). Cell lines stably overexpressing TTP were generated by transfecting MCF7 cells with pCMV-3Tag-TTP using Lipofectamine and, after 48 h, selected in medium containing G418 (500 μg/ml). For TTP knockdown assays, siRNA-specific mixture and siRNA control duplexes were purchased from Santa Cruz Biotechnology and transfected using Lipofectamine. Reduction in TTP expression was determined by Western blot using anti-TTP antibody.
Immunoprecipitation and Western Blot
MCF7 or MCF7/TTP cells were lysed with TNTE buffer (50 mm Tris-HCl, pH 7.4, 150 mm NaCl, 5 mm EDTA, 0.5% Triton X-100 plus a mixture of protease and phosphatase inhibitors). Proteins were immunoprecipitated with mouse monoclonal anti-ERα, anti-TTP, or anti-FLAG antibodies. Immunoprecipitated proteins were separated by SDS-PAGE, and Western blot analysis was performed using specific primary antibodies anti-TTP, anti-HDAC1, or anti-ERα and anti-rabbit secondary HRP-conjugated antibody (Pierce). Proteins were visualized using an enhanced chemiluminescence assay (SuperSignal West Pico Chemiluminescent Substrate, Thermo Scientific).
GST Pull-down Assay
In vitro transcription and translation of the TTP and ERα proteins were done using the TNT transcription/translation system (Promega) in the presence of [35S]methionine. The GST pull-down assays were done by incubating equal amounts of GST and GST-TTP on GST beads (Amersham Biosciences) with in vitro-translated recombinant protein ERα domains. Bound proteins were isolated by incubating the mixture for 3 h at 4 °C and then washing five times with Nonidet P-40 lysis buffer (20 mmol/liter Hepes, pH 7.9, 100 mmol/liter NaCl, 1 mmol/liter EDTA, pH 8.0, 4 mmol/liter MgCl2, 1 mmol/liter DTT, 0.02% Nonidet P-40, 10% glycerol, and 0.5 mmol/liter PMSF) and sonicated. The proteins were eluted with a 2× Laemmli sample buffer, separated by SDS-PAGE, and visualized by autoradiography or immunoblot.
Chromatin Immunoprecipitation Assay
Chromatin immunoprecipitation (ChIP) assays were done as described previously (27). Equal amounts (2 mg) of protein-chromatin complexes were used for each sample. Before immunoprecipitation, 10% of each chromatin solution was set aside for use with input DNA. Chromatin immunoprecipitation was carried out at 4 °C overnight with 2 μg of specific antibody. PCR analysis was done with primers for the pS2 gene promoter region (−355 to −192) or 3 kb upstream of the pS2 promoter to serve as a negative control region (−3947 to − 3639). PCR was performed for 26 cycles, and the resulting PCR products were resolved on a 2% agarose gel and visualized with ethidium bromide. The sequences of the pS2 promoter primers were 5′-CCGGCCATCTCTCACTATGAA-3′ and 5′-AGATCCCTCAGCCAAGATGACC-3′. For the control pS2 upstream region, the primers used were 5′-AGCTGGGTGTCCTTGTAAAG-3′ (sense) and 5′-GATCCACTTCCTCCCAAAC-3′ (antisense).
Proliferation Assay
MCF7 and MCF7/TTP cells (1.5 × 10⁵ cells) were plated on 6-well plates and incubated in serum-free medium for 24 h to induce cell cycle synchronization. After this period, the cells were washed and incubated in E2-supplemented medium for 0, 24, 48, and 72 h. Cells were trypsinized, washed twice with PBS, and resuspended in normal medium. Trypan blue was added to the cultures to a final 1:10 dilution, and after 5 min, the cells were counted using a Neubauer chamber.
Mouse Xenotransplantation Experiments
A group of six nude mice (age 5–6 weeks) (Instituto Nacional de Nutricion y Ciencias Medicas) were subcutaneously injected with 3 × 10⁶ control MCF7 cells or with 3 × 10⁶ MCF7/TTP cells in 50% Matrigel into the left or right flanks of the animals, respectively. All animal were subdermally stimulated with estradiol (50 μg/week) for the duration of the experiment (28). After 7 weeks, the animals were sacrificed, and the tumors were extracted to be measured and weighed. All animal procedures were done in compliance with the Canadian Council on Animal Care and the guidelines for the ethical treatment of laboratory animals of the Instituto de Investigaciones Biomedicas, Universidad Nacional Autónoma de México.
Statistical Analysis
Each transfection and chromatin immunoprecipitation assay was performed by triplicate in three different experiments using different cell cultures and chromatin preparations, respectively. Data are presented as mean ± S.E. Statistical significance was analyzed at 0.05 levels of significance using Student's t test.
RESULTS
Identification of TTP as an AF1-associated Protein
In order to identify new ERα coregulators that recognize its AF1 domain we used the N-terminal region of ERα (amino acids 1–180) as bait in a yeast two-hybrid screen of 5 × 10⁶ independent clones of a human mammary gland cDNA library. Three of the isolated cDNA clones encode a 326-amino acid protein containing two zinc finger motifs and several proline-rich regions. Sequence analysis using the BLAST program of the National Center for Biotechnology Information showed that the candidate protein had been previously described as tristetraproline (TTP), G0/G1 switch regulatory protein 24 (G0S24), and zinc finger protein 36 (ZFP36).
TTP Colocalizes in the Cell Nucleus with Estrogen Receptor α
Immunostaining of E2-stimulated MCF7 breast cancer cells with anti-ERα antibody (green) showed ERα predominantly localized in the cell nucleus (Fig. 1A, ii). Incubation of MCF7 cells with anti-TTP antibody (Fig. 1A, iii) demonstrated that although TTP is present in the cytoplasm and in the nucleus (red), it is more abundant in the cell nucleus, where it colocalizes (yellow) with ERα (Fig. 1A, iv).
FIGURE 1.
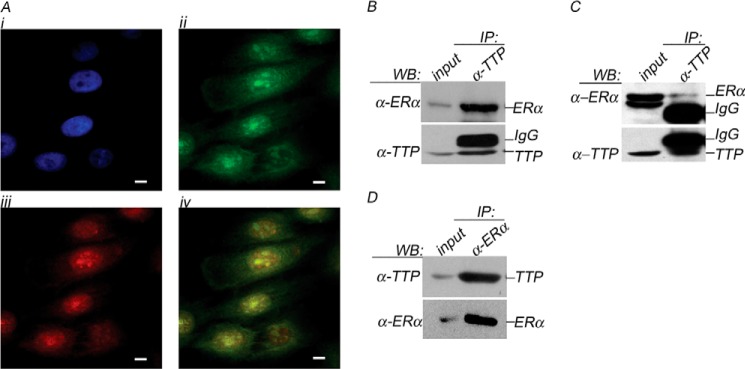
TTP is an ERα-associated protein. A, subcellular localization of TTP and ERα. MCF7 cell nuclear DNA was visualized with DAPI (blue, panel i). ERα (green, panel ii) and TTP (red, panel iii) were visualized using specific antibodies as described under “Experimental Procedures.” Cellular colocalization is shown by merging TTP and ERα images (yellow, panel iv). TTP interacts with ERα in vivo. Endogenous TTP (IP: α-TTP panel) or endogenous ERα (IP: α-ERα panel) were immunoprecipitated from protein extracts prepared from MCF7 (B and D) or ZR75-1 (C) cells using anti-TTP or anti-ERα antibodies, respectively. Immunoprecipitated proteins were resolved by PAGE, and the binding of ERα or TTP was visualized by Western blot. The input lane represents 10% of the protein extract used in the coimmunoprecipitation assays. IP, immunoprecipitation; WB, Western blot.
TTP Interacts with ERα
The potential interaction between TTP and ERα in vivo was examined by coimmunoprecipitation assays in ERα +ve MCF7 and ZR75-1 cells. Endogenous TTP protein present in MCF7 or ZR75-1 protein extracts was immunoprecipitated with anti-TTP antibody. The interaction with ERα was evaluated by immunoblotting using anti-ERα antibody. Our results showed that TTP is associated with ERα in MCF7 and ZR75-1 cells in vivo (Fig. 1, B and C, IP: α-TTP). The interaction between TTP and ERα was confirmed by a reciprocal coimmunoprecipitation assay in which protein extracts from MCF7 cells were immunoprecipitated with anti-ERα antibody, and the presence of TTP was visualized by Western blot using anti-TTP antibody (Fig. 1D, IP: α-ERα). As a control, 10% of the protein extracts used in each immunoprecipitation assay were analyzed by Western blot using anti-TTP or anti-ERα to confirm the presence of the proteins (Fig. 1, B–D, Input lanes).
To determine the protein domains involved in TTP and ERα interaction, we performed GST pull-down assays to evaluate the ability of [35S]methionine-labeled ERα to interact with full-length TTP or TTP truncated mutant proteins containing amino acids 1–189 (NtZn), amino acids 1–74 (NtΔZn), amino acids 74–326 (ZnCt), amino acids 189–326 (ΔZnCt), and amino acids 74–189 (Zn) (Fig. 2A, top). The results showed that ERα interacts with full-length TTP and with the TTP mutant fragments ZnCt, NtZn, and Zn, but the interaction with full-length TTP and the C-terminal fragment ZnCt, containing the two zinc finger domains, was much stronger than with the other TTP fragments (Fig. 2B, ERα fl panel). In contrast, the TTP fragments NtΔZn and ΔZnCt, in which the two zinc finger domains were eliminated, failed to interact with ERα (Fig. 2B, ERα fl panel). These results suggest that the zinc finger domains in TTP mediate its interaction with ERα. Binding was absent with GST alone, suggesting that the interaction between TTP and ERα is specific (Fig. 2B, GST lane). To identify the region of ERα that interacts with TTP, GST fusions were made with its N-terminal fragment (amino acids 1–305, AF1/DBD) and C-terminal fragment (amino acids 185–595, DBD/AF2) and with the DNA-binding domain (amino acids 180–302, DBD) (Fig. 2A, bottom). The [35S]methionine-ERα fragments were evaluated by their ability to interact with the GST-TTP fragments (Fig. 2B). The experiment revealed the both AF1/DBD and DBD/AF2 interacted with the zinc finger containing C-terminal fragment of TTP (ZnCt), but the interaction between AF1/DBD and ZnCt was much stronger (Fig. 2B, AF1/DBD and DBD/AF2 panels). When we tested the ERα DBD region alone, it showed a strong interaction with all GST-TTP proteins containing the zinc finger motifs (TTP fl, NtZn, ZnCt, and Zn) and failed to interact with the N-terminal and C-terminal TTP fragments in which the zinc finger domains were absent (NtΔZn and ΔZnCt) (Fig. 2B, DBD panel). These results indicate that the TTP binding to ERα is mediated through interaction between the N-terminal AF1/DBD domain of the receptor and the zinc finger domain of TTP. Interestingly, even when TTP was isolated using the AF1 domain of ERα (amino acids 1–180), TTP shows a stronger interaction with the DBD region of the receptor (amino acids 180–302). Expression and purity of GST-TTP proteins and of [35S]methionine-labeled ERα proteins were evaluated by PAGE and visualized by Coomassie staining or autoradiography analysis, respectively (Fig. 2, C and D).
FIGURE 2.

TTP interacts predominantly with the AF1 and DBD domains of ERα. A, a schematic representation of full-length TTP and TTP mutant fragments expressed as GST fusion proteins used in pull-down assays is shown in the top panel. The bottom image shows a schematic representation of the [35S]methionine-labeled full-length ERα and ERα fragments used in the pull-down assays. B, [35S]methionine-labeled ERα proteins resolved by PAGE following capture by full-length GST-TTP, GST-TTP protein fragments, or GST control. Input, 10% of the labeled ERα used in the assay. C, expression and purity of GST-TTP proteins were evaluated by PAGE and visualized by Coomassie staining. D, the expression and integrity of transcription/translated [35S]methionine-labeled ERα proteins was evaluated by PAGE followed by autoradiography. A thin black line in B and D indicates where lanes were spliced together because samples were run noncontiguously in gels.
TTP Exhibits Intrinsic Transcriptional Activity
To test whether TTP possesses transcriptional activity, it was expressed as a fusion protein with the heterologous DNA-binding domain of the yeast transcription factor GAL4 (GAL4-TTP). GAL4-TTP was cotransfected into MCF7 cells with the vector 5XUAS-Tk-LUC containing the luciferase reporter gene under the control of the constitutive Tk promoter, which is located downstream of five GAL4-responsive element repeats (upstream activating sequence; UAS) (Fig. 3A, top). The luciferase activity of GAL4-TTP-expressing cells was compared with the activity observed in control MCF7 cells transfected with the pMGal4-DBD construct expressing the GAL4-DNA-binding domain alone (GAL4) (Fig. 3, bottom). Our results showed that the presence of GAL4-TTP in MCF7 cells repressed transcription of the luciferase reporter gene by about 80% with respect to the control GAL4 (Fig. 3, GAL4-TTP). As a control, we transfected MCF7 cells with a GAL4 construct of histone deacetylase 1 (GAL4-HDAC1) as a reference transcriptional corepressor factor. GAL4-HDAC1 reduced luciferase transcription by 87% (Fig. 3, GAL4-HDAC1), suggesting that both TTP and HDAC1 have similar transcriptional repressor activities when expressed as GAL4 fusion proteins.
FIGURE 3.
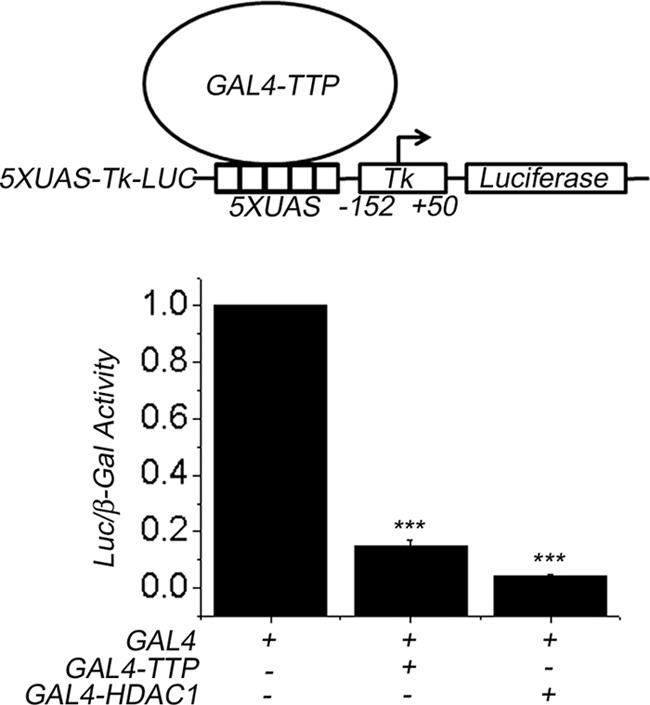
TTP exhibits intrinsic transcriptional activity. TTP transcriptional activity was assayed using the heterologous GAL4-UAS transcription system. MCF7 cells were transfected with Gal4-TTP, Gal4-HDAC1, or the DNA-binding domain of GAL4 alone (GAL4), as the control, and a luciferase reporter containing a promoter with five UAS elements in tandem (5XUAS-Tk-LUC, top). Luciferase activity, from three experiments assayed in triplicate, was normalized with respect to cells expressing GAL4-DBD and is represented as mean ± S.E. (error bars) (bottom). The differences in luciferase activity between MCF7 cells transfected with control GAL4 and MCF7 cells transfected with GAL4-TTP or GAL4-HDAC1 were shown to be statistically significant (p < 0.05).
TTP Represses ERα Transcriptional Activity
To explore the effect of TTP on ERα transactivation, we performed transient transfection assays in ERα −ve CV-1 cells and in ERα-expressing HepG2, MCF7, and ZR75-1 cells. In these experiments, pcDNA3.1-TTP was the source of TTP, and the vector ERE-Tk-LUC was used as the indicator of ERα transcriptional activity. CV-1 cells were also transfected with pcDNA3.1-ERα. All three cell lines showed baseline luciferase activity that increased upon E2 stimulation (Fig. 4, A–D). TTP overexpression in the four cell lines produced a dose-dependent repression of ERα transactivation activity. Transfection with 250 or 500 ng of pcDNA3.1-TTP in the presence of E2 reduced the transcriptional activity of exogenous ERα by 55 and 70% in CV-1 cells (Fig. 4A). The same treatment reduced E2-stimulated ERα activity by 55 and 60% in HepG2 cells (Fig. 4B), 25 and 75% in MCF7 cells (Fig. 4C), and 75 and 80% in ZR75-1 cells (Fig. 4D). In the absence of E2, TTP also reduced the basal ERα activity at least by 50%. These results suggest that TTP acts as a transcriptional corepressor of ERα.
FIGURE 4.

TTP overexpression represses ERα transactivation. Four cell lines, CV-1 (A), HepG2 (B), MCF7 (C), and ZR75-1 (D), were transiently transfected with empty pcDNA vector (−) or with different concentrations (0.25 or 0.5 μg) of pCMV-3TAG-TTP (FLAG-TTP) along with ERE-Tk-LUC reporter vector. CV-1 cells were also cotransfected with ERα. The effect on ERα transactivation was determined by assay of luciferase activity, as described under “Experimental Procedures.” Assays were performed in triplicate in three independent experiments in the presence (white bars) or absence (black bars) of E2, and the results are represented as mean ± S.E. Differences in ERα activity between control MCF7 cells and TTP-expressing MCF7 cells are statistically significant (p < 0.05). D, siRNA-mediated knockdown of TTP protein levels in MCF7 cells. MCF7 cells were transfected with two different concentrations of a specific siRNA-TTP (1.25 or 2.5 μg) or with an unrelated control siRNA (2.5 μg). Protein extracts from MCF7 cultures were resolved by PAGE, and expression levels of TTP, ERα, and GAPDH, as a loading control protein, were evaluated by Western blot using specific antibodies as described under “Experimental Procedures.” E and F, TTP knockdown derepresses ERα transactivation. MCF-7 cells were cotransfected with TTP in the presence (+) or absence (−) of specific siRNA-TTP (1.5 μg), along with ERE-TK-LUC, in the presence of E2. F, the effect of TTP or TTP + siRNA-TTP on ERα transactivation was determined by a luciferase assay and compared with luciferase activity in MCF7 cells transfected with empty pcDNA3.1 vector and ERE-Tk-LUC. Results, in triplicate in three independent experiments, are represented as mean ± S.E. (error bars). Differences in ERα activity in MCF7 cells transfected with TTP or with TTP + siRNA-TTP were shown to be statistically significant (p < 0.05).
To assess the specificity of TTP-mediated transcriptional repression we evaluated the effect of a specific siRNA-TTP or a control siRNA in the TTP-mediated repression of ERα transactivation in MCF7 cells. First, we evaluated the impact of siRNA-TTP or the control siRNA on the protein levels of TTP, ERα, and GAPDH in MCF7 cells by Western blot (Fig. 4E). Transfection of two different concentrations of siRNA-TTP (1.25 and 2.5 μg) into MCF7 cells produced a significant reduction in the endogenous TTP protein levels in MCF7 cells but had no effect on ERα protein levels (Fig. 4E, TTP and ERα panels). In contrast, transfection of control siRNA did not affect TTP protein levels, suggesting that the effect of siRNA-TTP was specific. GAPDH protein levels were determined in all protein extracts from MCF7 cells and used as a protein loading control (Fig. 4E, GAPDH panel). Next, we evaluated the effect of siRNA-TTP on the TTP-mediated repression of ERα transactivation. MCF7 cells transfected with TTP showed a 70% reduction in ERα transactivation compared with control untransfected MCF7 cells (Fig. 4F, TTP). However, MCF7 cells cotransfected with TTP and siRNA-TTP exhibited a derepression of ERα transactivation (Fig. 4F, TTP + siRNA-TTP). These results indicate that TTP-mediated repression of ERα transactivation is specific and suggest the possibility that changes in TTP expression levels could have a significant impact on the ERα activity in MCF7 cells.
TTP Impairs the Activity of Steroid Receptor Coactivator 1
To explore the mechanism responsible for TTP function as ERα corepressor, we studied its effect on the activity of AF2-associated coactivators using SRC-1 (steroid receptor coactivator 1) as an experimental model. Control MCF7 cells were transfected with empty pcDNA3.1 vector, and ERα activity was determined after the cells were incubated in hormone-depleted or E2-supplemented medium. Estradiol stimulation of control MCF7 cells increased the ERα activity 3-fold compared with non-stimulated cells (Fig. 5A). Transfection of SRC-1 increased both the basal and E2-dependent ERα activity by 3.5- and 15-fold, respectively (Fig. 5A, SRC-1). In contrast, the presence of 0.25, 0.5, and 1.0 μg of pcDNA-TTP reduced the SRC-1 effect on ERα transactivation by 65, 85, and 90%, respectively (Fig. 5A, TTP). Next, to test the reversibility of the TTP corepressor effect on ERα, we evaluated whether increasing SRC-1 concentrations were able to release ERα from TTP repression (Fig. 5B). MCF7 cells were transfected with pcDNA-TTP and increasing concentrations of pcDNA-SRC1 (Fig. 5B). Our results showed that MCF7 cells transfected with TTP and 0.25, 0.5, or 1.0 μg of pcDNA-SRC-1 exhibited an increase in ERα activity with respect to MCF7 cells transfected with TTP alone of about 100, 130, and 300%, respectively (Fig. 5B). To determine the specificity of the TTP-mediated attenuation of SRC-1 coactivator activity, we studied the effect of TTP on ERα transactivation in MCF7 cells transfected with SRC-1 or SRC-3, another member of the p160 family of steroid receptor coactivators with histone acetyltransferase activity (Fig. 5C). Our results showed that transfection of SRC-1 and SRC-3 in MCF7 cells increased E2-dependent ERα transactivation by 4- and 7-fold, respectively (Fig. 5C). In contrast, MCF7 cells that were transfected with SRC-1 or SRC-3 in the presence of TTP exhibited a reduction in ERα activity with respect to MCF7 cells transfected with SRC-1 or SRC-3 alone of about 75 and 90%, respectively (Fig. 5C).
FIGURE 5.
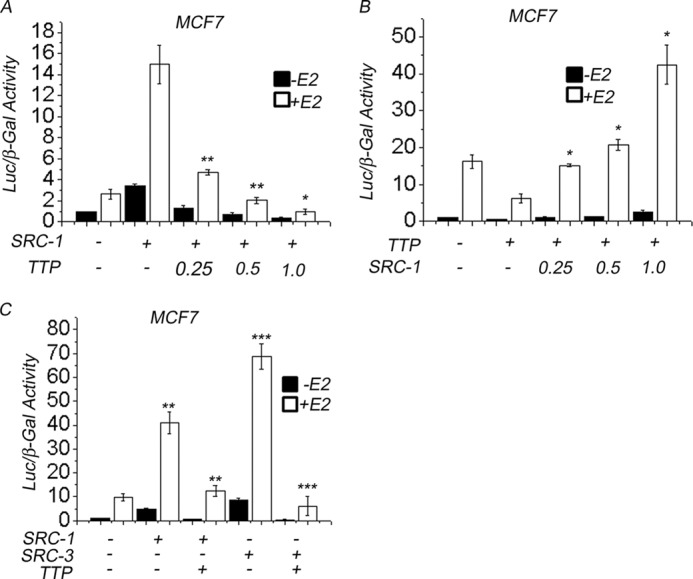
TTP impairs the activity of SRC-1 on ERα transactivation. A, MCF7 cells were transfected with pcDNA-SRC-1 or pcDNA-SRC-3 vector in the absence or presence of pCDNA3.1-TTP vector. ERα activity was determined by a luciferase assay using the ERE-Tk-LUC reporter and compared with control MCF7 cells transfected with ERE-Tk-LUC alone. The cells were grown in the absence (black bars) or presence (white bars) of E2 for 48 h. B, MCF7 cells were transfected with pcDNA-SRC-1 vector in the absence or presence of different concentrations of pCDNA3.1-TTP vector. ERα activity was determined by a luciferase assay using the ERE-Tk-LUC reporter and compared with control MCF7 cells transfected with ERE-Tk-LUC alone. The cells were grown in the absence (black bars) or presence (white bars) of E2 for 48 h. C, MCF7 cells were transfected with pcDNA-TTP vector in the absence or presence of different concentrations of pCDNA3.1-SRC-1 vector. ERα activity was compared with control MCF7 cells transfected with ERE-Tk-LUC alone. The cells were grown in the absence (black bars) or presence (white bars) of E2 for 40 h. Results were expressed as mean relative luciferase activity ± S.E. (error bars). Differences between treatments were shown to be statistically significant (p < 0.05).
TTP Corepressor Function Requires the Enzymatic Activity of Histone Deacetylases
To facilitate the characterization of the mechanism responsible for TTP transcriptional repressor activity, we generated MCF7 cells that stably overexpress TTP (MCF7/TTP). MCF7 cells were transfected with a pCMV-3TAG-TTP construct that directed the expression of TTP containing three FLAG epitopes at its amino terminus (FLAG-TTP). MCF7/TTP cells were characterized using three different experimental analysis. First, expression of FLAG-TTP in protein extracts from MCF/TTP cells was confirmed by Western blot using an anti-FLAG antibody. FLAG-TTP appears as a robust protein band that is not present in control MCF7 cells (Fig. 6A, TTP panel). Protein extracts from control MCF7 and MCF7/TTP cells were also analyzed by Western blot, using anti-ERα antibody to determine ERα expression levels. This experiment showed that TTP overexpression in MCF7/TTP cells did not affect ERα protein levels (Fig. 6A, ERα panel). Second, we explored whether FLAG-TTP interacts with ERα in MCF7/TTP cells in vivo by coimmunoprecipitation assays. FLAG-TTP was immunoprecipitated with anti-FLAG antibody from protein extracts prepared from MCF7/TTP cells incubated in hormone free medium (E2−) or in the presence of estradiol (E2+). The binding of ERα was evaluated by Western blot using anti-ERα antibody (Fig. 6B, ERα panels). Our results showed that although FLAG-TTP binds to ERα in MCF7/TTP cells grown in hormone-free medium, the presence of E2 reduced the interaction between these proteins (Fig. 6B, IP: α-FLAG panel). As a control, 10% of the protein extracts used in each immunoprecipitation assay were analyzed by Western blot using anti-TTP or anti-ERα to confirm that the concentration of these proteins was similar in the protein extracts analyzed (Fig. 6B, Input panels). Finally, determination of ERα activity in MCF7/TTP cells revealed that TTP overexpression reduced both the basal and E2-dependent ERα transactivation compared with control untransfected MCF7 cells (Fig. 6C). In the presence of E2, MCF7/TTP cells exhibited a 8.2-fold reduction in ERα activity compared with E2-stimulated control MCF7 cells (Fig. 6C). All of these results combined suggest that interaction of FLAG-TTP with endogenous ERα in MCF7/TTP cells in vivo represses ERα transactivation without affecting ERα protein levels.
FIGURE 6.
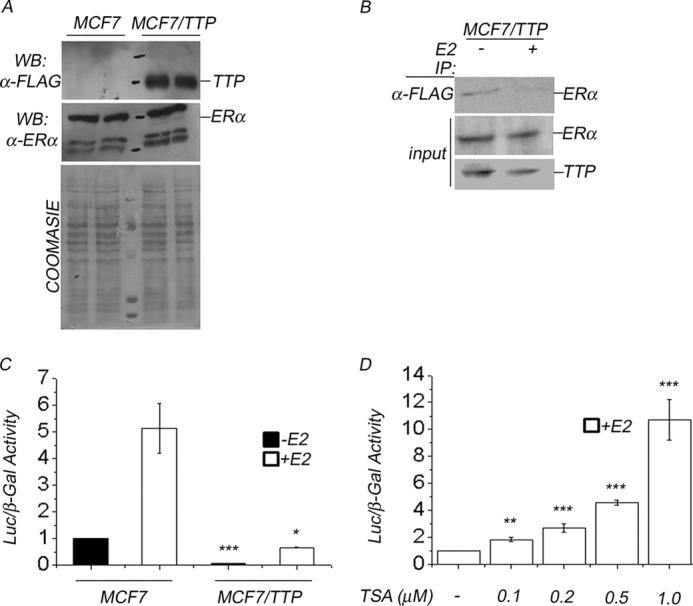
TTP-mediated repression of ERα requires histone deacetylase activity. A, MCF7 cells were transfected with pCMV-3TAG-TTP vector and selected with Geneticin to obtain stable expression of FLAG-TTP (MCF7/TTP cells) as described under “Experimental Procedures.” TTP expression in MCF7/TTP or control MCF7 cells was evaluated by Western blot using anti-FLAG antibody (WB: α-FLAG panel). ERα expression in control MCF7 and TTP-expressing MCF7/TTP cells was also determined using a specific ERα antibody (WB: α-ERα panel). The protein gels were stained with Coomassie Blue as a protein loading control. B, FLAG-TTP interacts with endogenous ERα in MCF7/TTP cells in vivo. FLAG-TTP was immunoprecipitated from protein extracts prepared from MCF7/TTP cells incubated in the absence (−) or presence (+) of E2. The binding to ERα was evaluated by Western blot using anti-ERα antibody as described under “Experimental Procedures” (IP: α-FLAG panel). 10% of the protein extracts used in the coimmunoprecipitation assays were analyzed by Western blot using anti-FLAG or anti-ERα antibodies (Input panel). C, stably FLAG-TTP overexpression represses ERα transactivation. ERα transactivation was determined in control MCF7 cells or in MCF7/TTP cells, as described under “Experimental Procedures.” Assays were performed in triplicate in three independent experiments in the presence (white bars) or absence (black bars) of E2, and the results are represented as mean ± S.E. (error bars). Differences in ERα activity between control MCF7 and MCF7/TTP cells are statistically significant (p < 0.05). D, treatment of MCF7/TTP cells with different concentrations of TSA derepresses ERα transactivation in a dose-dependent manner in the presence of E2. Results, in triplicate in three independent experiments, are represented as mean ± S.E. Differences in ERα activity in untreated MCF7/TTP cells and TSA-treated MCF7/TTP cells were shown to be statistically significant (p < 0.05).
Next, using MCF7/TTP cells, we explored whether TTP function as a repressor of ERα is mediated by the enzymatic activity of histone deacetylases. We compared the ERα activity of E2-stimulated MCF7/TTP cells in normal medium or in the presence of trichostatin A (TSA), a specific inhibitor of class I and class II histone deacetylases. Treatment of MCF7/TTP cells with 0.1, 0.2, 0.5, and 1.0 μm TSA produced a 2-, 2.5-, 4.5-, and 10.5-fold increase in ERα transactivation compared with untreated MCF7/TTP cells (Fig. 6D). These results suggest that TTP corepressor activity requires the enzymatic activity of histone deacetylases.
TTP Interacts with Histone Deacetylases in Vitro and in Vivo
The potential interaction between TTP and HDACs was examined by GST pull-down assays in which we evaluated the ability of full-length TTP to interact with [35S]methionine-labeled class I and II HDACs whose activities are known to be inhibited by trichostatin A. Our results showed that TTP interacts with HDAC1, HDAC2, HDAC3, and HDAC7 but failed to interact with HDAC8 (Fig. 7A). HDAC binding was absent when they were incubated with GST alone, suggesting that the interaction between TTP and HDACs is specific (Fig. 7A, GST lane). The interaction between TTP and HDACs in intact cells was confirmed by immunoprecipitation and Western blot analysis using HDAC1 as an experimental model (Fig. 7B). Nuclear protein extracts were prepared from MCF7/TTP cells grown in control hormone-free medium (EtOH) or in medium supplemented with E2 or tamoxifen. FLAG-TTP present in the protein extracts was immunoprecipitated with anti-FLAG antibody, and the binding of endogenous HDAC1 was revealed by immunoblotting with a monoclonal anti-HDAC1 antibody (Fig. 7B, IP: α-FLAG panel). As shown in Fig. 7B, TTP interacts with HDAC1 in the absence of hormone, but the presence of E2 inhibited the interaction between these proteins (Fig. 7B, EtOH and E2). However, treatment of MCF7/TTP cells with the ERα antagonist tamoxifen produced an enhancement in the interaction between TTP and HDAC1 (Fig. 7B, Tam). As a control, 10% of the protein extracts used in each immunoprecipitation assay were analyzed by Western blot using anti-FLAG or anti-HDAC1 antibodies to confirm that FLAG-TTP and HDAC1 were present in similar concentrations in the cell extracts (Fig. 7B, Input panels).
FIGURE 7.
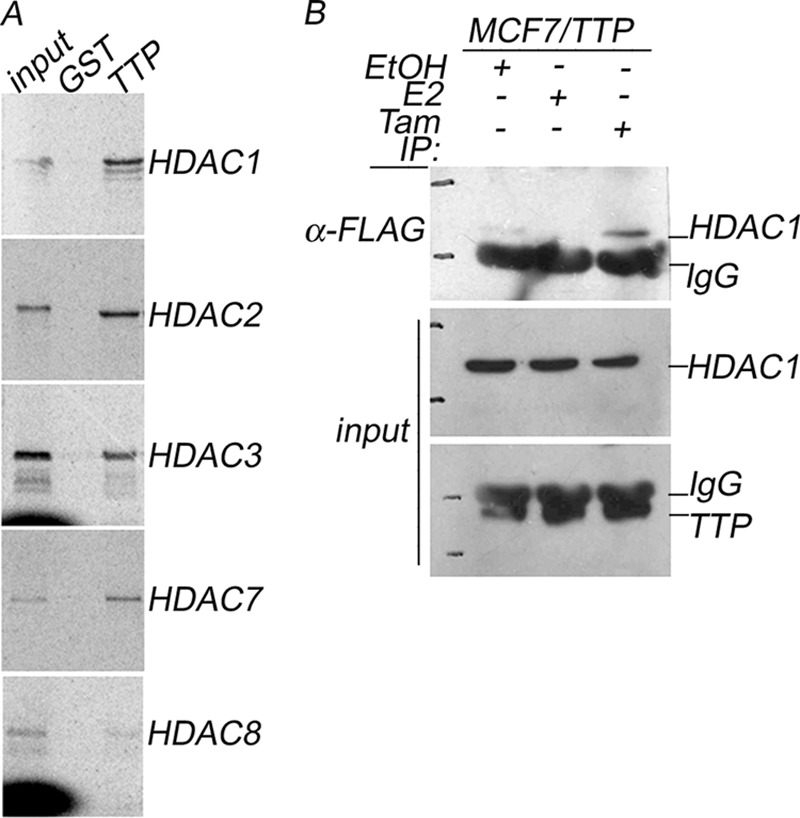
TTP interacts in vitro and in vivo with histone deacetylases. A, GST pull-down assay. In vitro transcription and translation of HDAC1, HDAC2, HDAC3, HDAC7, and HDAC8 proteins were done in the presence of [35S]methionine. The GST pull-down assays were done by incubating equal amounts of GST or GST-TTP immobilized on GST beads with HDACs. The proteins were eluted with a 2× Laemmli sample buffer, separated by SDS-PAGE, and visualized by autoradiography. B, coimmunoprecipitation assay. FLAG-TTP was immunoprecipitated from protein extracts prepared from MCF7/TTP cells incubated in hormone-depleted medium (EtOH) or in the presence of E2 or tamoxifen (Tam). The binding of endogenous HDAC1 was evaluated by Western blot using anti-HDAC1 antibody (IP: α-FLAG panel). Input panels represent 10% of the protein extracts used in the coimmunoprecipitation assays analyzed by Western blot using anti-HDAC1 or anti-FLAG antibodies.
TTP Is Recruited to the Promoter of the Estradiol-dependent pS2 Gene in MCF7 Cells
We performed ChIP to detect whether TTP is recruited to estrogen response elements (ERE) at the core promoter of the pS2 gene in MCF7/TTP cells in the presence or absence of E2 (Fig. 8A). After ChIP analysis using anti-ERα antibody to enrich for target sequences, a fragment of 163 bp (ERE, −355 to −192) of the pS2 promoter could be amplified by PCR from MCF7/TTP cells with or without E2 stimulation (Fig. 8A, IP: α-ERα panel). However, the PCR product was slightly more abundant in MCF7/TTP cells stimulated with E2. ChIP analysis of MCF7/TTP cells using an anti-FLAG antibody showed that FLAG-TTP was also recruited to the pS2 promoter (Fig. 8A, IP: α-FLAG panel). The specificity of ERα and FLAG-TTP binding to the pS2 promoter was confirmed when a pair of primers complementary to a DNA region localized upstream of the ERE (control −3947 to −3639) failed to produce a PCR product after chromatin immunoprecipitation using either anti-FLAG or anti-ERα antibodies (Fig. 8A, control region). As a negative control, ChIP analysis was performed using anti-β-actin antibody, which failed to produce PCR fragments for either ERE or control DNA regions (Fig. 8A, IP: α-β-Actin panel). Based on our results showing that TTP transfection in MCF7 cells attenuates SRC-1 coactivator activity, we next explored whether TTP affects the recruitment of ERα and SRC-1 to the promoter of E2-responsive genes. We performed ChIP assays in E2-stimulated MCF7 cells transiently transfected with pCMV-3TAG-TTP or empty pCMV-3TAG vector. The experiments were carried out using anti-FLAG, anti-ERα, or anti-SRC-1 antibodies (Fig. 8B). As expected, ERα and SRC-1 were found to be present in the pS2 promoter region in control E2-stimulated MCF7 cells (Fig. 8B, MCF7 cells). Our results showed that the ERα recruitment to the pS2 promoter was not affected by FLAG-TTP. In contrast, the presence of FLAG-TTP reduced SRC-1 recruitment to the pS2 promoter (Fig. 8B).
FIGURE 8.

Localization of TTP and ERα at the core promoter of the pS2 gene. A, chromatin from FLAG-TTP stably transfected MCF7/TTP cells was immunoprecipitated using anti-FLAG antibody (IP: α-FLAG panel), anti-ERα antibody (IP: α-ERα panel), or anti-β-actin antibody as a negative control. 10% of the chromatin material used in ChIP assays served as a PCR positive control (Input panel). PCR amplification of the ∼163-bp core promoter of pS2 (ERE, −355 to −192) or to a region 4 kb upstream of the pS2 promoter (Control, −3947 to −3639) was carried out, and DNA products were separated by gel electrophoresis and photographed under UV light. The ChIP assays were performed in MCF7/TTP cells treated with E2 for 45 min before cross-linking. B, FLAG-TTP overexpression affects the recruitment of SRC-1 to pS2 promoter. MCF7 cells were transiently transfected with (+) or without (−) FLAG-TTP and treated with E2 for 45 min. Chromatin immunoprecipitation assays were performed using anti-FLAG, anti-ERα, or anti-SRC-1 or without antibody (mock). PCR amplifications were done with primers spanning the ERE region from the endogenous pS2 (163 bp). C and D, TTP reduces pS2 mRNA levels. Control MCF7 and ZR75-1 cells were transfected with or without FLAG-TTP and were stimulated with or without E2 for 24 h. Total RNA isolated from these cell cultures was used to determine pS2 mRNA levels by RT-PCR. GADPH mRNA was used as an expression control. RT-PCR products (shown as duplicate experiments) were separated in agarose gels and visualized under UV light (top panel). Densitometric analysis of pS2 mRNA levels in control and TTP-overexpressing MCF7 (C) or ZR75-1 cells (D) is represented as mean ± S.E. (error bars). Differences in pS2 mRNA levels between control and TTP-overexpressing MCF7 or ZR75-1 cells were shown to be statistically significant (p < 0.05).
To evaluate the functional impact of TTP in the expression of the ERα-dependent pS2 gene, we used RT-PCR to determine the pS2 mRNA levels in control and TTP-overexpressing MCF7 cells incubated for 24 h in hormone-free medium or in medium supplemented with E2. Control MCF7 cells stimulated with E2 exhibited a 60% increase in pS2 mRNA levels compared with unstimulated MCF7 cells (Fig. 8C, MCF7). In contrast, E2 stimulation of TTP-overexpressing MCF7 cells resulted in a 10% increase in pS2 mRNA levels compared with MCF7/TTP cells incubated in hormone-free medium (Fig. 8C, MCF7/TTP). To explore the generality of the TTP effect on breast cancer cells, this experiment was repeated using ERα +ve ZR75-1 cells (Fig. 8D, ZR75-1). In ZR75-1 cells, TTP overexpression produced a similar result, reducing pS2 mRNA levels in E2-stimulated cells (Fig. 8D).
TTP Overexpression Reduces Proliferation of MCF7 Cells
Given that ERα transactivation plays a key role in cell proliferation in normal mammary gland and breast cancer tumors, we explored whether TTP-overexpressing MCF7/TTP cells proliferate at a different rate than control MCF7 cells. For this assay 1.5 × 10⁵ control MCF7 or MCF7/TTP cells were allowed to divide in culture in the presence of E2, and the number of cells was determined at 24, 48, and 72 h. Although at 24 h, the numbers of control MCF7 and MCF7/TTP cells were similar, after 48 and 72 h, the number of MCF7/TTP cells was 43 and 20% lower, respectively, than the number of control MCF7 cells (Fig. 9A). These results suggest that TTP-overexpressing cells exhibit a slower rate of cell division.
FIGURE 9.

TTP effects on cell proliferation and tumorigenic potential of MCF7 cells. A, control MCF7 (white circles) and MCF7/TTP cells (black circles) grown in E2-supplemented medium for different times were counted using trypan blue. Results of three independent experiments are represented as mean ± S.E. (error bars). Differences between control MCF7 and MCF7/TTP cells numbers were shown to be statistically significant (p < 0.05). TTP overexpression reduces the tumorigenic potential of MCF7 cells in a nu/nu mouse model. Two groups of six nu/nu mice were injected with 3 × 10⁶ control MCF cells or 3 × 10⁶ MCF7-TTP cells, as described under “Experimental Procedures.” After 30 days, tumors were isolated (B), and their volume (C) and weight (D) were determined. Tumor volume and weight are represented as mean ± S.E. Differences between MCF7 and MCF7/TTP cell-derived tumors were shown to be statistically significant (p < 0.05).
TTP Overexpression Inhibits MCF7 Cell-induced Tumor Growth in Nude Mice
Because TTP overexpression reduced MCF7/TTP cell proliferation, we next determined whether TTP could also affect E2-dependent tumor growth by comparing the tumorigenic potential of MCF7/TTP cells and control MCF7 cells injected subcutaneously in a nude mouse model as described under “Experimental Procedures.” The results showed that control MCF7 cells produced tumors in 6 of 6 mice injected with these cells. In contrast, only 4 of 6 mice injected with MCF7/TTP cells were found to have tumors at the end of the experiment (Fig. 9B). After the tumors were removed, we found that TTP overexpression reduced the volume and weight of tumors by 50 and 40%, respectively, with respect to tumors produced by control MCF7 cells (Fig. 9, C and D). These results suggest that TTP expression reduced the tumorigenic potential of breast cancer MCF7 cells.
DISCUSSION
TTP had been previously characterized as 34-kDa protein localized both in the nucleus and cytoplasm of the cell (29). Structurally, TTP belongs to a family of RNA-binding proteins that are characterized by the presence of two tandem zinc finger domains (30–32). Several studies have shown that the function of TTP in the cytoplasm is to use its zinc finger domains to interact with AU-rich elements in the 3′-untranslated region (UTR) of mammalian transcripts. TTP binding to mRNAs promotes their degradation through the recruitment of the deadenylase components Not1 and Caf1 (33). In contrast, the function of TTP in the cell nucleus is not clearly understood. In this investigation, we have identified TTP as a novel ERα-associated protein in a yeast two-hybrid screen. The interaction of TTP with ERα in the nucleus of MCF7 and ZR75-1 breast cancer cells in vivo was confirmed by coimmunoprecipitation assays.
Our results show that for its binding to ERα, TTP uses its zinc finger domains to interact with the AF1/DBD domain of the nuclear receptor. The interaction between TTP and ERα is different from the binding mechanism used by other nuclear receptor coregulators. For example, coactivators, like SRC-1, and GRIP1/TIF2 use several LXXLL motifs to mediate their ligand-dependent interaction with the AF2 region of nuclear receptors (34). In the same way, corepressors, like NCOR and SMRT, possess a motif called the corepressor nuclear receptor box that contains the sequence (L/V)XX(I/V)I, which also mediates their interaction with the AF2 domain of nuclear receptors (17, 35, 36). The absence of LXXLL or (L/V)XX(I/V)I motifs in the TTP sequence is consistent with its preferential binding to the AF1/DBD domain of ERα.
The impact of TTP on ERα activity was assessed by transient transfection assays in ERα-expressing HepG2, MCF7, and ZR75-1 cells and in CV-1 cells, which are nuclear receptor-negative and thus are required to be cotransfected with human ERα. These results showed that TTP overexpression significantly reduced ERα transactivation in all cell lines tested. In contrast, transfection of siRNA-TTP in TTP-expressing MCF7 cells resulted in derepression of ERα transactivation, suggesting that the TTP repressor effect is specific. Our results also show that the ERα protein levels in MCF7 cells were not affected by transient or stable TTP overexpression, suggesting that TTP mRNA destabilizing activity is not involved in the repression of ERα transactivation. These results and the finding that both TTP and ERα are recruited to the promoter of the E2-responsive pS2 gene confirm that TTP functions as a bona fide ERα corepressor in human cells.
Molecular and functional studies have shown that ERα can both activate and repress gene expression. The dual function of this nuclear receptor results from the differential recruitment of coactivator and corepressors to its AF1 and AF2 domains. The exchange of coregulators is thought to play a key role in mediating the different functions of ERα, influence the response to its ligand or synthetic estrogen receptor modulators (37–40), and participate in the development of disorders like breast cancer. In this work, we have shown that transfection of TTP in MCF7 cells attenuates the coactivating activity of the AF2-associated coactivator SRC-1 in a dose-dependent manner. However, we also show that increasing concentrations of SRC-1 produce a derepression of ERα activity in TTP-expressing MCF7 cells. We showed further that the presence of TTP impairs the recruitment of SRC-1 to the promoter region of E2-dependent genes. These results suggest that exchange between TTP and coactivators like SRC-1 may play an important role in fine-tuning ERα transactivation in breast cancer cells.
Our results show that TTP exhibits intrinsic ERα-independent transcriptional activity capable of repressing the transcription of a luciferase reporter when expressed as a GAL4-DBD fusion protein. Analysis of TTP amino acid sequence revealed that this factor, unlike other coregulator proteins, does not contain a domain with an enzymatic activity that could mediate its transcriptional repressor effect through direct chromatin modification. Alternatively, we propose that the function of TTP as an ERα corepressor depends on the recruitment of histone deacetylases. The association of TTP with HDACs was confirmed using different experimental analysis. First, the ability of TTP to repress ERα transactivation was impaired when TTP-expressing cells were incubated in the presence of TSA, an inhibitor of class I and II mammalian HDACs. Second, pull-down assays show that TTP can interact in vitro with HDAC1, HDAC2, HDAC3, and HDAC7. Third, coimmunoprecipitation assays confirmed that in MCF7 cells in vivo, TTP is associated with endogenous HDAC1. We show further that association between TTP and HDAC1 is ligand-dependent. Whereas treatment of MCF7 cells with estradiol reduces TTP binding to HDAC1, the presence of tamoxifen enhances the interaction between these proteins. It has been previously shown that in the presence of tamoxifen, promoter-bound ERα mediates the sequential recruitment of two different repressor complexes (41). The first complex contains the corepressor NCoR, HDAC3, and a WD40 repeat protein TBL1 (42–44). The second is a chromatin-remodeling protein complex known as NURD (nucleosome remodeling and histone deacetylation) that includes HDAC1 (45–47). It has been proposed that the recruitment of different corepressor complexes harboring different HDACs produces a specific combinatorial code of deacetylation of histone tail residues that affects the expression of ERα-regulated genes (48). The effect of tamoxifen on the interaction of TTP with HDAC1 suggests the possibility that TTP could interact with a multiprotein corepressor complex like NURD. The TTP-mediated repression of ERα transactivation through the interaction with HDAC1 is a recurring mechanism used by other hormone nuclear receptor corepressors like NCoR, SMRT, RIP140, LCoR, and ZNF366. These corepressors act as docking platforms for the recruitment of protein complexes that include Class I and II HDACs and mSin3A (49).
Our results on the association of TTP with HDACs partially replicate those previously reported by Liang et al. (50). This group showed that TTP acts as a corepressor of p65/NF-κB interacting with HDAC1, HDAC3, and HDAC7. This finding and the new function of TTP as an ERα corepressor suggest that TTP, like other regulatory cofactors, is not exclusive to nuclear receptors, being able to modulate the activity of other DNA-binding transcription factors (51).
In recent years, different research groups have suggested that TTP functions as a tumor suppressor based on the following evidence. TTP expression is suppressed in different types of cancer tumors and cancer cell lines compared with normal tissues. In breast and prostate cancer, low TTP expression is used as a negative prognostic indicator, and it is associated with rapid tumor progression and poor clinical outcome (52). The role of TTP as a tumor suppressor has been attributed to its ability to promote the decay of mRNAs encoding cell factors involved in inflammation, angiogenesis, tissue invasion, and metastasis (53–58). However, the results presented in this report have substantially extended the known functions of TTP, suggesting that this protein could act as a tumor suppressor through a different mechanism. Our results show that MCF7 cells overexpressing TTP exhibit a significant reduction in ERα-dependent transcriptional activation and in E2-induced cell proliferation and tumorigenicity potential in mice. It is conceivable that the low TTP expression observed in breast cancer tumors both affects the cytoplasmic mRNA turnover and disrupts the nuclear regulation of ERα transactivation, which has been associated with the development and progression of 70–80% of breast cancer tumors. Further studies will be necessary to explore the potential of TTP in the development of new diagnostic and therapeutic strategies for breast cancer.
Acknowledgments
We thank Dr. Alfonso Gonzalez-Noriega for comments on this work and Rafael Cervantes-Roldán, Universidad Nacional Autónoma de México, for technical assistance.
This work was supported by Programa de Investigación de Cáncer de Mama, Instituto de Investigaciones Biomédicas, Universidad Nacional Autónoma de México (UNAM) and Consejo Nacional de Ciencia y Tecnología (Grants SALUD-CONACYT 14467 and 183069), and Fundación Miguel Alemán (Estímulo a la Investigación Médica 2013-1).
- ERα
- estrogen receptor α
- E2
- estradiol
- DBD
- DNA-binding domain
- HDAC
- histone deacetylase
- TTP
- tristetraprolin
- UAS
- upstream activating sequence
- TSA
- trichostatin A
- ERE
- estrogen response element(s).
REFERENCES
- 1. Jordan V. C. (1995) Studies on the estrogen receptor in breast cancer: 20 years as a target for the treatment and prevention of cancer. Breast Cancer Res. Treat. 36, 267–285 [DOI] [PubMed] [Google Scholar]
- 2. Gronemeyer H. (1991) Transcription activation by estrogen and progesterone receptors. Annu. Rev. Genet. 25, 89–123 [DOI] [PubMed] [Google Scholar]
- 3. Tora L., White J., Brou C., Tasset D., Webster N., Scheer E., Chambon P. (1989) The human estrogen receptor has two independent nonacidic transcriptional activation functions. Cell 59, 477–487 [DOI] [PubMed] [Google Scholar]
- 4. Tzukerman M. T., Esty A., Santiso-Mere D., Danielian P., Parker M. G., Stein R. B., Pike J. W., McDonnell D. P. (1994) Human estrogen receptor transactivational capacity is determined by both cellular and promoter context and mediated by two functionally distinct intramolecular regions. Mol. Endocrinol. 8, 21–30 [DOI] [PubMed] [Google Scholar]
- 5. Shiau A. K., Barstad D., Loria P. M., Cheng L., Kushner P. J., Agard D. A., Greene G. L. (1998) The structural basis of estrogen receptor/coactivator recognition and the antagonism of this interaction by tamoxifen. Cell 95, 927–937 [DOI] [PubMed] [Google Scholar]
- 6. Glass C. K., Rosenfeld M. G. (2000) The coregulator exchange in transcriptional functions of nuclear receptors. Genes Dev. 14, 121–141 [PubMed] [Google Scholar]
- 7. Spencer T. E., Jenster G., Burcin M. M., Allis C. D., Zhou J., Mizzen C. A., McKenna N. J., Onate S. A., Tsai S. Y., Tsai M. J., O'Malley B. W. (1997) Steroid receptor coactivator-1 is a histone acetyltransferase. Nature 389, 194–198 [DOI] [PubMed] [Google Scholar]
- 8. Green K. A., Carroll J. S. (2007) Oestrogen-receptor-mediated transcription and the influence of co-factors and chromatin state. Nat. Rev. Cancer 7, 713–722 [DOI] [PubMed] [Google Scholar]
- 9. Chen J. D., Evans R. M. (1995) A transcriptional co-repressor that interacts with nuclear hormone receptors. Nature 377, 454–457 [DOI] [PubMed] [Google Scholar]
- 10. Lavinsky R. M., Jepsen K., Heinzel T., Torchia J., Mullen T. M., Schiff R., Del-Rio A. L., Ricote M., Ngo S., Gemsch J., Hilsenbeck S. G., Osborne C. K., Glass C. K., Rosenfeld M. G., Rose D. W. (1998) Diverse signaling pathways modulate nuclear receptor recruitment of N-CoR and SMRT complexes. Proc. Natl. Acad. Sci. U.S.A. 95, 2920–2925 [DOI] [PMC free article] [PubMed] [Google Scholar]
- 11. Métivier R., Penot G., Hübner M. R., Reid G., Brand H., Kos M., Gannon F. (2003) Estrogen receptor-α directs ordered, cyclical, and combinatorial recruitment of cofactors on a natural target promoter. Cell 115, 751–763 [DOI] [PubMed] [Google Scholar]
- 12. Johnson C. A., Turner B. M. (1999) Histone deacetylases: complex transducers of nuclear signals. Semin. Cell Dev. Biol. 10, 179–188 [DOI] [PubMed] [Google Scholar]
- 13. Gburcik V., Picard D. (2006) The cell-specific activity of the estrogen receptor α may be fine-tuned by phosphorylation-induced structural gymnastics. Nucl. Recept. Signal. 4, e005. [DOI] [PMC free article] [PubMed] [Google Scholar]
- 14. Cenni B., Picard D. (1999) Ligand-independent activation of steroid receptors: new roles for old players. Trends Endocrinol. Metab. 10, 41–46 [DOI] [PubMed] [Google Scholar]
- 15. Weigel N. L., Zhang Y. (1998) Ligand-independent activation of steroid hormone receptors. J. Mol. Med. 76, 469–479 [DOI] [PubMed] [Google Scholar]
- 16. Nicholson R. I., McClelland R. A., Robertson J. F., Gee J. M. (1999) Involvement of steroid hormone and growth factor cross-talk in endocrine response in breast cancer. Endocr. Relat. Cancer 6, 373–387 [DOI] [PubMed] [Google Scholar]
- 17. Perissi V., Staszewski L. M., McInerney E. M., Kurokawa R., Krones A., Rose D. W., Lambert M. H., Milburn M. V., Glass C. K., Rosenfeld M. G. (1999) Molecular determinants of nuclear receptor-corepressor interaction. Genes Dev. 13, 3198–3208 [DOI] [PMC free article] [PubMed] [Google Scholar]
- 18. Green C. D., Thompson P. D., Johnston P. G., El-Tanani M. K. (2007) Interaction between transcription factor, basal transcription factor 3, and the NH2-terminal domain of human estrogen receptor α. Mol. Cancer Res. 5, 1191–1200 [DOI] [PubMed] [Google Scholar]
- 19. Deblois G., Giguère V. (2003) Ligand-independent coactivation of ERα AF-1 by steroid receptor RNA activator (SRA) via MAPK activation. J. Steroid Biochem. Mol. Biol. 85, 123–131 [DOI] [PubMed] [Google Scholar]
- 20. Watanabe M., Yanagisawa J., Kitagawa H., Takeyama K., Ogawa S., Arao Y., Suzawa M., Kobayashi Y., Yano T., Yoshikawa H., Masuhiro Y., Kato S. (2001) A subfamily of RNA-binding DEAD-box proteins acts as an estrogen receptor α coactivator through the N-terminal activation domain (AF-1) with an RNA coactivator, SRA. EMBO J. 20, 1341–1352 [DOI] [PMC free article] [PubMed] [Google Scholar] [Retracted]
- 21. Kim J. H., Li H., Stallcup M. R. (2003) CoCoA, a nuclear receptor coactivator which acts through an N-terminal activation domain of p160 coactivators. Mol. Cell 12, 1537–1549 [DOI] [PubMed] [Google Scholar]
- 22. Wu X., Li H., Chen J. D. (2001) The human homologue of the yeast DNA repair and TFIIH regulator MMS19 is an AF-1-specific coactivator of estrogen receptor. J. Biol. Chem. 276, 23962–23968 [DOI] [PubMed] [Google Scholar]
- 23. Gburcik V., Bot N., Maggiolini M., Picard D. (2005) SPBP is a phosphoserine-specific repressor of estrogen receptor α. Mol. Cell. Biol. 25, 3421–3430 [DOI] [PMC free article] [PubMed] [Google Scholar]
- 24. Wu L., Wu Y., Gathings B., Wan M., Li X., Grizzle W., Liu Z., Lu C., Mao Z., Cao X. (2003) Smad4 as a transcription corepressor for estrogen receptor α. J. Biol. Chem. 278, 15192–15200 [DOI] [PubMed] [Google Scholar]
- 25. Ma Q., Herschman H. R. (1991) A corrected sequence for the predicted protein from the mitogen-inducible TIS11 primary response gene. Oncogene 6, 1277–1278 [PubMed] [Google Scholar]
- 26. Varnum B. C., Lim R. W., Sukhatme V. P., Herschman H. R. (1989) Nucleotide sequence of a cDNA encoding TIS11, a message induced in Swiss 3T3 cells by the tumor promoter tetradecanoyl phorbol acetate. Oncogene 4, 119–120 [PubMed] [Google Scholar]
- 27. Valadez-Graham V., Razin S. V., Recillas-Targa F. (2004) CTCF-dependent enhancer blockers at the upstream region of the chicken α-globin gene domain. Nucleic Acids Res. 32, 1354–1362 [DOI] [PMC free article] [PubMed] [Google Scholar]
- 28. Ahn B. Y., Elwi A. N., Lee B., Trinh D. L., Klimowicz A. C., Yau A., Chan J. A., Magliocco A., Kim S. W. (2010) Genetic screen identifies insulin-like growth factor binding protein 5 as a modulator of tamoxifen resistance in breast cancer. Cancer Res. 70, 3013–3019 [DOI] [PubMed] [Google Scholar]
- 29. Taylor G. A., Thompson M. J., Lai W. S., Blackshear P. J. (1996) Mitogens stimulate the rapid nuclear to cytosolic translocation of tristetraprolin, a potential zinc-finger transcription factor. Mol. Endocrinol. 10, 140–146 [DOI] [PubMed] [Google Scholar]
- 30. DuBois R. N., McLane M. W., Ryder K., Lau L. F., Nathans D. (1990) A growth factor-inducible nuclear protein with a novel cysteine/histidine repetitive sequence. J. Biol. Chem. 265, 19185–19191 [PubMed] [Google Scholar]
- 31. Varnum B. C., Ma Q. F., Chi T. H., Fletcher B., Herschman H. R. (1991) The TIS11 primary response gene is a member of a gene family that encodes proteins with a highly conserved sequence containing an unusual Cys-His repeat. Mol. Cell. Biol. 11, 1754–1758 [DOI] [PMC free article] [PubMed] [Google Scholar]
- 32. Phillips R. S., Ramos S. B., Blackshear P. J. (2002) Members of the tristetraprolin family of tandem CCCH zinc finger proteins exhibit CRM1-dependent nucleocytoplasmic shuttling. J. Biol. Chem. 277, 11606–11613 [DOI] [PubMed] [Google Scholar]
- 33. Sandler H., Kreth J., Timmers H. T., Stoecklin G. (2011) Not1 mediates recruitment of the deadenylase Caf1 to mRNAs targeted for degradation by tristetraprolin. Nucleic Acids Res. 39, 4373–4386 [DOI] [PMC free article] [PubMed] [Google Scholar]
- 34. Heery D. M., Kalkhoven E., Hoare S., Parker M. G. (1997) A signature motif in transcriptional co-activators mediates binding to nuclear receptors. Nature 387, 733–736 [DOI] [PubMed] [Google Scholar]
- 35. Hu X., Lazar M. A. (1999) The CoRNR motif controls the recruitment of corepressors by nuclear hormone receptors. Nature 402, 93–96 [DOI] [PubMed] [Google Scholar]
- 36. Nagy L., Kao H. Y., Love J. D., Li C., Banayo E., Gooch J. T., Krishna V., Chatterjee K., Evans R. M., Schwabe J. W. (1999) Mechanism of corepressor binding and release from nuclear hormone receptors. Genes Dev. 13, 3209–3216 [DOI] [PMC free article] [PubMed] [Google Scholar]
- 37. Osborne C. K., Zhao H., Fuqua S. A. (2000) Selective estrogen receptor modulators: structure, function, and clinical use. J. Clin. Oncol. 18, 3172–3186 [DOI] [PubMed] [Google Scholar]
- 38. Katzenellenbogen B. S., Montano M. M., Ediger T. R., Sun J., Ekena K., Lazennec G., Martini P. G., McInerney E. M., Delage-Mourroux R., Weis K., Katzenellenbogen J. A. (2000) Estrogen receptors: selective ligands, partners, and distinctive pharmacology. Recent Prog. Horm. Res. 55, 163–193; discussion 194–165 [PubMed] [Google Scholar]
- 39. Fisher B., Costantino J. P., Wickerham D. L., Cecchini R. S., Cronin W. M., Robidoux A., Bevers T. B., Kavanah M. T., Atkins J. N., Margolese R. G., Runowicz C. D., James J. M., Ford L. G., Wolmark N. (2005) Tamoxifen for the prevention of breast cancer: current status of the National Surgical Adjuvant Breast and Bowel Project P-1 study. J. Natl. Cancer Inst. 97, 1652–1662 [DOI] [PubMed] [Google Scholar]
- 40. Shang Y., Brown M. (2002) Molecular determinants for the tissue specificity of SERMs. Science 295, 2465–2468 [DOI] [PubMed] [Google Scholar]
- 41. Liu X. F., Bagchi M. K. (2004) Recruitment of distinct chromatin-modifying complexes by tamoxifen-complexed estrogen receptor at natural target gene promoters in vivo. J. Biol. Chem. 279, 15050–15058 [DOI] [PubMed] [Google Scholar]
- 42. Guenther M. G., Lane W. S., Fischle W., Verdin E., Lazar M. A., Shiekhattar R. (2000) A core SMRT corepressor complex containing HDAC3 and TBL1, a WD40-repeat protein linked to deafness. Genes Dev. 14, 1048–1057 [PMC free article] [PubMed] [Google Scholar]
- 43. Li J., Wang J., Wang J., Nawaz Z., Liu J. M., Qin J., Wong J. (2000) Both corepressor proteins SMRT and N-CoR exist in large protein complexes containing HDAC3. EMBO J. 19, 4342–4350 [DOI] [PMC free article] [PubMed] [Google Scholar]
- 44. Zhang J., Kalkum M., Chait B. T., Roeder R. G. (2002) The N-CoR-HDAC3 nuclear receptor corepressor complex inhibits the JNK pathway through the integral subunit GPS2. Mol. Cell 9, 611–623 [DOI] [PubMed] [Google Scholar]
- 45. Ayer D. E. (1999) Histone deacetylases: transcriptional repression with SINers and NuRDs. Trends Cell Biol. 9, 193–198 [DOI] [PubMed] [Google Scholar]
- 46. Zhang Y., Iratni R., Erdjument-Bromage H., Tempst P., Reinberg D. (1997) Histone deacetylases and SAP18, a novel polypeptide, are components of a human Sin3 complex. Cell 89, 357–364 [DOI] [PubMed] [Google Scholar]
- 47. Zhang Y., LeRoy G., Seelig H. P., Lane W. S., Reinberg D. (1998) The dermatomyositis-specific autoantigen Mi2 is a component of a complex containing histone deacetylase and nucleosome remodeling activities. Cell 95, 279–289 [DOI] [PubMed] [Google Scholar]
- 48. Vermeulen M., Carrozza M. J., Lasonder E., Workman J. L., Logie C., Stunnenberg H. G. (2004) In vitro targeting reveals intrinsic histone tail specificity of the Sin3/histone deacetylase and N-CoR/SMRT corepressor complexes. Mol. Cell. Biol. 24, 2364–2372 [DOI] [PMC free article] [PubMed] [Google Scholar]
- 49. Deltour S., Guerardel C., Leprince D. (1999) Recruitment of SMRT/N-CoR-mSin3A-HDAC-repressing complexes is not a general mechanism for BTB/POZ transcriptional repressors: the case of HIC-1 and γFBP-B. Proc. Natl. Acad. Sci. U.S.A. 96, 14831–14836 [DOI] [PMC free article] [PubMed] [Google Scholar]
- 50. Liang J., Lei T., Song Y., Yanes N., Qi Y., Fu M. (2009) RNA-destabilizing factor tristetraprolin negatively regulates NF-κB signaling. J. Biol. Chem. 284, 29383–29390 [DOI] [PMC free article] [PubMed] [Google Scholar]
- 51. Perissi V., Rosenfeld M. G. (2005) Controlling nuclear receptors: the circular logic of cofactor cycles. Nat. Rev. Mol. Cell Biol. 6, 542–554 [DOI] [PubMed] [Google Scholar]
- 52. Brennan S. E., Kuwano Y., Alkharouf N., Blackshear P. J., Gorospe M., Wilson G. M. (2009) The mRNA-destabilizing protein tristetraprolin is suppressed in many cancers, altering tumorigenic phenotypes and patient prognosis. Cancer Res. 69, 5168–5176 [DOI] [PMC free article] [PubMed] [Google Scholar]
- 53. Gebeshuber C. A., Zatloukal K., Martinez J. (2009) miR-29a suppresses tristetraprolin, which is a regulator of epithelial polarity and metastasis. EMBO Rep. 10, 400–405 [DOI] [PMC free article] [PubMed] [Google Scholar]
- 54. Al-Souhibani N., Al-Ahmadi W., Hesketh J. E., Blackshear P. J., Khabar K. S. (2010) The RNA-binding zinc-finger protein tristetraprolin regulates AU-rich mRNAs involved in breast cancer-related processes. Oncogene 29, 4205–4215 [DOI] [PMC free article] [PubMed] [Google Scholar]
- 55. Al-Ahmadi W., Al-Ghamdi M., Al-Souhibani N., Khabar K. S. (2013) miR-29a inhibition normalizes HuR over-expression and aberrant AU-rich mRNA stability in invasive cancer. J. Pathol. 230, 28–38 [DOI] [PMC free article] [PubMed] [Google Scholar]
- 56. Upadhyay R., Sanduja S., Kaza V., Dixon D. A. (2013) Genetic polymorphisms in RNA binding proteins contribute to breast cancer survival. Int. J. Cancer 132, E128–E138 [DOI] [PMC free article] [PubMed] [Google Scholar]
- 57. Goddio M. V., Gattelli A., Slomiansky V., Lacunza E., Gingerich T., Tocci J. M., Facchinetti M. M., Curino A. C., LaMarre J., Abba M. C., Kordon E. C. (2012) Mammary differentiation induces expression of Tristetraprolin, a tumor suppressor AU-rich mRNA-binding protein. Breast Cancer Res. Treat. 135, 749–758 [DOI] [PubMed] [Google Scholar]
- 58. Milke L., Schulz K., Weigert A., Sha W., Schmid T., Brüne B. (2013) Depletion of tristetraprolin in breast cancer cells increases interleukin-16 expression and promotes tumor infiltration with monocytes/macrophages. Carcinogenesis 34, 850–857 [DOI] [PubMed] [Google Scholar]