Abstract
Tumors are appreciated to be an intrinsically heterogeneous population of cells with varying proliferation capacities and tumorigenic potentials. As a central tenet of the so-called cancer stem cell hypothesis, most cancer cells have only a limited lifespan and thus cannot initiate or re-initiate tumors. Longevity and clonogenicity are properties unique to the subpopulation of cancer stem cells. To understand the implications of the population structure suggested by this hypothesis - a hierarchy consisting of cancer stem cells and progeny non-stem cancer cells which experience a reduction in their remaining proliferation capacity per division - we set out to develop a mathematical model for the development of the aggregate population. We show that overall tumor progression rate during the exponential growth phase is identical to the growth rate of the cancer stem cell compartment. Tumors with identical stem cell proportions, however, can have different growth rates, dependent on the proliferation kinetics of all participating cell populations. Analysis of the model revealed that the proliferation potential of non-stem cancer cells is likely to be small to reproduce biologic observations. Furthermore, a single compartment of non-stem cancer cell population may adequately represent population growth dynamics only when the compartment proliferation rate is scaled with the generational hierarchy depth.
Keywords: cancer stem cells, mathematical model, cancer progression, age structure, compartment model
1 Introduction
It is now widely appreciated that tumors contain cells with different tumor-perpetuation capacities and survival fates. So-called cancer stem cells, or tumor initiating cells, make up an often-argued minor subpopulation of cells that are uniquely able to initiate persistent tumor growth, and reinitiate tumors after preferentially surviving immune surveillance or therapeutic interventions. The majority of cancer cells in tumors are cells that lack longevity and have only limited proliferative potential; so-called non-stem cancer cells. Heterogeneous populations of cancer cells composed of subpopulations with and without stemness fate have been identified, for example, in tumors of the breast, brain, prostate and colon (Al-Hajj et al. (2003); Singh et al. (2003); Fioriti et al. (2008); Cammareri et al. (2008)). The proportion of cancer stem cells in a tumor differs among organ systems, and may even span multiple orders of magnitude amongst patients with tumors of the same organ (Visvader and Lindeman (2008)). While the hierarchical structure in a tumor population is conceptually well understood, cancer stem and non-stem cell-cell interactions and their implications for overall tumor growth dynamics are yet to be completely deciphered.
Mathematical, physical, computational and engineering techniques have increasingly been applied to the complex biological system that arises from stem cells and non-stem cell dynamics (Turner et al. (2009); Michor et al. (2005); Sottoriva et al. (2010); Kapitanov (2012); Marciniak-Czochra et al. (2009a); Tomasetti and Levy (2010); Youssefpour et al. (2012); Rodriguez-Brenes and Peskin (2010); Daniel et al. (2002); Beretta and Capasso (2012); Piotrowska et al. (2008); Solé et al. (2008)). Ganguly and Puri (2006) used a compartmental model to study the emergence of abnormal progeny populations after oncogenic hits. The model showed that the growth rate of abnormal cell populations increases with fast consecutive insults that cause sudden cell depletion and subsequent stem and progenitor cell outgrowth.
Focusing on the exponential tumor growth phase, Johnston et al. (2010) and Molina-Peña and Álvarez (2012) developed ordinary differential equation models of stem, transit-amplifying (or progenitor), and fully differentiated cell populations to study constant cancer stem cells fractions in tumors. Depending on the tumor growth and differentiation rates balance, Johnston et al. (2010) showed that stem cells can comprise any proportion of the tumor, and that higher stem cell proportions likely yield more aggressive tumors. Molina-Peña and Álvarez (2012) showed that certain kinetic relationships must be satisfied in order for the calculated tumor growth and stem cell fraction to be consistent with experimental observation. Recently, Hillen et al. (2012) developed an integro-differential equation model of cancer stem and non-stem cell populations, based on an agent-based model by Enderling et al. (2009), and showed that the two populations interact with each other such that higher rates of cell death in the non-stem compartment lead to enrichment of cancer stem cells and thus accelerated overall growth. The Hillen model considered tumor growth beyond the exponential growth phase and introduced a carrying capacity, which could either be spatial limitations due to for example tissue membranes or dense muscle tissues (Enderling et al. (2013)), or vascular diffusion imposed oxygen tension (Hahnfeldt et al. (1999)). Constant cell turnover and competition with the carrying capacity revealed that the cancer stem cell fraction may not be constant, but in fact be continuously increasing, with a pure cancer stem cell state being the only stable steady state in that model (Hillen et al. (2012)).
While differential equation models simulate tumor population dynamics, the interaction of individual cell populations with each other is difficult to analyze. In particular, non-stem cancer cells are either grouped into a single compartment (Hillen et al. (2012)) or divided into transit amplifying cells and fully differentiated cells (Johnston et al. (2010); Molina-Peña and Álvarez (2012)). Agent-based models and cellular automaton approaches, however, have shown that in addition to cancer stem cell self renewal (Sottoriva et al. (2010); Enderling et al. (2013)), the number of amplifications of progenitor cells is one of the most pivotal modulators of overall tumor dynamics (Enderling et al. (2009); Morton et al. (2011))
To model the cellular hierarchy in more detail and quantitatively capture subcompartment interactions, Rodriguez-Brenes et al. (2013) developed a compartment model to investigate cell dynamics within a cell lineage for homeostatic equilibria. Cell division in each compartment occurs at a compartment-specific rate and self-replication probability. The model is aimed to understand how the number of intermediate cell compartments, self-replication probabilities, and division rates affect the distribution of the replication capacities in the non-stem population.
Marciniak-Czochra et al. (2009b) developed a multi-compartment differential equation model for hematopoietic differentiation to study if hematopoiesis is compatible with cell division restrictions. In their model, differentiation and proliferation potential, i.e. number of divisions until senescence, represent independent dimensions with 6 and 50 stages, respectively. The larger number of divisions is obtained by assuming self-renewal throughout the differentiation hierarchy. Simulations of the model showed hematopoiesis with proliferation and self-renewal fractions correlating with differentiation stage. Interestingly, progenitor cell proliferation potential decreases with age, which is compensated for by an increase in cell number (Marciniak-Czochra et al. (2009b)). In a study of different 6-compartment models of the hematopoietic system, Marciniak-Czochra et al. (2009a) showed that the number of cell divisions before terminal maturation is dependent on the rates of stem and progenitor cell proliferation. Taking this analytical approach a step further, in a recent study, Werner et al. developed closed analytical solutions for mutations in a multi compartment model of normal tissue lineages for which they assumed a finite number of cells, a constant number of stem cells and symmetric self-renewal in all compartments (Werner et al. (2011)). The model showed that mutations in non-stem cells die out, whereas an equilibrium of mutated cells can be reached if mutations occur in stem cells or differentiated cells that acquire stem cell properties (Werner et al. (2011)).
Motivated by the analytic inroads made by Marciniak-Czochra et al. (2009b) and Werner et al. (2011), we set out to develop a multi-compartment differential equation model for the development of a heterogeneous cancer cell population where each tumor subpopulation is comprised of cells of comparable remaining proliferation potential. We will analyze the dominant cell population as a function of cancer stem cell kinetics and estimate cell turnover that yield experimentally observed data.
2 Cancer Stem Cells
Reliable experimental isolation of cancer stem cells and their long term in vitro culture maintenance are the subject of extensive ongoing research (Sherley (2002); Lathia et al. (2011); Sottoriva et al. (2013); Driessens et al. (2013)). The cancer stem cell hypothesis, perhaps more aptly termed the cancer non-stem cell hypothesis, postulates that only a stem-like subpopulation can initiate or sustain tumor growth, as well as give rise to the observed phenotypic diversity in a tumor (Al-Hajj et al. (2003)). Conceptually, only cancer stem cells are long-lived and have unlimited replicative potential. Non-stem cancer cells have a limited proliferative potential and will inevitably die when that potential is exhausted. During non-stem cancer cell division, both non-stem daughter cancer cells will inherit a decremented proliferation potential, arguably due to erosion of non-coding DNA end segments, so-called telomeres that serve as the cell’s mitotic clock (Olovnikov (1973); Blackburn and Gall (1978); Harley et al. (1990)). Cancer stem cells can either divide symmetrically to produce two cancer stem cells or asymmetrically to produce a cancer stem cell and a non-stem cancer cell, or undergo symmetric commitment to give rise to two non-stem cancer cells. The fate of cancer stem cell division may also depend on a number of other factors, including modulation by external stimulatory queues (Lathia et al. (2011)) of importance for understanding clinically relevant tumor evolution (Gillies et al. (2012); Orlando et al. (2013)). As a first step toward understanding the entire process, however, we seek here to and elucidate the essential role of intrinsic tumor composition and proliferation kinetics in the process.
3 Linear Multicompartment Model
We focus our analysis on exponential tumor growth, that is physiological regulatory feedback on stem cell division and self-renewal is lost (Rodriguez-Brenes et al. (2011)) and spatial inhibition is neglected (Folkman and Hochberg (1973)). We assume that cancer stem cells have unlimited replicative potential, and perform symmetric division into two cancer stem cells with probability p1, asymmetric division into one cancer stem cell and one non-stem cancer cell with probability p2, and symmetric commitment with probability p3 = 1−p1 −p2 resulting in two non-stem cancer cells. We assume that non-stem cancer cells are non-clonogenic and undergo a finite number of divisions before dying. We denote this proliferation capacity by m. We assume that an mth generation non-stem cancer cell suffers replicative cell death as it tries to proliferate. In the model, the proliferation rates (also called the number of cell cycles per unit time) λ and γ of stem and non-stem cancer cells as well as their respective death rates a and b are constant.
Let C(t) denote the number of cancer stem cells at time t and Nk(t) denote the number of kth generation non-stem cancer cells at time t for k = 1, ··· , m. Change in the cancer stem cell population is due to symmetric division, symmetric commitment, and cell death. Cancer stem cells are produced at rate p1λC, and are removed via cell death at the rate aC and via symmetric differentiation into two first generation non-stem cancer cells at rate p3λC. In addition to symmetric cancer stem cell differentiation, first generation non-stem cancer cells are created during asymmetric cancer stem cell division at the rate p2λC. The first generation non-stem cancer cell population gets depleted by division into second generation cells at rate γN1 and also via cell death at rate bN1. The kth generation of non-stem cancer cells gain cells with rate 2γNk−1 cells per unit time and lose cells at the rates γNk due to further divisions into the next compartments and the rate bNk due to death. Attempted division in the mth generation results in replicative death. Table 1 summarizes the parameters used in the model and and their typical values. The flow into and out of these generational compartments is illustrated in Figure 1 and is described by the following system of ordinary differential equations:
| (1) |
| (2) |
| (3) |
| (4) |
Table 1.
Model variables and parameters with chosen values and appropriate references
| name | meaning | typical values | reference | |
|---|---|---|---|---|
|
| ||||
| C(t) | number of cancer stem cells at time t | |||
| Nk(t) | number of kth generation non-stem cancer cells at time t | |||
| H(t) | total number of non-stem cancer cell population at time t |
|
||
| Q(t) | total number of cancer cells at time t | C(t) + H(t) | ||
| Γ | total population of cancer cells per cancer stem cell | Q/C | ||
| p1 | probability of symmetric cancer stem cell division | 0.01 − 0.35 | Gao et al. (2013) | |
| p2 | probability of asymmetric cancer stem cell division | 1 − p1 − p3 | ||
| p3 | probability of symmetric cancer stem cell commitment | 0 | ||
| m | proliferation capacity of non-stem cancer cells | 3 – 11 | Morton et al. (2011) | |
| λ | proliferation rate of cancer stem cells | 1 | Gao et al. (2013) | |
| γ | proliferation rate of non-stem cancer cells | 1 | Gao et al. (2013) | |
| a | death rate of cancer stem cells | 0 – 0.1 | ||
| b | death rate of non-stem cancer cells | 0 – 0.1 | ||
| β | net growth rate of cancer stem cells | (p1 − p3)λ − a | ||
| θ | 2γ/(γ + β + b) | |||
Fig. 1.
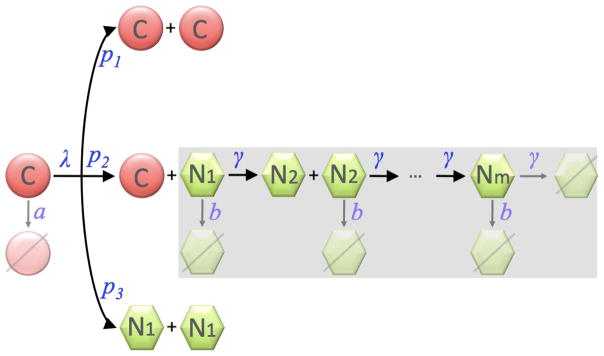
Cell populations in the multicompartment age-structured model. The shaded area highlights the generational hierarchy of non-stem cancer cells. C: cancer stem cells; Nk: the kth generation of non-stem cancer cells.
Let
denote the net growth rate of the cancer stem cell population. To study tumor growth dynamics, we consider β > 0. The exact analytical solution to the linear system (1)–(4) is derived in Appendix 1 and is given as follows:
| (5) |
and
for k = 1, ··· , m. Here, the parameter θ is
Since β, γ, b > 0, θ is positive. Note, if θ = 1, then γ − b = β; essentially, the net growth rate of non-stem cancer cells equals the net growth rate of cancer stem cells. If θ < 1, then γ − b < β expresses that the net growth rate of non-stem cancer cells is less than that of the stem cells.
We denote the total population of non-stem cancer cells by H(t),
and we find that
where
The long-term asymptotic behaviors of Nk(t) and H(t) are given by
| (6) |
and
| (7) |
If we define Γ to be the total tumor population that arises per cancer stem cell, then the total tumor population Q in the long run is
| (8) |
and
| (9) |
The asymptotic rate of change of the total tumor population is
Therefore, the net change in total tumor population per unit time – a putative measure of tumor aggressiveness – is simply the net growth rate of cancer stem cells β:
The asymptotic solutions (6) are the direct solutions of the linear system assuming the contributing cancer stem cell population has a net growth behaving like eβt. This is in agreement with the study of the exponential tumor growth phase as done by Johnston et al. (2010). Beyond the initial transient, we find that if θ > 1, i.e. γ − b > β, the generational contribution to the total population at time t is
whereas if θ < 1 then the generation sizes are in reverse order
If θ = 1, all non-stem cancer cell populations contribute equally to the total tumor population with
and Hs = mN1s.
From (8), the long-term proportion of cancer stem cells in the tumor settles to
| (10) |
and its reciprocal defines the total cancer cell population that arises from a single cancer stem cell, i.e.
| (11) |
where Γ is defined in (9).
For θ > 1, the ratio of total cells to cancer stem cells grows asymptotically exponentially as the proliferation capacity m of non-stem cancer cells increases, driving the stem cell fraction towards 0. (Figure 2). By contrast, For θ < 1, as m approaches infinity, the cancer stem cell proportion decreases towards a finite value > 0, specifically,
Fig. 2.
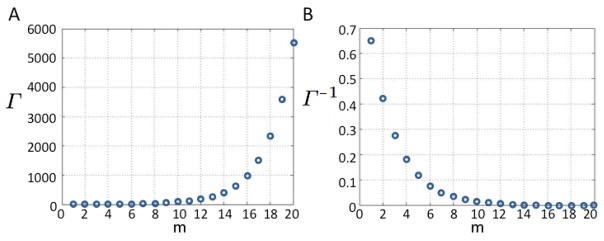
A) Tumor population per cancer stem cell Γ and B) proportion of cancer stem cells Γ−1 for increasing generational hierarchy depths m. Other parameters: β = 0.2, γ = 1, λ = 1, p1 = 0.3, p2 = 0.7, a = 0.1, b = 0.1, θ = 1.5385.
and the total population that arises per cancer stem cell increases to Γθ<1,m→∞.
For θ = 1,
and as m increases the proportion of cancer stem cells in the tumor decreases towards zero.
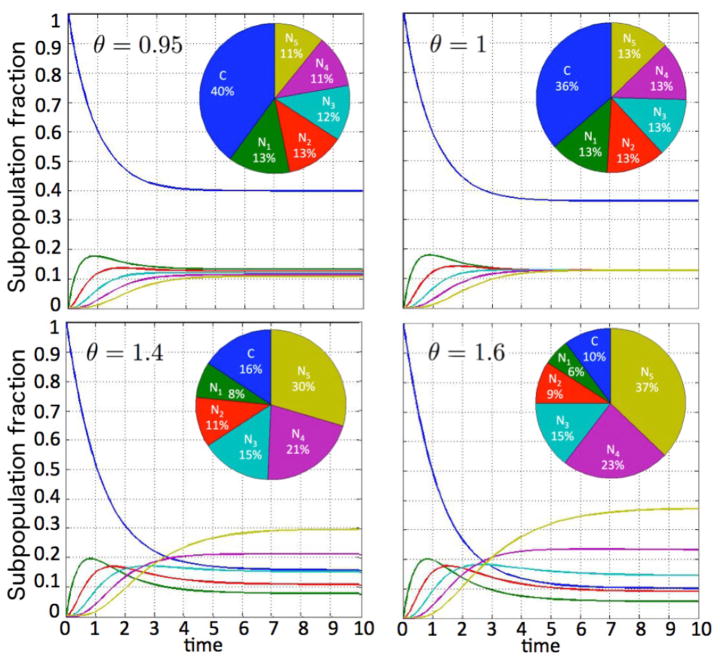
To illustrate the tumor growth dynamics and generational hierarchy within the tumor, let us consider the positive net cancer stem cell growth rate of β = 0.2, and a non-stem cancer cell proliferation capacity of m = 5. Let the proliferation rates of stem and non-stem cancer cells be γ = λ = 1, and assume the cancer stem cell death rate and division fate parameters are a = 0.1 and p1 = 0.3, p2 = 0.7, p3 = 0, respectively. Figure 3 shows how the tumor population per cancer stem cell increases as θ increases. The variation in θ here arises due to changes in the death rate of non-stem cancer cells b (with larger b values yielding smaller θ values). Figure 4 shows how the proportion of the subpopulations in the tumor evolves in time for various θ values, starting from a pure cancer stem cell population (C(0) = 1, Nk(0) = 0). After the initial transience, there is always an eventual strict ordering for the Nk population fractions when θ ≠ 1 as discussed above, but the final proportional contribution of C depends on the chosen parameter set.
Fig. 3.
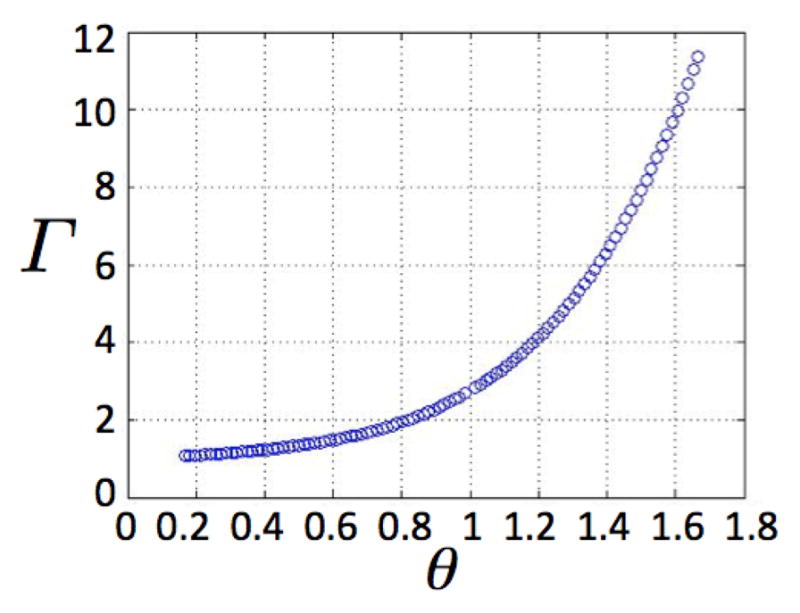
Tumor population per cancer stem cell Γ due to various θ, assuming m = 5. Other parameters: β = 0.2, γ = 1, λ = 1, p1 = 0.3, p2 = 0.7, a = 0.1.
Fig. 4.
Temporal evolution of subpopulation fractions dependent on parameter θ.
4 Estimation of non-stem cancer cell proliferation potential
As experimental biomarkers for proliferation potential are yet to be developed, we use the current model to investigate plausible ranges of the non-stem cancer cell proliferation potential. Gao et al. (2013) recently reported that the cell cycle of U87MG human glioblastoma cells varies between 19 and 35 hours in vitro, with an average of 25 hours. These experiments set the limits for the proliferation rates in our model from a low of 24/35 = 0.69 to a high of 24/19 = 1.26. In line with the assumptions and observations in Gao et al. (2013), we set the cancer stem cell division probabilities p1 = 0.35, p2 = 0.65, p3 = 0, and the cell death rates a = 0, b = 0.1. Let C(0)=1, and Nk(0)=0. We calculate the total tumor population Q after t = 50 time steps for varying values of non-stem proliferation rates γ. We fix the cancer stem cell proliferation rate at λ = 1 (Fig. 5A), and λ = 1.26 or λ = 0.69 (Fig. 5B) for a non-stem cancer cell proliferation capacity m = 5. Results show that there exists a non-stem cancer cell proliferation rate γ* such that tumor size is maximized at t = 50. The total tumor population generated per cancer stem cell, i.e. Γ = Q/C, mimics the dynamics of the total population (Fig. 5A). These observed γ* = 1.24, 1.49, and 0.95 for λ = 1, 1.26, and 0.69, respectively, indicate that tumor growth is optimized with cell cycle times between 16 and 26 hours, as observed in experiments (Gao et al. (2013)). For larger m = 10 (with λ = 1), however, the largest populations are achieved with biologically unrealistic γ* = 3.46, 4.18, and 2.65, indicative of cell cycles as short as 5 – 9 hours. In fact, for fixed λ = 1, various proliferation capacities 3 ≤ m ≤ 11 and probabilities of symmetric cancer stem cell division 0 < p1 ≤ 0.5 reveal that only a subset of the parameter space (4 ≤ m ≤ 9) yields optimal tumor growth within experimentally observed cell cycle times (Figure 6). Interestingly, for increasing progenitor proliferation potential m, the probability of symmetric cancer stem cell division p1 must decrease for the tumor to grow to the maximum possible size for realistic cell cycle lengths. Reciprocally, for increasing p1 the progenitor proliferation potential m must decrease to optimize overall tumor growth.
Fig. 5.

A) Graphs of Q and Q/C versus γ for λ fixed at 1. B) Graph of Q/C versus γ for λ fixed at 24/19 = 1.26 (dashed) and λ fixed at 24/35 = 0.69 (solid). Other parameters: m = 5, p1 = 0.35, a = 0, b = 0.1
Fig. 6.
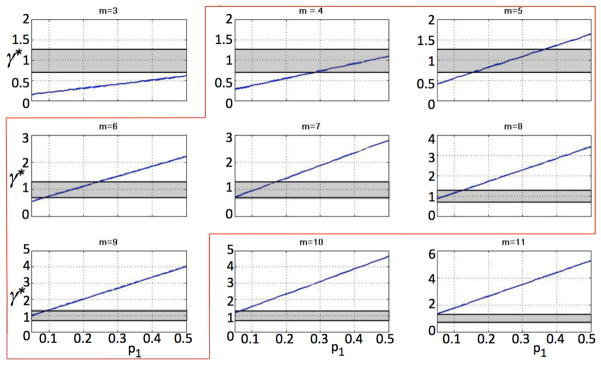
Values of optimal γ* for different p1 for various m. Shaded areas indicate experimentally observed cell cycle times. Highlighted are parameter sets that yield optimal growth rates γ*(p1) within biological observations.
5 Two-compartment model
Mathematical models of cancer stem cell driven tumors previously assumed two (cancer stem cells and non-stem cancer cells; Hillen et al. (2012)), three (cancer stem cells, progenitor cells, and terminally differentiated cells; Johnston et al. (2010); Molina-Peña and Álvarez (2012)) or four compartments (cancer stem cells, progenitor cells, differentiated cells and terminally differentiated cells; Michor et al. (2005)). We reduce the introduced multicompartment model (1)–(4)) to a two-compartment model and compare the resulting dynamics to the multicompartment model as well as models from the literature. Summing up the equations for all Nk in system (2)–(4) gives
| (12) |
| (13) |
This equation, along with (1), would give a two-compartment model to replace (1)–(4) if we could explicitly express Nm in terms of C or H.
Equation (6) for k = m suggests that we use the approximation
while (6) and (7) lead us to consider the approximation
| (14) |
As shown in Appendix 2, approximation of Nm in terms of C is inappropriate. Approximating Nm with H (14) and closing the system yields a two-compartment model:
| (15) |
| (16) |
We denote the solution of H in this system as H2H.
Let m → ∞ and assume that θ < 1, so that is finite as m → ∞ (hence Nm → 0). Then (12) and (13) give
This gives exactly the linear version of the two-compartment model for stem and non-stem populations in Hillen et al. (2012) under the assumption of immortal stem cells (a = 0) and no symmetric commitment (p3 = 0):
| (17) |
| (18) |
In Hillen et al. (2012), it is assumed that b > 0 reflects exhaustion of proliferation potential as well as spontaneous death. We denote the solution of H in this system as H∞.
Figure 7 illustrates the agreement of H2H, the solution of our two-compartment model (15)–(16), with the solution of the multicompartment solution of H in (1)–(4), for various m and θ < 1 fixed. The figures also show that the solution H∞ of the linear two-compartment model (17)–(18) which does not have an explicit consideration of the proliferation capacity m does not give the correct multicompartment solution for moderate m but matches better as m gets large. Figure 8 illustrates the point that the linear version of the Hillen two-compartment model is quite unsuitable for θ > 1.
Fig. 7.
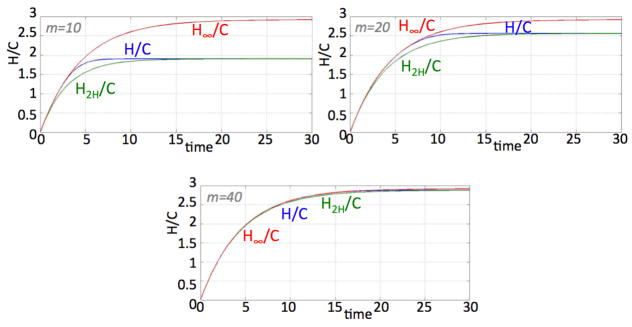
Solutions of H/C in (1)–(4), H2H/C in (15)–(16), and H∞/C in (17)–(18) for m = 10, 20, and 40. Other parameters: λ = γ = 1, p1 = 0.35, p2 = 0.65, a = 0, b = 0.87222 and θ = 0.9.
Fig. 8.

Solutions of H/C in (1)–(4), H2H/C in (15)–(16), and H∞/C in (17)–(18) for p1 = 0.35, p3 = 0, a = 0, λ = γ = 1 and m = 10 for θ = 1.1 and 1.3.
This suggests that the growth rate value for γ in a two-compartment model (18) would not be equivalent to the value for γ used in a multicompartment model (2)–(4). That is, treating a non-stem cancer cell population with proliferation capacity m as a homogeneously-aged population requires the proliferation rate γ to be replaced for each generation with a net proliferation rate γ∞ of all generations taken together. For example, (16) and (18) suggests using
The importance of scaling the net proliferation rate with a generational hierarchy depth dependent proliferation capacity is illustrated in Figure 9. The solution of the two-compartment model (15)–(16) disagrees with that of the full multicompartment solution if an inappropriate m is used.
Fig. 9.
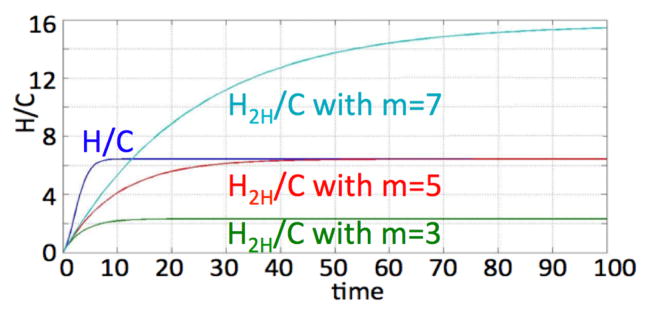
Solution of H/C in (1)–(4) p1 = 0.35, p3 = 0, a = 0.1, λ = γ = 1, θ = 1.5 for m = 5 and H2H/C in (15)–(16) for m = 3, m = 5 and m = 7.
6 Discussion
We have presented a linear multi-compartment mathematical model of tumor growth following the cancer stem cell hypothesis. As an augmentation to the increasing literature on mathematical models of cancer stem cell-driven tumor growth, we introduced different non-stem cancer cell compartments that comprise cells of comparable remaining proliferation potential. This generational hierarchy has been shown to play a prominent role in modulating overall tumor population dynamics in agent-based models (Enderling et al. (2009); Morton et al. (2011)). For simplicity we ignored physiological regulatory feedback (Rodriguez-Brenes et al. (2011)) and focused on the exponential growth phase of the tumor in line with other recent studies (Johnston et al. (2010); Molina-Peña and Álvarez (2012)). Introducing a population carrying capacity or feedback from non-stem cancer cells on cancer stem cells will modulate overall tumor progression rate, but not the generational hierarchy population structure analysis presented here. Analysis of the presented model showed that the net rate of change of the total tumor population, interpretable as tumor aggressiveness, is simply the net growth rate of the cancer stem cell compartment, β. This result is intrinsic to multi-compartment models where a pure non-stem cancer cell population decays. Exploration of the parameter space of the presented model revealed that tumors with identical aggressiveness β can have remarkably different proportions of cancer stem cells. Reciprocally, tumors with identical cancer stem cell fraction, can have different net population growth rates and thus different aggressiveness. This contrasts with observations in Johnston et al. (2010)) that suggested that a higher cancer stem cell fraction correlates with a more aggressive tumor if the total tumor population follows a strict exponential growth regime.
As one focus of our study was on the contribution of the proliferation potential of non-stem cancer cells to overall population dynamics, we investigated the proportion of cancer stem cells in the arising tumor dependent on the generational hierarchy of their non-stem progeny. We found, intuitively, that with increasing non-stem cancer cell proliferation capacity the total tumor population increases as well as the population generated by each cancer stem cell. Inversely proportionally, however, the fraction of cancer stem cells diminishes. At the same time, the contribution of each generational compartment to the total population reverses from predominantly older compartments, that is cells that have proliferated more with consequently decreasing remaining proliferation potential, to preferentially young cells in equally-sized tumors. Despite identical cancer stem cell kinetics, tumor size and overall tumor growth rate, the intrinsic death rate of the non-stem cancer cell compartments may have a pivotal contribution to treatment outcome. Tumors with mostly post-mitotic cells may not benefit from treatment as much as tumors with primarily young cells.
In exploration of the model parameter space we found an unexpected dependence of optimal tumor growth on basic cell kinetics. Analysis of the model revealed that only low non-stem cancer cell proliferation capacities yield optimum tumor growth for cell cycle times that are within biologically observed ranges. That indicates that tumors either grow with sub-optimal cell cycle times, or that non-stem cancer cells must be short-lived. Support to the latter hypothesis comes from the somewhat counterintuitive observation that cancer cell telomere length indicative of proliferative capacity is surprisingly short in most tumors (Shay and Wright (2011)).
The model presented herein is the first attempt to decipher the contribution of the generational hierarchy in the non-stem cancer cell population to overall tumor dynamics. For simplicity, we assumed a rigid cellular phenotype and ignored cell de-differentiation and resulting phenotypic plasticity (Marjanovic et al. (2013)). A mathematical description of stem cell plasticity (Roeder and Loeffler (2002); Leder et al. (2010)) as well as non-linearity from saturations (Johnston et al. (2010)) or population-level carrying capacity limitations (Folkman and Hochberg (1973)) can be incorporated in future model developments to arrive at a more comprehensive understanding of the complex biology underlying cancer stem cell-driven tumor dynamics.
Acknowledgments
This research arose from a summer project and research collaboration between the ICBP Education & Outreach effort of the Center of Cancer Systems Biology, GRI and Worcester Polytechnic Institute as part of the WPI Research Experience for Undergraduates Program. This work was supported by the ASSURE program of the Department of Defense in partnership with the National Science Foundation REU Site program under Award DMS-1004795 (S. Weekes) and the National Cancer Institute under Award Number U54CA149233 (L. Hlatky).
Appendix 1
We introduce the notations
Then, using (5), we rewrite the system of equations (2)–(4) as
where β = (p1 − p3) λ − a. Define
and substitute nk(t)e−zt in the system above to arrive at
| (19) |
| (20) |
| (21) |
| (22) |
so
where
The asymptotic behavior of Nk for large t is
The exact solution for H is found by direct summation over the Nk:
Defining
and using
we get that
The asymptotic behavior of H for large t is
Appendix 2
Replacing Nm in (13) with the expression
from (6) gives the two-compartment system:
| (23) |
| (24) |
We denote the solution of H in this system as H2C.
The exact solution to the two-compartment model with (24) is such that
where
and where Hs is the asymptotic solution of the multicompartment system given in (7),
Now θ < 1 ⇒ κ1 < 0 and, in this case, we see that H2C/C → Hs/C as time passes but when θ > 1, we have κ1 > 0 so H2C/C diverges from Hs/C and this two-compartment model is not reliable.
On the other hand, if we use the equation (16) as the second equation in our two-compartment model:
the solution for H which we have called H2H is such that
where
Here κ2 < 0 for all θ > 0, so that H2H → Hs for large time which is what we need.
Figure 10 compares the H/C that comes from the full multicompartment model, the H2H/C coming from (16), and H2C/C coming from (24). One can indeed see that when θ < 1, H2C/C gives a good approximation to H/C, but not when θ > 1. For the parameters used in the latter case, H2C/C is negative and the solution heads to −∞.
Fig. 10.

Comparison of H/C, H2H/C, and H2C/C for θ = 0.95 and θ = 1.2. Other parameters: m = 10, λ = 1, γ = 1, p1 = 0.35, p2 = 0.65, a = 0.1, β = 0.25.
Contributor Information
Suzanne L. Weekes, Email: sweekes@wpi.edu, Department of Mathematical Sciences, Worcester Polytechnic Institute, Worcester, MA 01609, U.S.A., Tel.: 1(508)831-5267, Fax: 1(508)831-5824
Brian Barker, Department of Mathematics, University of Rochester, Rochester, NY 14627, U.S.A.
Sarah Bober, Department of Mathematical Sciences, Worcester Polytechnic Institute, Worcester, MA 01609, U.S.A., Tel.: 1(508)831-5267, Fax: 1(508)831-5824.
Karina Cisneros, Department of Mathematics, Dominican University, River Forest, IL 60305, U.S.A.
Justina Cline, Department of Mathematics and Computer Science, Coe College, Cedar Rapids, IA 52402, U.S.A.
Amanda Thompson, Department of Mathematics, University of North Carolina at Chapel Hill, Chapel Hill, NC 27599, U.S.A.
Lynn Hlatky, Email: lynn.hlatky@tufts.edu, Center of Cancer Systems Biology, GeneSys Research Institute, Tufts University School of Medicine, Boston, MA 02135, U.S.A., Tel.: 1(617)789-2995, Fax: 1(617)562-7142.
Philip Hahnfeldt, Email: philip.hahnfeldt@tufts.edu, Center of Cancer Systems Biology, GeneSys Research Institute, Tufts University School of Medicine, Boston, MA 02135, U.S.A., Tel.: 1(617)789-2995, Fax: 1(617)562-7142.
Heiko Enderling, Email: heiko.enderling@mofitt.org, Center of Cancer Systems Biology, GeneSys Research Institute, Tufts University School of Medicine, Boston, MA 02135, U.S.A., Tel.: 1(617)789-2995, Fax: 1(617)562-7142. Integrated Mathematical Oncology, H. Lee Moffitt Cancer Center & Research Institute, Tampa, FL 33612, U.S.A., Tel.: 1(813)745-3562, Fax: 1(813)745-6497.
References
- Al-Hajj M, Wicha MS, Benito-Hernandez A, Morrison SJ, Clarke MF. Prospective identification of tumorigenic breast cancer cells. Proceedings of the National Academy of Sciences of the United States of America. 2003;100(7):3983–3988. doi: 10.1073/pnas.0530291100. [DOI] [PMC free article] [PubMed] [Google Scholar]
- Beretta E. Capasso Mathematical modelling of cancer stem cells V. Population behavior. Mathematical Modeling of Natural Phenomena. 2012;7(1):279–305. [Google Scholar]
- Blackburn EH, Gall JG. A tandemly repeated sequence at the termini of the extrachromosomal ribosomal RNA genes in Tetrahymena. Journal of Molecular Biology. 1978;120(1):33–53. doi: 10.1016/0022-2836(78)90294-2. [DOI] [PubMed] [Google Scholar]
- Cammareri P, Lombardo Y, Francipane MG, Bonventre S, Todaro M, Stassi G. Isolation and culture of colon cancer stem cells. Methods in Cell Biology. 2008;86:311–324. doi: 10.1016/S0091-679X(08)00014-9. [DOI] [PubMed] [Google Scholar]
- Daniel Y, Ginosar Y, Agur Z. The universal properties of stem cells as pinpointed by a simple discrete model. Journal of Mathematical Biology. 2002;44 (1):79–86. doi: 10.1007/s002850100115. [DOI] [PubMed] [Google Scholar]
- Driessens G, Beck B, Caauwe A, Simons BD, Blanpain C. Defining the mode of tumour growth by clonal analysis. Nature. 2013;488(7412):527–530. doi: 10.1038/nature11344. [DOI] [PMC free article] [PubMed] [Google Scholar]
- Enderling H, Anderson ARA, Chaplain MAJ, Beheshti A, Hlatky L, Hahnfeldt P. Paradoxical dependencies of tumor dormancy and progression on basic cell kinetics. Cancer Research. 2009;69(22):8814–8821. doi: 10.1158/0008-5472.CAN-09-2115. [DOI] [PubMed] [Google Scholar]
- Enderling H, Hlatky L, Hahnfeldt P. Cancer stem cells: a minor cancer subpopulation that redefines global cancer features. Frontiers In Oncology. 2013;3:76. doi: 10.3389/fonc.2013.00076. [DOI] [PMC free article] [PubMed] [Google Scholar]
- Fioriti D, Mischitelli M, Di Monaco F, Di Silverio F, Petrangeli E, Russo G, Giordano A, Pietropaolo V. Cancer stem cells in prostate adenocarci-noma: a target for new anticancer strategies. Journal of Cellular Physiology. 2008;216(3):571–575. doi: 10.1002/jcp.21493. [DOI] [PubMed] [Google Scholar]
- Folkman J, Hochberg M. Self-regulation of growth in three dimensions. The Journal of Experimental Medicine. 1973;138:745–753. doi: 10.1084/jem.138.4.745. [DOI] [PMC free article] [PubMed] [Google Scholar]
- Ganguly R, Puri IK. Mathematical model for the cancer stem cell hypothesis. Cell Proliferation. 2006;39(1):3–14. doi: 10.1111/j.1365-2184.2006.00369.x. [DOI] [PMC free article] [PubMed] [Google Scholar]
- Gao X, McDonald JT, Hlatky L, Enderling H. Acute and fractionated irradiation differentially modulate glioma stem cell division kinetics. Cancer Research. 2013;73(5):1481–1490. doi: 10.1158/0008-5472.CAN-12-3429. [DOI] [PMC free article] [PubMed] [Google Scholar]
- Gillies RJ, Verduzco D, Gatenby RA. Evolutionary dynamics of carcino-genesis and why targeted therapy does not work. Nature Reviews Cancer. 2012;12(7):487–493. doi: 10.1038/nrc3298. [DOI] [PMC free article] [PubMed] [Google Scholar]
- Hahnfeldt P, Panigrahy D, Folkman J, Hlatky L. Tumor development under angiogenic signaling: a dynamical theory of tumor growth, treatment response, and postvascular dormancy. Cancer Research. 1999;59(19):4770–4775. [PubMed] [Google Scholar]
- Harley CB, Futcher AB, Greider CW. Telomeres shorten during ageing of human fibroblasts. Nature. 1990;345(6274):458–460. doi: 10.1038/345458a0. [DOI] [PubMed] [Google Scholar]
- Hillen T, Enderling H, Hahnfeldt P. The tumor growth paradox and immune system-mediated selection for cancer stem cells. Bulletin of Mathematical Biology. 2012;75(1):161–184. doi: 10.1007/s11538-012-9798-x. [DOI] [PubMed] [Google Scholar]
- Johnston MD, Maini PK, Chapman SJ, Edwards CM, Bodmer WF. On the proportion of cancer stem cells in a tumour. Journal of Theoretical Biology. 2010;266(4):708–711. doi: 10.1016/j.jtbi.2010.07.031. [DOI] [PubMed] [Google Scholar]
- Kapitanov G. A Mathematical Model of Cancer Stem Cell Lineage Population Dynamics with Mutation Accumulation and Telomere Length Hierarchies. Mathematical Modelling of Natural Phenomena. 2012;7(1):136–165. [Google Scholar]
- Lathia JD, Hitomi M, Gallagher J, Gadani SP, Adkins J, Vasanji A, Liu L, Eyler CE, Heddleston JM, Wu Q, Minhas S, Soeda A, Hoeppner DJ, Ravin R, McKay RDG, McLendon RE, Corbeil D, Chenn A, Hjelme-land AB, Park DM, Rich JN. Distribution of CD133 reveals glioma stem cells self-renew through symmetric and asymmetric cell divisions. Cell Death & Disease. 2011;2(9):e200–11. doi: 10.1038/cddis.2011.80. [DOI] [PMC free article] [PubMed] [Google Scholar]
- Leder K, Holland EC, Michor F. The Therapeutic Implications of Plasticity of the Cancer Stem Cell Phenotype. PLoS One. 2010;5(12):e14366. doi: 10.1371/journal.pone.0014366. [DOI] [PMC free article] [PubMed] [Google Scholar]
- Marciniak-Czochra A, Stiehl T, Ho AD, Jäger W, Wagner W. Modeling of Asymmetric Cell Division in Hematopoietic Stem Cells—Regulation of Self-Renewal Is Essential for Efficient Repopulation. Stem Cells and Development. 2009a;18(3):377–386. doi: 10.1089/scd.2008.0143. [DOI] [PubMed] [Google Scholar]
- Marciniak-Czochra A, Stiehl T, Wagner W. Modeling of replicative senescence in hematopoietic development. Aging. 2009b;1(8):723–732. doi: 10.18632/aging.100072. [DOI] [PMC free article] [PubMed] [Google Scholar]
- Marjanovic ND, Weinberg RA, Chaffer CL. Cell plasticity and heterogeneity in cancer. Clinical Chemistry. 2013;59(1):168–179. doi: 10.1373/clinchem.2012.184655. [DOI] [PMC free article] [PubMed] [Google Scholar]
- Michor F, Hughes TP, Iwasa YNP, Sawyers CL, Nowak MA. Dynamics of chronic myeloid leukaemia. Nature Cell Biology. 2005;435(7046):1267–1270. doi: 10.1038/nature03669. [DOI] [PubMed] [Google Scholar]
- Molina-Peña R, Álvarez MM. A Simple Mathematical Model Based on the Cancer Stem Cell Hypothesis Suggests Kinetic Commonalities in Solid Tumor Growth. PLoS ONE. 2012;7(2):e26233. doi: 10.1371/journal.pone.0026233. [DOI] [PMC free article] [PubMed] [Google Scholar]
- Morton CI, Hlatky L, Hahnfeldt P, Enderling H. Non-stem cancer cell kinetics modulate solid tumor progression. Theoretical Biology and Medical Modelling. 2011;8(1):48. doi: 10.1186/1742-4682-8-48. [DOI] [PMC free article] [PubMed] [Google Scholar]
- Olovnikov AM. A theory of marginotomy: the incomplete copying of template margin in enzymic synthesis of polynucleotides and biological significance of the phenomenon. Journal of Theoretical Biology. 1973;41(1):181–190. doi: 10.1016/0022-5193(73)90198-7. [DOI] [PubMed] [Google Scholar]
- Orlando PA, Gatenby RA, Brown JS. Tumor Evolution in Space: The Effects of Competition Colonization Tradeoffs on Tumor Invasion Dynamics. Frontiers In Oncology. 2013;3 doi: 10.3389/fonc.2013.00045. [DOI] [PMC free article] [PubMed] [Google Scholar]
- Piotrowska MJ, Enderling H, Uan der Heiden, Mackey MC. Mathematical modeling of stem cells related to cancer. In: Dittmar Thomas, Zaenker Kurt S., editors. Cancer and Stem Cells. Nova Science; 2008. pp. 1–25. [Google Scholar]
- Rodriguez-Brenes IA, Peskin CS. Quantitative theory of telomere length regulation and cellular senescence. Proceedings of the National Academy of Sciences. 2010;107(12):5387–5392. doi: 10.1073/pnas.0914502107. [DOI] [PMC free article] [PubMed] [Google Scholar]
- Rodriguez-Brenes IA, Komarova NL, Wodarz D. Evolutionary dynamics of feedback escape and the development of stem-cell? driven cancers. Proceedings of the National Academy of Sciences. 2011;108(47):18983–18988. doi: 10.1073/pnas.1107621108. [DOI] [PMC free article] [PubMed] [Google Scholar]
- Rodriguez-Brenes IA, Wodarz D, Komarova NL. Minimizing the risk of cancer: tissue architecture and cellular replication limits. Journal of the Royal Society Interface. 2013;10(86):20130410. doi: 10.1098/rsif.2013.0410. [DOI] [PMC free article] [PubMed] [Google Scholar]
- Roeder I, Loeffler M. A novel dynamic model of hematopoietic stem cell organization based on the concept of within-tissue plasticity. Experimental Hematology. 2002;30:853–861. doi: 10.1016/s0301-472x(02)00832-9. [DOI] [PubMed] [Google Scholar]
- Shay JW, Wright WE. Role of telomeres and telomerase in cancer. Seminars in Cancer Biology. 2011;21(6):349–353. doi: 10.1016/j.semcancer.2011.10.001. [DOI] [PMC free article] [PubMed] [Google Scholar]
- Sherley JL. Asymmetric cell kinetics genes: the key to expansion of adult stem cells in culture. Stem Cells. 2002;20(6):561–572. doi: 10.1634/stemcells.20-6-561. [DOI] [PubMed] [Google Scholar]
- Singh SK, Clarke ID, Terasaki M, Bonn VE, Hawkins C, Squire J, Dirks PB. Identification of a cancer stem cell in human brain tumors. Cancer Research. 2003;63(18):5821–5828. [PubMed] [Google Scholar]
- Solé RV, Rodríguez-Caso C, Deisboeck TS, Saldaña J. Cancer stem cells as the engine of unstable tumor progression. Journal of Theoretical Biology. 2008;253(4):629–637. doi: 10.1016/j.jtbi.2008.03.034. [DOI] [PubMed] [Google Scholar]
- Sottoriva A, Verhoeff JJC, Borovski T, McWeeney SK, Naumov L, Medema JP, Sloot PMA, Vermeulen L. Cancer Stem Cell Tumor Model Reveals Invasive Morphology and Increased Phenotypical Heterogeneity. Cancer Research. 2010;70(1):46–56. doi: 10.1158/0008-5472.CAN-09-3663. [DOI] [PubMed] [Google Scholar]
- Sottoriva A, Spiteri I, Shibata D, Curtis C, Tavare S. Single-Molecule Genomic Data Delineate Patient-Specific Tumor Profiles and Cancer Stem Cell Organization. Cancer Research. 2013;73(1):41–49. doi: 10.1158/0008-5472.CAN-12-2273. [DOI] [PMC free article] [PubMed] [Google Scholar]
- Tomasetti C, Levy D. Role of symmetric and asymmetric division of stem cells in developing drug resistance. Proceedings of the National Academy of Sciences. 2010;107(39):16766–16771. doi: 10.1073/pnas.1007726107. [DOI] [PMC free article] [PubMed] [Google Scholar]
- Turner C, Stinchcombe AR, Kohandel M, Singh S, Sivaloganathan S. Characterization of brain cancer stem cells: a mathematical approach. Cell Proliferation. 2009;42(4):529–540. doi: 10.1111/j.1365-2184.2009.00619.x. [DOI] [PMC free article] [PubMed] [Google Scholar]
- Visvader JE, Lindeman GJ. Cancer stem cells in solid tumours: accumulating evidence and unresolved questions. Nature Reviews Cancer. 2008;8(10):755–768. doi: 10.1038/nrc2499. [DOI] [PubMed] [Google Scholar]
- Werner B, Dingli D, Lenaerts T, Pachero JM, Traulsen A. Dynamics of Mutant Cells in Hierarchical Organized Tissues. PLoS Computational Biology. 2011;7(12):e1002290. doi: 10.1371/journal.pcbi.1002290. [DOI] [PMC free article] [PubMed] [Google Scholar]
- Youssefpour H, Li X, Lander AD, Lowengrub JS. Multispecies model of cell lineages and feedback control in solid tumors. Journal of Theoretical Biology. 2012;304(C):39–59. doi: 10.1016/j.jtbi.2012.02.030. [DOI] [PMC free article] [PubMed] [Google Scholar]


