Abstract
Shape-based virtual screening is an established and effective method for identifying small molecules that are similar in shape and function to a reference ligand. We describe a new method of shape-based virtual screening, volumetric aligned molecular shapes (VAMS). VAMS uses efficient data structures to encode and search molecular shapes. We demonstrate that VAMS is an effective method for shape-based virtual screening and that it can be successfully used as a pre-filter to accelerate more computationally demanding search algorithms. Unique to VAMS is a novel minimum/maximum shape constraint query for precisely specifying the desired molecular shape. Shape constraint searches in VAMS are particularly efficient and millions of shapes can be searched in a fraction of a second. We compare the performance of VAMS with two other shape-based virtual screening algorithms a benchmark of 102 protein targets consisting of more than 32 million molecular shapes and find that VAMS provides a competitive trade-off between run-time performance and virtual screening performance.
Keywords: molecular shape, virtual screening, shape indexing, shape constraints, GSS tree
INTRODUCTION
Molecular shape is a useful component in the identification of small-molecules for therapeutic intervention,1 and shape-based virtual screens have successfully identified novel inhibitors.2–7 Shape-based virtual screening attempts to identify the most similar molecules in a molecular database to a given set of one or more known active molecules. Alternatively, if the receptor structure is available, a pseudo-ligand can be derived from the shape of the binding site.8 Shape similarity is typically determined either through alignment methods, which construct a three dimensional overlay of two shapes, or through feature vector methods, which reduce shapes to a lower-dimension vector of features that are compared numerically. In addition to steric volume, the electrostatic or pharmacophoric features of the shape may be taken into account when assessing similarity.9–14 These additional features are referred to as the shape ‘color’.
Alignment methods attempt to either maximize the volume overlap of two molecules or the correspondence between identified feature points, such as molecular field extrema.9,10 Volume overlap is usually maximized by representing the molecular shape as a collection of Gaussians,15,16 sampling several starting points, and using numerical optimization to find a local maximum. This approach is exemplified by the ROCS tool from OpenEye Software, which is competitive to molecular docking approaches.17 Alternatively, the molecule may be decomposed into a set of features, such as pharmacophore features,14,18 field points,9–11 or hyperbolical paraboloid representations of patches of molecular surface,19 and various point correspondence algorithms may be used to generate an alignment. Although a number of performance improvements to alignment methods have been described,2,14,16,20,21 the task remains computationally intensive.
An alternative, computationally less demanding approach is to reduce molecular shapes to a simple vector of Boolean or numerical features. For example, a small set of reference shapes may be used to define a Boolean shape-fingerprint22,23 or translation and rotation invariant properties such as geometric moments24,25 or ray-tracing histograms26 maybe used to create a numeric vector. Both shape and pharmacophore25 information can be encoded. Shape similarity is then computed by comparing these feature vectors using an appropriate metric, such as Euclidean distance. The simplicity of the feature vector representation results in fast screening (millions of shape comparisons per second,24 but comes at the loss of accuracy, as the high dimensional space of molecular shape is reduced to a small vector of numbers, and interpret-ability, as the result does not include a spatial alignment to the query molecule. As an example, ‘Ultrafast Shape Recognition’ (USR)24 calculates the first three statistical moments of the distribution of atom distances from four predefined reference points relative to the center of the molecule. This reduces a molecular shape down to a vector of 12 floating point numbers.
Here we describe a new method of shape-based virtual screening, volumetric aligned molecular shapes (VAMS). VAMS uses efficient data structures to encode and search voxelizations of molecular shapes. A voxel is a three-dimensional pixel; a voxelation of a 3D object is essentially a three-dimensional bitmap. Unlike a feature vector approach, this volumetric representation fully encodes the molecular shape up to the precision of the resolution of voxelization. This shape representation has a similar fidelity to the actual molecular shape as alignment methods. However, because shapes are pre-aligned to a canonical reference system, there is no need to optimize an alignment and comparisons are substantially faster. Additionally, unlike previous shape-based methods, VAMS supports sub-linear search of large databases through the use of a GSS-tree27,28 indexing data structure. We show that the virtual screening performance of VAMS approaches that of the ROCS alignment method despite being able to screen databases in time comparable to feature vector approaches. Consequently, VAMS is effective as a pre-screen for accelerating shape-based virtual screening. Finally, we demonstrate how VAMS supports a novel minimum/maximum shape constraint method of searching for molecular shapes. Shape constraint search is a feature unique to VAMS and allows users to precisely specify the desired molecular shape. We show that this search method has the potential to produce highly enriched subsets and that searches scale sub-linearly with the size of the search space (millions of shapes can be screened in a fraction of a second).
METHODOLOGY
We describe the VAMS approach to shape-based virtual screening and our benchmarking methodology for comparing VAMS to a feature vector approach (USR) and an alignment approach (ROCS).
VAMS Matching
Molecular Shape Representation
In VAMS, molecular shapes are represented as a solvent-excluded volume that is calculated from the heavy atoms of a molecular conformation using a water probe of radius 1.4Å. This volume is then discretized onto a 0.5Å resolution grid where each grid point represents a voxel (three dimensional pixel). Voxelized volumes are stored in a specialized oct-tree data structure.28 An oct-tree is a hierarchical data structure for efficiently representing volumetric data that scales with the surface area of an object, not its volume.31,32 For example, when performing a volume overlap calculation between two shapes, not every voxel of these shapes needs to be compared. Instead, the hierarchical nature of the data structure allows for short-circuiting of volume comparison operations in identical sub-regions of shapes, such as the interior of molecules where all the voxels are set. An example of a voxelized representation of a ligand and its receptor is shown in Figure 1. In order to automatically create minimum/maximum shape constraints, we grow or shrink the voxelized shape. These operations are performed on the grid by removing the appropriate number of surface voxels. For example, to shrink a molecule by 1.0 Å, at a 0.5 Å resolution two layers of surface voxels. A surface voxel is defined as any voxel that does not have a neighbor on all of its six faces.
Figure 1.
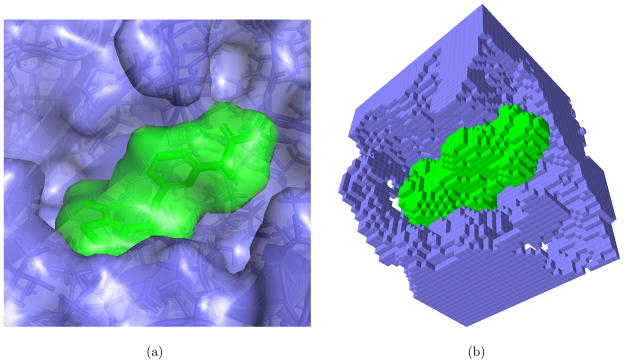
The reference ligand and receptor for the AmpC beta-lactamase target from the DUD-E benchmark. (a) The ligand (green) and receptor (blue) shown with molecular surfaces and (b) a cutaway of the voxelization of these molecular shapes at a 0.5Å resolution. Images generated with PyMOL29 and Sproxel.30
Molecular Shape Alignment and Comparison
The VAMS approach to shape comparison requires that all shapes are oriented in a standard coordinate system as shapes are compared ‘in place’. In order for VAMS to work, molecular shapes must be oriented within this coordinate system such that similar shapes have a high degree of overlap. We achieve this by aligning molecule conformations with respect to the moments of inertia of their heavy atom centers. For a given molecule with n heavy atoms with coordinates (x, y, z) we first translate the molecule to the origin and then compute the inertial matrix I:
where the elements of the matrix have the form:
The eigenvalues of I constitute the principal axes of rotation and define a rotation matrix that we apply to the atom coordinates to align the molecule to its moments of inertia (if the determinant of this matrix is negative, the matrix is negated to avoid introducing a reflection).
Alignment to inertial moments generally produces consistent poses with good overlap for similarly shaped molecules. However, a molecular shape may be aligned to its principal axis in one of four ways, corresponding to 180° rotations about the axes. In order to construct a canonical alignment, after aligning a molecule to its principal axes, we compute partial moments of inertia for the half-spaces defined by an axial plane and rotate the molecule to ensure these partial moments are consistently ordered. We first compute the partial moments and
and then rotate the molecule about the x-axis if and only . The process is then repeated for ( ) and the y-axis.
We use shape Tanimoto2 to compute the similarity, δ, of two aligned molecular shapes A and B:
In the context of voxelized shapes, this is the number of voxels present in both shapes divided by the number of voxels present in either shape. It is a measure of the spatial overlap of the shapes normalized by their merged volume. A value of zero indicates that shapes do not overlap while a value of one indicates that the shapes are identical.
Shape Constraints
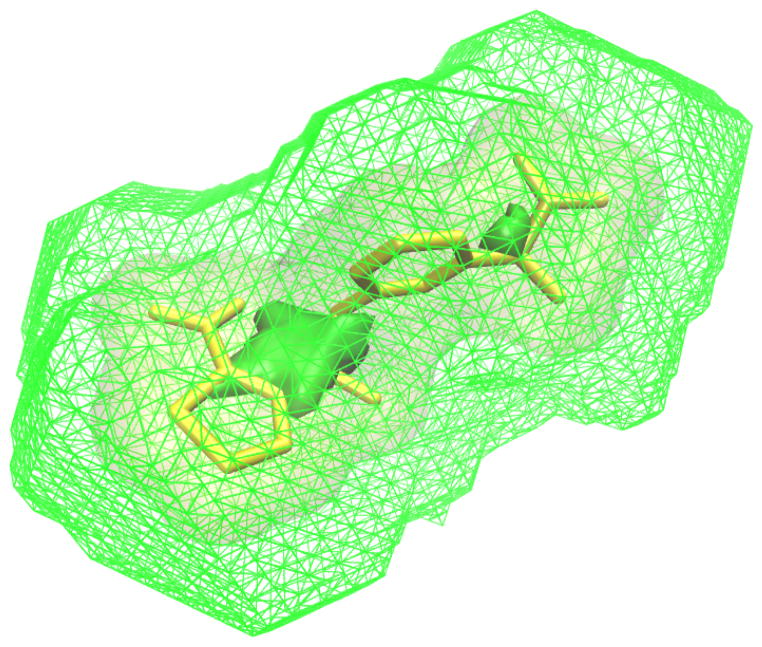
Shape constraints are a feature unique to VAMS. Since we enforce that all shapes are registered to a common coordinate system, it is possible to exactly specify regions of space within this coordinate system that a molecular volume should occupy. We refer to these constraints as minimum and maximum shape constraints. A minimum shape constraint is a set of voxels that must be part of the target shape. A minimum shape can be used to require that the desired shape makes key contacts with the receptor or has sufficient bulk to fill a binding pocket. A maximum shape constraint is a set of voxels that the desired shape must be fully contained within. A maximum shape limits the volume and dimensions of the desired shape. Minimum and maximum shape constraints can be obtained directly from a reference ligand shape, as shown in Figure 2, by shrinking the ligand shape to get a minimum shape constraint and growing the ligand shape to get a maximum shape constraint. We refer to the amount the shape is shrunk/grown as the gap distance. In order to match these shape constraints, a shape must have a surface that is exclusively within the gap between the minimum and maximum shape. The smaller the gap, the closer a matching shape to the molecular shape of the reference ligand.
Figure 2.
The AmpC reference ligand (yellow) shown with minimum (solid green) and maximum (mesh green) volumetric shape constraints defined only by the ligand. The shape constraints were created by shrinking/growing the ligand volume by a gap distance of 2Å.
An alternative interpretation of a maximum shape constraint is to consider its inverse, which defines an excluded volume. Ligands that match the maximum shape constraint do not intrude on this excluded volume. A receptor structure provides a natural starting point for defining an excluded volume (and its corresponding maximum shape constraint). The receptor shape can be shrunk by a gap distance to increase tolerance of minor clashes and to compensate for the potential plasticity of the binding site. Examples of shape constraints derived from a ligand-receptor complex using different gap distances are shown in Figure 3. For ease of interpretation, the inverse of the maximum shape constraint, which corresponds to the excluded volume defined by the receptor, is shown.
Figure 3.
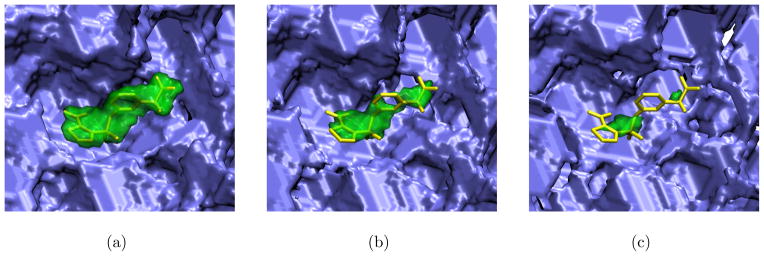
The AmpC reference ligand (yellow sticks) shown with a minimum shape constraint (green) derived from the ligand and the inverse of a maximum shape constraint (blue) derived from the reference receptor. Shape constraints are created by shrinking the volume of the ligand/receptor by a specific gap distance. Shape constraints are shown for gap distances of (a) 1 Å, (b) 1.5 Å, and (c) 2.0 Å. Together, these shape constraint define a query that selects molecular shapes that fully contain the green volume and do not overlap the blue volume. Images generated with VMD.33
Minimum and maximum shape constraints permit a user to ‘sculpt’ a precise specification of the desired shape. An expert user may be able to create highly specific and meaningful custom shape constraints. However, for purposes of our evaluation we consider only shape constraints derived directly and automatically from existing receptor-ligand complexes using preset gap distances. These shape constraints would serve as starting points for modifications by an expert user. For example, they could be modified to better incorporate knowledge of receptor flexibility in specific areas or to target specific binding pockets.
Shape Indexing
Unlike other shape-based virtual screening methods, the VAMS method of shape representation supports the indexing of molecular shapes. An indexing approach allow searches to be performed on large databases of molecular shapes without evaluating every shape in the database and enables search algorithms that scale sub-linearly with the size of the database. We use a matching and packing28 bulk-loading approach to initialize a GSS-tree27 shape index. Each leaf of this tree is a single molecular shape and each internal node includes a maximum included volume (MIV) and minimum surrounding volume (MSV). The MIV of a node is the intersection of all the molecular shapes beneath the node in the tree while the MSV is the union. An illustration of a GSS-tree node is shown in Figure 4. The MIV and MSV can be used to determine if a shape query will apply to any of the shapes lower in the tree. For similarity search, the MIV and MSV provide a maximum bound, δmax, on the best possible similarity to a given ligand L:
Figure 4.
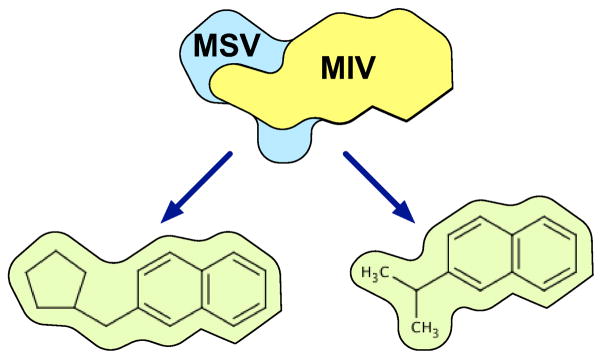
An illustration of a GSS-tree node with two leaves. The union of the molecular shapes in the leaves forms the Maximum Surrounding Volume (MSV), while their intersection forms the Minimum Included Volume (MIV).
If the goal is to identify the k most similar molecular shapes in the database to the reference ligand L, and k shapes have already been identified with a similarity greater than δmax, there is no need to continue to traverse the GSS-tree below this point. Similarly, if the goal is to identify all molecular shapes in the database that are more similar than some threshold, t, to the reference ligand, then the search through the GSS-tree can be pruned if δmax < t.
The MIV and MSV are particularly useful in determining if all the shapes beneath a node are capable of matching the specified shape constraints: the MIV must be fully contained within the maximum shape constraint while the minimum shape constraint must be fully contained within the MSV. If a node high in the tree fails to match the specified shape constraints, a large fraction of the molecular shapes in the database can be eliminated as a result of a single comparison.
Virtual Screening Evaluation
We evaluate the virtual screening performance of VAMS relative to a feature vector approach (USR) and an alignment approach (ROCS). Although we are primarily interested in evaluating algorithms based purely on molecular shape, we also evaluate the effect of including pharmacophoric color information. We use the enhanced database of useful decoys (DUD-E)34 which consists of a diverse set of 102 protein targets, each with a reference ligand-receptor complex. Each target has an average of 224 active ligands and for each active ligand there are approximately 50 physico-chemically matched decoy ligands.
Database Creation
For each target in the DUD-E dataset we generated three-dimensional conformations from the two-dimensional SMILES of the benchmark ligands. OpenEye omega235,36 version 2.4.6 was used with the options -maxconfs 25 -strict false to generate a maximum of 25 conformers for each ligand. These conformations were then all aligned to their moments of inertia and stored in an sdf.gz file. The same set of aligned conformations were used as input for creating the shape databases for each of the methods. In addition to the benchmark ligands, we also align the reference ligand to its moments of inertia and transform the reference receptor into the same coordinate system.
USR
We used the Ultrafast Shape Recognition with CREDO Atom Types (USRCAT) library (version 23:2aa77f970c2c from https://bitbucket.org/aschreyer/usrcat) in conjunction with a Python script (included in Supplemental Materials) to generate USR descriptors. Computed descriptors for each set of ligands were stored in a compact binary Python cPickle file for efficient retrieval. All 60 of the USRCAT descriptors were computed and stored with the ligand name. As an example of the time required to generate a database, ligand descriptors for the AmpC target (117,943 shapes) were be generated in 218 seconds.
ROCS
OpenEye ROCS17,37 version 3.2.04 and the makerocsdb utility were used to convert the input conformations into rocsdb format. Shape databases are created as single conformer databases with the -scdbase option so that the molecular shape of each conformer is treated identically and so that we can get results per a conformer instead of per a molecule. Generating the rocsdb database for the AmpC target took 58 seconds.
VAMS
VAMS shape databases were created with developmental versions of ShapeDB (https://github.com/dkoe using the default options (including a 0.5Å voxel resolution and a maximum grid dimension of 64Å). OpenBabel38 is used to process molecular file formats. Generating the VAMS database for the AmpC target took 946 seconds, of which 707 seconds were spent computing the molecular surface and voxelizing the molecular shapes.
Screening Methodology
We use only the single reference ligand in its bound conformation as the basis for similarity search queries. Unless stated otherwise, we assess virtual screening performance on a molecule, not conformer level. That is, although we rank and score every conformer in a shape database, we ultimately only consider the best ranked conformer of each molecule. Retrieval performance is reported in terms of the area under the curve (AUC) of the receiver operating characteristic (ROC) curve where a value of 0.5 corresponds to random performance and a value of 1.0 corresponds to perfect performance.
All timing results are for single-threaded execution on a 3.4Ghz Intel Core i7-4930 desktop with 32GB of RAM running Ubuntu 12.0.4.4. When performing timing measurements we minimize the amount of produced output to eliminate differences in the handling of molecular data. Performance measurements are the average of the best three wall-clock times out of four trials. Dropping the worst measurement eliminates the effect of disk I/O, which is reasonable since in all cases the shape database is small enough to fit in memory. Observed measurement error was negligible and is not reported. For USR and VAMS, we instrument the code to measure only the search time to eliminate differences in query initialization and setup. For ROCS we use the Linux time utility, but due to the time scales involved for ROCS search, any additional non-search related overhead can be safely ignored.
USR
USR screening is performed with a custom Python script (provided in the Supplementary Materials) that uses the optimized numpy library to compute similarities between USR descriptors. The similarity, S, between two USR vectors, a and b, of length n is:
When performing shape-only matching, only the first 12 of the 60 USRCAT descriptors are considered. The full set of descriptors is used when pharmacophoric color information is desired.
ROCS
We perform ROCS screens with (default) and without (-opt false) pose optimization and with (default) and without (-shapeonly) color information. Standard ROCS optimizes the pose of the database molecular shapes to maximize overlap with the query shape. The optimization function can either maximize shape overlap or, by default, it maximizes an equally weighted combination of a shape score and a color score to include a notion of chemical similarity. For timing purposes, all screens were performed with -nostructs -besthits 0 so that ROCS would evaluate every shape in the database but would not output molecular data.
VAMS
In addition to evaluating the performance of VAMS at ranking the entire database with its voxel-based Tanimoto of aligned shapes, we consider various methods of indexed search. The goal of these methods is to use the GSS-tree indexing structure to identify an enriched subset of the database without examining every shape in the database. Ideally, they would scale sub-linearly in the size of the database to enable the searching of huge databases on an interactive time scale.
We evaluate k nearest neighbors search, similarity threshold search, and shape constraint search. In k nearest neighbors, only the k shapes closest to the reference shape are returned. In similarity threshold search, only those shapes within a specified similarity threshold, t, are return. In shape constraint search, only those shapes that exactly match the specified shape constraints are returned. For these methods we evaluate the enrichment and size of the returned subset.
RESULTS
Shape Comparison Performance
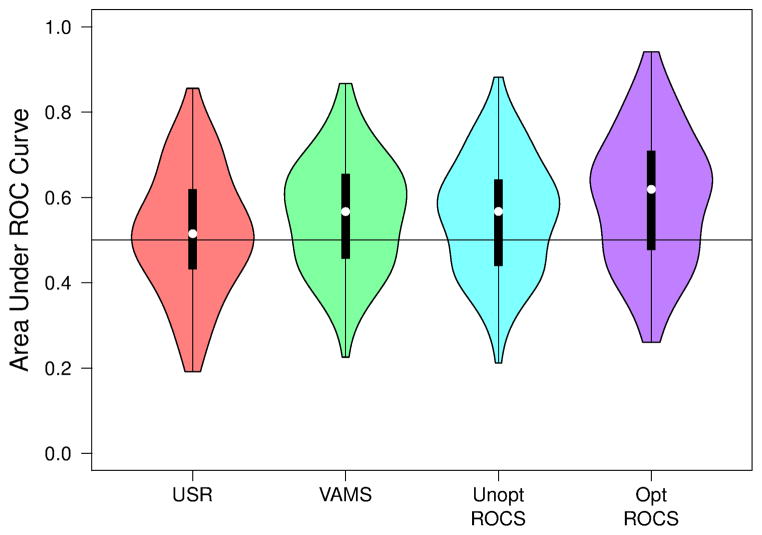
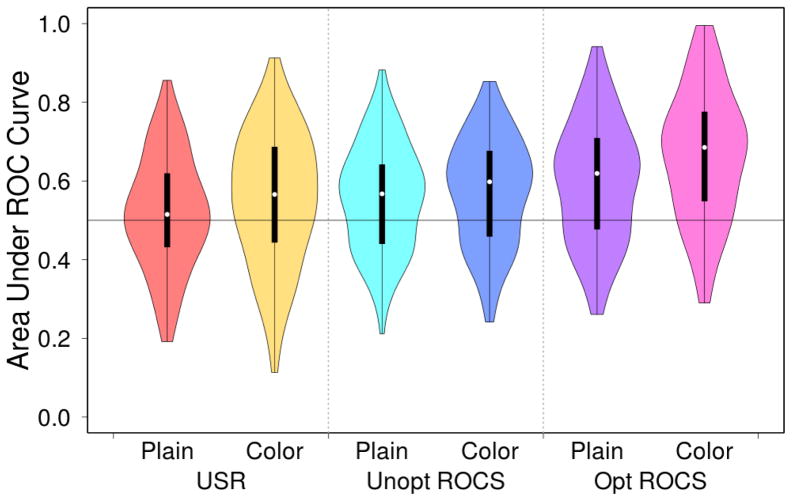
The overall virtual screening performance of the various shape-based methods as measured by AUC across the DUD-E benchmark is shown in Figure 5. ROC curves for selected methods are shown in Figure S1. USR has an average AUC of 0.520. Although this is not significantly different from 0.5 (the one sample t-test p-value is 0.15), this does not mean that the performance of USR is random. A random ranking of compounds would have a substantially narrower variance. However, for the DUD-E benchmark USR is equally likely to perform poorly as to perform well.
Figure 5.
The distribution of the area under the curve (AUC) of the receiver operating characteristic (ROC) curves of various shape-based virtual screening algorithms when applied to all 102 targets in the DUD-E benchmark. An AUC of 0.5 indicates random performance while an AUC of 1.0 indicates a perfect ranking of active ligands. Violin plots show the median value (dot), the range between the first and third quartile (solid block line), and the kernel density from the minimum to maximum values (shaded area).
VAMS and unoptimized ROCS have similar AUC distributions (R = 0.92) with an average AUC of 0.560 for VAMS and 0.557 for unoptimized ROCS. Both averages are significantly different from 0.5 (the one sample t-test p-value is less than 0.0001) although their difference is not significant (the two sample t-test p-value is 0.89). This is expected since although they use different methods (voxel overlap vs. Gaussian overlap), they calculate the same value: the shape Tanimoto of the aligned shapes. The best overall performance, with an average AUC of 0.596, is obtained by optimizing alignments for ROCS shape overlap, although this improvement has marginal significance compared to VAMS (p = 0.068). Similar trends in overall virtual screening performance are observed when measures of early enrichment, such as BEDROC39 and partial AUC40, are considered. Complete results for every target for a variety of metrics are provided in Tables S1, S2, and S3.
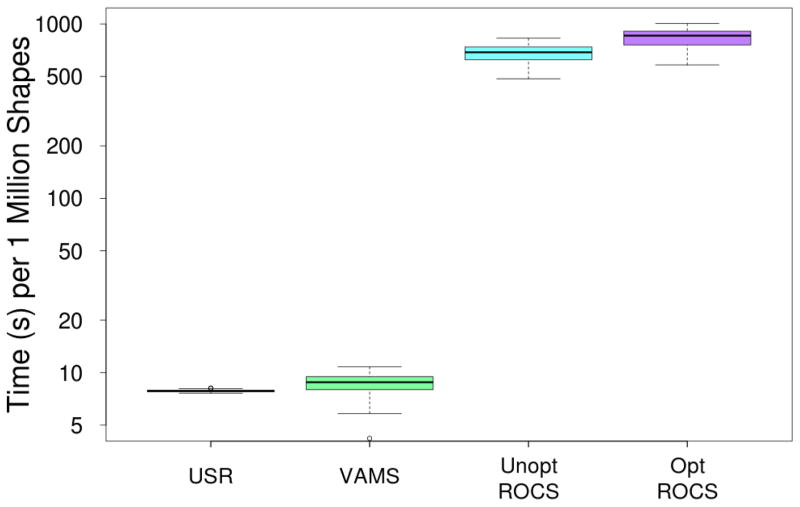
Although its virtual screening performance isn’t as good, the benefit of VAMS relative to optimized ROCS is illustrated in Figure 6 which shows the run-time performance of the various algorithms. The ROCS algorithms are nearly two orders of magnitude slower than VAMS and USR. The performance of ROCS and VAMS depends both on the number of molecules and the shapes of the molecules, resulting in a higher variance in run-times than USR which reduces all molecular shapes to a fixed length vector of twelve numbers. It should be noted that the run-time performance results for USR are not consistent with previous reports24 where USR was reported to process 5 million shapes a second. This discrepancy is likely due to our use of the freely available Python USRCAT implementation, instead of an optimized compiled implementation. Such an implementation would likely improve run-time performance by at least an order of magnitude, so it is reasonable to view VAMS as existing midway in the run-time performance spectrum between USR and ROCS. Additionally, we note that GPU-optimized versions of the ROCS algorithm perform one to two orders of magnitude better21 resulting in performance comparable to VAMS. However, given the natural course and fine-grained parallelism inherent in the VAMS algorithms, we anticipate that a GPU-optimized version of VAMS would compare as favorably (if not more so) to GPU-optimized ROCS as the CPU-optimized versions evaluated here.
Figure 6.
The average time spent per one million shapes for various methods of shape comparison. Values are averaged across the 102 targets of the DUD-E benchmark. Times are plotted on a log scale, and there is an almost two orders of magnitude difference between the fastest and slowest methods.
Accelerated Virtual Screening
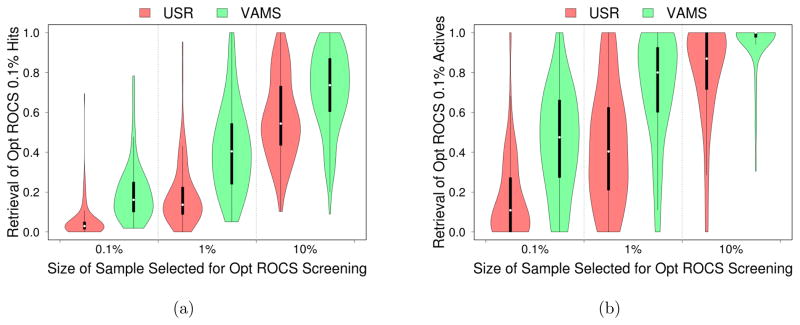
Typically, only the top hits of a virtual screen are of interest. The superior run-time performance of USR and VAMS suggest that they may serve as a useful pre-filter for databases before performing more time consuming screening with optimized ROCS. In this hybrid approach, the full database is screened by one of the fast methods, and only the top X% conformations identified are subject to screening by ROCS. In Figure 7 we compare the retrieval of top conformations by this hybrid method to screening the full database with optimized ROCS across the DUD-E benchmark. We compare all the conformations identified in the top 0.1% of the hybrid and ROCS screens in Figure 7(a). For example, if optimized ROCS is used to screen the top 10% of conformations identified by VAMS, then, for the majority of targets, more than 70% of the compounds identified as ranking in the top 0.1% of the entire database will be identical with those identified in the top 0.1% by an optimized ROCS screen of the full database. More significantly, if only the retrieval of conformations of active compounds is measured, as shown in Figure 7(b), then in the same scenario the exact same set of active conformations is identified for 68% of the targets. That is, for these targets the hybrid approach using VAMS would identify exactly the same active compounds in the top 0.1% as a full optimized ROCS screen in about a tenth the time.
Figure 7.
Distribution of retrieval rates of the top optimized ROCS (a) virtual hits and (b) actives if faster methods of shape comparison are first used to produce a smaller library. Only the top 0.1%, 1%, and 10% of hits as ranked by USR and VAMS are screened with optimized ROCS. The top 0.1% of hits identified by this hybrid method are compared to the top 0.1% of hits identified by a full, more time-consuming, optimized ROCS screen. The fraction of (a) molecular conformations and (b) active compounds (regardless of conformation) identified by the hybrid screen in this top 0.1% set that are identical to those ranked in the top 0.1% by the full screen is shown. A value of one indicates that the hybrid approach identifies an identical set of top hits to a full screen while a value of zero means that the hybrid approach identified none of the top hits from a full optimized ROCS screen. When measuring retrieval of the conformations of active compounds in this top 0.1%, five benchmarks are omitted since optimized ROCS did not rank any actives this highly. VAMS generally needs to select a set a tenth the size as the USR method to produce equivalent enriched subsets for ROCS screening. Violin plots show the median value (dot), the range between the first and third quartile (solid block line), and the kernel density from the minimum to maximum values (shaded area).
In general, USR is less effective at identifying an enriched subset for ROCS screening. In order to achieve similar retrieval rates to VAMS, approximately ten times as many conformations must be selected by USR, resulting in a ten-fold increase in ROCS screening time and limiting the usefulness of USR as an accelerator of shape-based virtual screening.
Indexed Shape Matching
A key advantage of VAMS is its ability to use the GSS-tree data structure to perform index-based searches, instead of linear scans, of shape databases. Index-based searches have the potential to scale sub-linearly with the size of the database and enable the screening of huge databases on an interactive time scale. Index-based searches necessarily return a subset of the database as a result as opposed to a full ranking. In order to quantify the quality and usefulness of an identified subset, we compute the enrichment factor (EF), true positive rate (TPR) and F1 score. The enrichment factor is the ratio of the percentage of actives in the subset relative to the percentage of actives in the original database. The true positive rate, also known as sensitivity or recall, is the percentage of active ligands in the full database that are contained in the subset. The F1 score is the harmonic mean of the precision and the TPR where precision is the percent of active ligands in the returned subset. In all cases, values are calculated after selecting only the best scoring conformation for each molecule from the subset. That is, they are evaluated in terms of ligands, not conformations.
Similarity Search
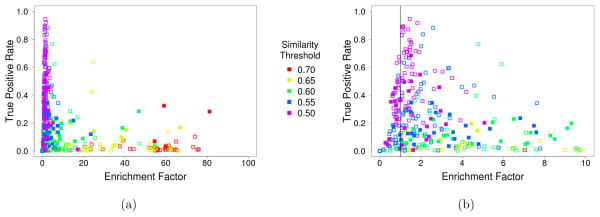
Figure 8 shows the enrichment factor relative to the true positive rate for the results of searching the DUD-E targets using a variety of similarity thresholds. Generally, a higher similarity threshold results in higher enrichment factors, but at the expense of a lower TPR. For each target, the result for the similarity threshold with the best F1 score is shown as solid in Figure 8. This shows the distribution of values across targets. The majority of targets (67) exhibit the best F1 score with a low similarity threshold (0.5 or 0.55) and display a modest enrichment (median EF of 1.7).
Figure 8.
The enrichment factor and true positive rate (sensitivity) for various VAMS similarity threshold searches across the 102 targets of the DUD-E benchmark. Both the (a) full results and (b) a magnification of the lower enrichment factor region are shown. Solid marks correspond to the similarity threshold search that had the highest F1 score for a given target. Enrichment factors greater than one indicate better than random performance.
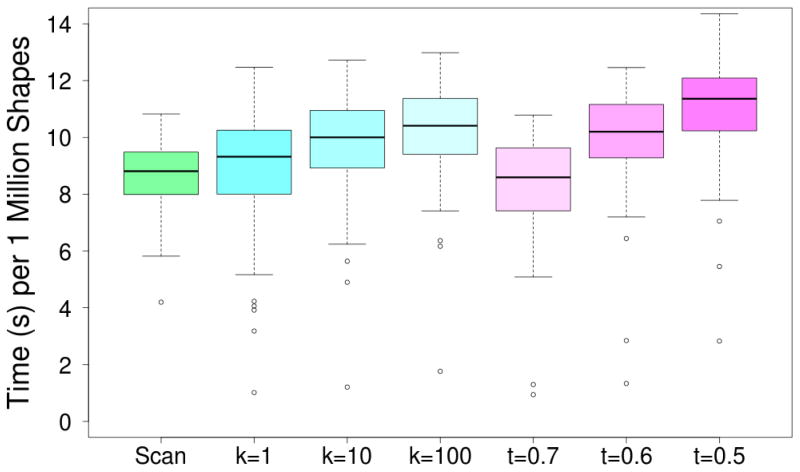
However, the utility of these low similarity searches, and of k nearest neighbor searches, is questionable. As shown in Figure 9, only the most restrictive of similarity thresholds, t = 0.7, provides an improvement in average run-time performance relative to a linear scan. This is consistent with the nature of the GSS-tree index. A similarity threshold will only effectively prune the lower levels of the tree, since the MSV of nodes higher in the tree will tend to produce a δmax near one. In k nearest neighbor search, the similarity threshold is dynamically updated as the tree is searched, resulting in even more tree traversal. Consequently, on average these searches do not perform as well as simply scanning the full database, although, as indicated by the outliers in Figure 9, there are exceptions.
Figure 9.
The average time spent per one million shapes when using different methods for searching volumetric shapes across the DUD-E targets. Although in theory indexing approaches can speed up k-nearest neighbor and similarity threshold (t) searches, in practice only the narrowest of queries provide a performance improvement over simple linear scan.
Shape Constraints
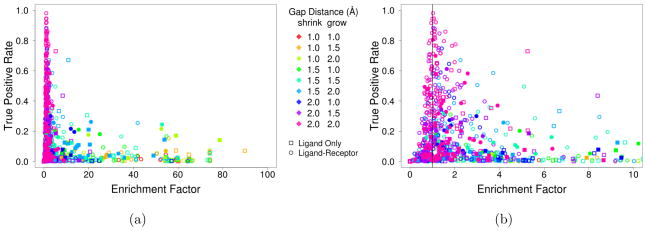
Figure 10 shows the enrichment factor relative to the true positive rate for the results of searching the DUD-E targets using a variety of shape constraint searches. We consider both shape constraints generated from only the ligand, as in Figure 2, and using both ligand and receptor information, as in Figure 3. Generally, larger gap distances result in higher enrichment factors, but at the expense of a lower TPR. For each target, the result with the best F1 score is shown as solid in Figure 10. For the majority of targets (77), the best F1 score is achieved using ligand-receptor shape constraints. About a quarter of the targets (25) have the best F1 score with the maximum (2.0Å) gap distances and these queries exhibit a modest enrichment (median EF of 1.3). However, as shown in detail in Table S4, the majority of targets (70%) demonstrate a statistically significant enrichment (p < 0.05 before Bonferroni correction for multiple testing).
Figure 10.
The enrichment factor and true positive rate (sensitivity) for various shape constraint searches across the 102 targets of the DUD-E benchmark. Both the (a) full results and (b) a magnification of the lower enrichment factor region are shown. All possible shape constraints using just the ligand (see Figure 2) and both the ligand and receptor shapes (see Figure 3) with gap sizes of 1, 1.5, and 2 Å for the minimum and maximum constraints were considered. Solid marks correspond to the shape constraint search that had the highest F1 score for a given target. Enrichment factors greater than one indicate better than random performance.
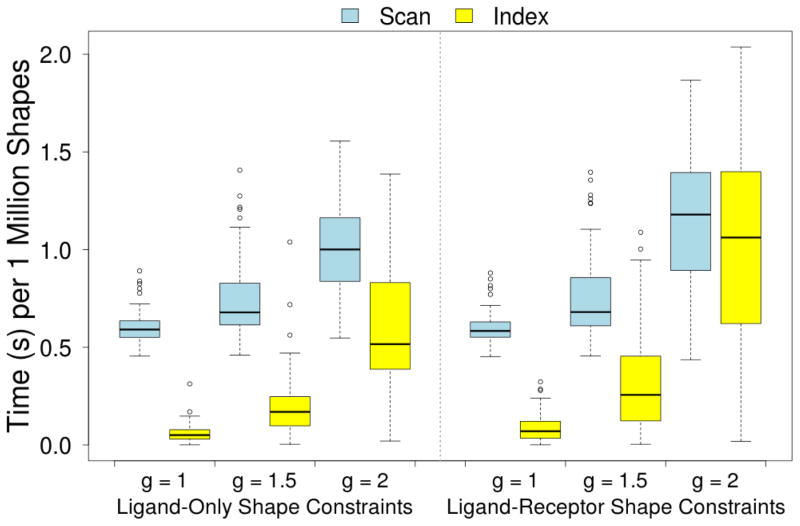
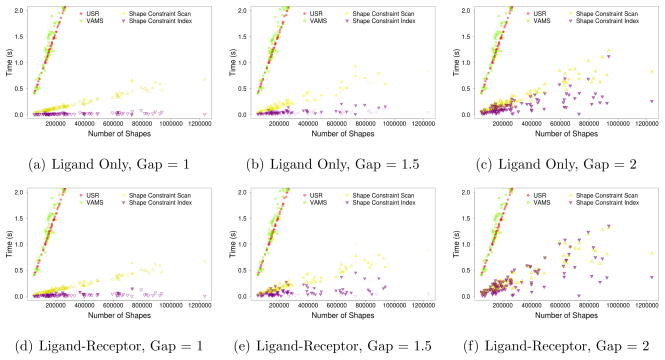
Unlike similarity searches, shape constraints can effectively prune the GSS-tree search high in the tree since only a single voxel needs to be in violation of the constraints to eliminate an entire branch of the search tree from consideration. Additionally, shape constraint calculations are more efficient than similarity calculations since the calculation is short-circuited as soon as a voxel violation is identified. Consequently, as shown in Figure 11, linear scans for shape constraint matching typically take less than a second per a million shapes, and the average run-time performance of indexed shape constraint matching is significantly faster.
Figure 11.
The average time spent per one million shapes when using shape constraints to search the DUD-E benchmark using linear scan, where every ligand is evaluated, and an indexing method, where a search tree is used to limit the search.
More important than average run-time performance is the scalability of indexed shape constraint matching as a function of the size of the search database. This is shown in Figure 12. Very specific queries with small gap distances exhibit nearly constant time performance. Since the search time must necessarily scale with the size of the output, as queries get more permissive, the performance approaches that of a linear scan. The effect is particularly noticeable for ligand-receptor constraints with a gap size of 2Å. These constraints return more than 50% of the database for more than 20% of the targets.
Figure 12.
Performance scaling of shape constraint search. Total search time is shown relative to the size of the shape database for each of the 102 DUD-E targets. (a–c) Ligand only shape constraints and (d–f) ligand-receptor shape constraints for a variety of gap sizes are shown. Solid marks indicate cases where there was at least one match to the shape constraint query. Empirically, highly specific queries scale sub-linearly with hitless queries demonstrating nearly constant performance with respect to database size.
Beyond Shape
Both ROCS and USR have been extended to include pharmacophoric color information that annotates purely steric information with information about the chemical properties of the ligand. As shown in Figure 13, the addition of this color information results in a significant improvement in virtual screening performance for both USR and ROCS. Interestingly, no significant change in performance is observed for unoptimized ROCS. This indicates that adding color directly to VAMS is unlikely to be beneficial since it uses the same set of pre-aligned shapes and unoptimized ROCS.
Figure 13.
The distribution of the area under the curve (AUC) of various shape-based virtual screening algorithms with and without pharmacophoric color information when applied to all 102 targets in the DUD-E benchmark. Violin plots show the median value (dot), the range between the first and third quartile (solid block line), and the kernel density from the minimum to maximum values (shaded area).
Since optimized ROCS with color information demonstrates the best virtual screening performance, we investigate the ability of USR and VAMS to accelerate ROCS screening with color in Figure 14. Although the retrieval rates are slightly below that of shape-only screening (Figure 7) due to the different objective functions being optimized, VAMS still identifies the vast majority of top actives for most benchmarks when used to reduce the size of the ROCS screen by a tenth. Interestingly, even with the addition of color information, USR is still not competitive with VAMS at identifying an enriched subset.
Figure 14.
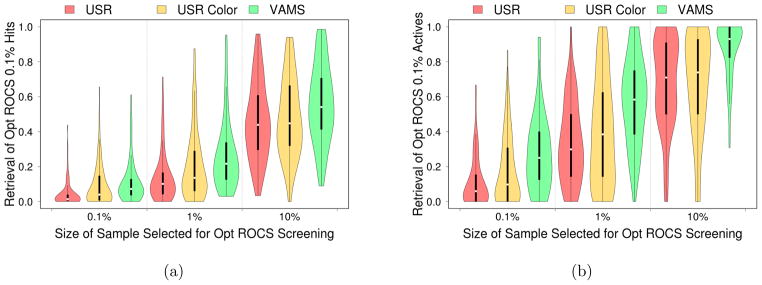
Distribution of retrieval rates of the top color-optimized ROCS (a) hits and (b) actives if faster methods of shape comparison are first used to produce a smaller library. The ability of these methods to retrieve the identical molecular conformations ranked in the top 0.1% for each benchmark is measured. When measuring retrieval of the conformations of active compounds in this top 0.1%, one benchmark is omitted since color-optimized ROCS did not rank any actives this highly. Despite lacking color information, VAMS produces better retrieval rates than USR with color information. Violin plots show the median value (dot), the range between the first and third quartile (solid block line), and the kernel density from the minimum to maximum values (shaded area).
DISCUSSION
We have shown that the VAMS approach to shape-based virtual screening can approach the effectiveness of an optimizing shape-alignment method such as ROCS, while simultaneously demonstrating run-time performance close to the fastest feature-vector approaches, such as USR. These properties of VAMS make it useful both as a standalone approach to virtual screening and as a pre-filter for accelerating screening a large database with more computationally demanding approaches.
VAMS is uniquely dependent on the method for pre-aligning molecular shapes. Alternative methods of alignment or of exploring alternative alignments might improve the performance of VAMS. For example, compounds could be aligned around a privileged scaffoled41,42 or, more generally, alignment algorithms could include information about pharmacophores or functional groups (color). Alternatively, pharmacophoric similarity could be computed separately from VAMS and combined in a consensus score.
Perhaps the most intriguing aspect of VAMS is its support for efficient shape constraint search. Shape constraints are a novel query format for identifying molecular shapes of interest that allow the user to essential sculpt the desired shape. Although we have evaluated shape constraints using constraints automatically determined from the ligand and receptor structures, shape constraints are more likely to be useful when defined by an expert user. The run-time performance of shape constraint search in VAMS would allow a user to define such shape constraints iteratively and interactively while searching a full sized database of molecular shapes.
Supplementary Material
Acknowledgments
This work was supported by the National Institute of Health [R01GM097082, R01GM108340].
Footnotes
The content is solely the responsibility of the authors and does not necessarily represent the official views of the National Institute of General Medical Sciences or the National Institutes of Health.
References
- 1.Nicholls A, McGaughey GB, Sheridan RP, Good AC, Warren G, Mathieu M, Muchmore SW, Brown SP, Grant JA, Haigh JA. J Med Chem. 2010;53:3862. doi: 10.1021/jm900818s. [DOI] [PMC free article] [PubMed] [Google Scholar]
- 2.Rush TS, III, Grant JA, Mosyak L, Nicholls A. J Med Chem. 2005;48:1489. doi: 10.1021/jm040163o. [DOI] [PubMed] [Google Scholar]
- 3.McMasters DR, Garcia-Calvo M, Maiorov V, McCann ME, Meurer RD, Bull HG, Lisnock JM, Howell KL, DeVita RJ. Bioorganic & medicinal chemistry letters. 2009;19:2965. doi: 10.1016/j.bmcl.2009.04.031. [DOI] [PubMed] [Google Scholar]
- 4.Muchmore SW, Souers AJ, Akritopoulou-Zanze I. Chemical biology & drug design. 2006;67:174. doi: 10.1111/j.1747-0285.2006.00341.x. [DOI] [PubMed] [Google Scholar]
- 5.Ballester PJ, Westwood I, Laurieri N, Sim E, Richards WG. Journal of The Royal Society Interface. 2010;7:335. doi: 10.1098/rsif.2009.0170. [DOI] [PMC free article] [PubMed] [Google Scholar]
- 6.Ballester PJ, Mangold M, Howard NI, Robinson RLM, Abell C, Blumberger J, Mitchell JB. Journal of The Royal Society Interface. 2012;9:3196. doi: 10.1098/rsif.2012.0569. [DOI] [PMC free article] [PubMed] [Google Scholar]
- 7.Temml V, Voss CV, Dirsch VM, Schuster D. Journal of Chemical Information and Modeling. 2014;54:367. doi: 10.1021/ci400682b. http://pubs.acs.org/doi/pdf/10.1021/ci400682b, URL http://pubs.acs.org/doi/abs/10.1021/ci400682b. [DOI] [PMC free article] [PubMed] [Google Scholar]
- 8.Ebalunode JO, Ouyang Z, Liang J, Zheng W. J Chem Inf Model. 2008;48:889. doi: 10.1021/ci700368p. [DOI] [PubMed] [Google Scholar]
- 9.Vainio MJ, Puranen JS, Johnson MS. Journal of chemical information and modeling. 2009;49:492. doi: 10.1021/ci800315d. [DOI] [PubMed] [Google Scholar]
- 10.Cheeseright T, Mackey M, Rose S, Vinter A. Journal of chemical information and modeling. 2006;46:665. doi: 10.1021/ci050357s. [DOI] [PubMed] [Google Scholar]
- 11.Thorner DA, Wild DJ, Willett P, Wright PM. J Chem Inf Comput Sci. 1996;36:900. doi: 10.1021/ci960002w. [DOI] [Google Scholar]
- 12.Tervo AJ, Rönkkö T, Nyrönen TH, Poso A. Journal of medicinal chemistry. 2005;48:4076. doi: 10.1021/jm049123a. [DOI] [PubMed] [Google Scholar]
- 13.Maŕin RM, Aguirre NF, Daza EE. Journal of chemical information and modeling. 2008;48:109. doi: 10.1021/ci7001878. [DOI] [PubMed] [Google Scholar]
- 14.Sastry M, Dixon S, Sherman W. J Chem Inf Model. 2011 doi: 10.1021/ci2002704. [DOI] [PubMed] [Google Scholar]
- 15.Good AC, Richards WG. J Chem Inf Model. 1993;33:112. [Google Scholar]
- 16.Grant JA, Gallardo MA, Pickup BT. Journal of Computational Chemistry. 1996;17:1653. [Google Scholar]
- 17.Hawkins PCD, Skillman AG, Nicholls A. Journal of Medicinal Chemistry. 2007;50:74. doi: 10.1021/jm0603365. http://pubs.acs.org/doi/pdf/10.1021/jm0603365, URL http://pubs.acs.org/doi/abs/10.1021/jm0603365. [DOI] [PubMed] [Google Scholar]
- 18.Nettles JH, Jenkins JL, Williams C, Clark AM, Bender A, Deng Z, Davies JW, Glick M. Journal of Molecular Graphics and Modelling. 2007;26:622. doi: 10.1016/j.jmgm.2007.02.005. URL http://www.sciencedirect.com/science/article/B6TGP-4N5CXNK-1/2/24c67518e92425c79de6c. [DOI] [PubMed] [Google Scholar]
- 19.Proschak E, Rupp M, Derksen S, Schneider G. Journal of Computational Chemistry. 2008;29:108. doi: 10.1002/jcc.20770. [DOI] [PubMed] [Google Scholar]
- 20.Fontaine F, Bolton E, Borodina Y, Bryant SH. Chemistry Central Journal. 2007;1:12. doi: 10.1186/1752-153X-1-12. [DOI] [PMC free article] [PubMed] [Google Scholar]
- 21.Haque IS, Pande VS. Journal of Computational Chemistry. 2010;31:117. doi: 10.1002/jcc.21307. URL http://dx.doi.org/10.1002/jcc.21307. [DOI] [PubMed] [Google Scholar]
- 22.Haigh JA, Pickup BT, Grant JA, Nicholls A. J Chem Inf Model. 2005;45:673. doi: 10.1021/ci049651v. [DOI] [PubMed] [Google Scholar]
- 23.Putta S, Lemmen C, Beroza P, Greene J. J Chem Inf Comput Sci. 2002;42:1230. doi: 10.1021/ci0255026. [DOI] [PubMed] [Google Scholar]
- 24.Ballester PJ, Richards WG. J Comp Chem. 2007;28:1711. doi: 10.1002/jcc.20681. [DOI] [PubMed] [Google Scholar]
- 25.Schreyer AM, Blundell T. Journal of cheminformatics. 2012;4:1. doi: 10.1186/1758-2946-4-27. [DOI] [PMC free article] [PubMed] [Google Scholar]
- 26.Zauhar RJ, Moyna G, Tian LF, Li ZJ, Welsh WJ. J Med Chem. 2003;46:5674. doi: 10.1021/jm030242k. [DOI] [PubMed] [Google Scholar]
- 27.Keim DA. Proc of the Intl Conf on Management of Data. ACM; New York, NY, USA: 1999. pp. 419–430. URL http://doi.acm.org/10.1145/304182.304219. [Google Scholar]
- 28.Koes D, Camacho C. Knowledge and Information Systems. 2014:1–24. doi: 10.1007/s10115-014-0729-z. URL http://dx.doi.org/10.1007/s10115-014-0729-z. [DOI] [PMC free article] [PubMed]
- 29.The PyMOL Molecular Graphics System, Version 1.5.0.1. Schrödinger, LLC; 2010. http://www.pymol.org/ [Google Scholar]
- 30.sproxel. sproxel, r173. http://code.google.com/p/sproxel/
- 31.Meagher D. Computer Graphics and Image Processing. 1982;19:129. [Google Scholar]
- 32.Samet H. Foundations of multidimensional and metric data structures. Morgan Kaufmann; 2006. [Google Scholar]
- 33.Humphrey W, Dalke A, Schulten K. Journal of Molecular Graphics. 1996;14:33. doi: 10.1016/0263-7855(96)00018-5. [DOI] [PubMed] [Google Scholar]
- 34.Mysinger MM, Carchia M, Irwin JJ, Shoichet BK. J Med Chem. 2012;55:6582. doi: 10.1021/jm300687e. [DOI] [PMC free article] [PubMed] [Google Scholar]
- 35.Omega, version 2.4.6. OpenEye Scientific Software Inc; Santa Fe, New Mexico: 2012. [Google Scholar]
- 36.Hawkins PCD, Skillman AG, Warren GL, Ellingson BA, Stahl MT. Journal of Chemical Information and Modeling. 2010;50:572. doi: 10.1021/ci100031x. http://pubs.acs.org/doi/pdf/10.1021/ci100031x, URL http://pubs.acs.org/doi/abs/10.1021/ci100031x. [DOI] [PMC free article] [PubMed] [Google Scholar]
- 37.ROCS, version 3.2.04. OpenEye Scientific Software Inc; Santa Fe, New Mexico: 2014. [Google Scholar]
- 38.O’Boyle NM, Banck M, James CA, Morley C, Vandermeersch T, Hutchison GR. Journal of Cheminformatics. 2011;3:33. doi: 10.1186/1758-2946-3-33. [DOI] [PMC free article] [PubMed] [Google Scholar]
- 39.Truchon JF, Bayly CI. Journal of Chemical Information and Modeling. 2007;47:488. doi: 10.1021/ci600426e. http://pubs.acs.org/doi/pdf/10.1021/ci600426e, URL http://pubs.acs.org/doi/abs/10.1021/ci600426e. [DOI] [PubMed] [Google Scholar]
- 40.Robin X, Turck N, Hainard A, Tiberti N, Lisacek F, Sanchez JC, Müller M. BMC bioinformatics. 2011;12:77. doi: 10.1186/1471-2105-12-77. [DOI] [PMC free article] [PubMed] [Google Scholar]
- 41.Welsch ME, Snyder SA, Stockwell BR. Current Opinion in Chemical Biology. 2010;14:347. doi: 10.1016/j.cbpa.2010.02.018. molecular Diversity, URL http://www.sciencedirect.com/science/article/pii/S1367593110000232. [DOI] [PMC free article] [PubMed] [Google Scholar]
- 42.Koes D, Khoury K, Huang Y, Wang W, Bista M, Popowicz GM, Wolf S, Holak TA, Dömling A, Camacho CJ. PLoS ONE. 2012;7:e32839 EP. doi: 10.1371/journal.pone.0032839. [DOI] [PMC free article] [PubMed] [Google Scholar]
- 43.Swamidass SJ, Azencott CA, Daily K, Baldi P. Bioinformatics. 2010;26:1348. doi: 10.1093/bioinformatics/btq140. http://bioinformatics.oxfordjournals.org/content/26/10/1348.full.pdf+html, URL http://bioinformatics.oxfordjournals.org/content/26/10/1348.abstract. [DOI] [PMC free article] [PubMed] [Google Scholar]
Associated Data
This section collects any data citations, data availability statements, or supplementary materials included in this article.


