

Abstract
Engagement of the programmed death (PD)−1 receptor on activated cells by its ligand (PD‐L1) is a mechanism for suppression of activated T‐lymphocytes. Microglia, the resident inflammatory cells of the brain, are important for pathogen detection and initiation of innate immunity, however, a novel role for these cells as immune regulators has also emerged. PD‐L1 on microglia has been shown to negatively regulate T‐cell activation in models of multiple sclerosis and acute viral encephalitis. In this study, we investigated the role of glial cell PD‐L1 in controlling encephalitogenic CD8+ T‐lymphocytes, which infiltrate the brain to manage viral infection, but remain to produce chronic neuroinflammation. Using a model of chronic neuroinflammation following murine cytomegalovirus (MCMV)‐induced encephalitis, we found that CD8+ T‐cells persisting within the brain expressed PD‐1. Conversely, activated microglia expressed PD‐L1. In vitro, primary murine microglia, which express low basal levels of PD‐L1, upregulated the co‐inhibitory ligand on IFN‐γ‐treatment. Blockade of the PD‐1: PD‐L1 pathway in microglial: CD8+ T‐cell co‐cultures increased T‐cell IFN‐γ and interleukin (IL)−2 production. We observed a similar phenomenon following blockade of this co‐inhibitory pathway in astrocyte: CD8+ T‐cell co‐cultures. Using ex vivo cultures of brain leukocytes, including microglia and CD8+ T‐cells, obtained from mice with MCMV‐induced chronic neuroinflammation, we found that neutralization of either PD‐1 or PD‐L1 increased IFN‐γ production from virus‐specific CD8+ T‐cells stimulated with MCMV IE1168–176 peptide. These data demonstrate that microglia and astrocytes control antiviral T‐cell responses and suggest a therapeutic potential of PD1: PD‐L1 modulation to manage the deleterious consequences of uncontrolled neuroinflammation. GLIA 2014;62:1582–1594
Keywords: microglia, astrocyte, neuroinflammation, encephalitis, major histocompatibility complex Class II, immune suppression
Main Points
Microglia and astrocytes exert regulatory control over T‐cells during chronic neuroinflammation following viral brain infection.
Post-encephalitic glial cells express PD‐L1 and suppress persistent CD8 T‐cells via the PD‐1: PD‐L1 inhibitory pathway.
Introduction
The immune response against central nervous system (CNS) infection requires a delicate balance between efficient pathogen clearance and the preservation of sensitive, nonrenewable neural cells. It is becoming evident that following CNS insult and acute inflammation, the brain does not return to its preinfection state; animal models of neurodegenerative disease, multiple sclerosis, stroke, and brain infection each show prolonged activation of resident microglia and sustained presence of memory T‐cells. Overactive and persistent immune activation within the brain can be detrimental to sensitive neuronal cells resulting in focal neuropathology and, correspondingly, memory deficits (Armien et al., 2010). Thus, suppression of persistent brain inflammation is critical to limiting bystander tissue damage and preserving neurological function.
Microglia are the resident immune cells of the brain and have been traditionally thought to be proinflammatory. Recent studies, however, suggest they play additional roles as immune regulators. Microglia limit CNS pathology by suppressing proinflammatory cytokine production from brain‐infiltrating T‐cells through activation of the programmed death receptor‐1 (PD‐1): programmed death ligand‐1 (PD‐L1) pathway. PD‐L1 (CD274, B7‐H1), a co‐inhibitory molecule expressed on antigen presenting cells, which plays a crucial role in the functional suppression of T‐cell responses (Latchman et al., 2004). Engagement of PD‐1 on activated CD4+ and CD8+ T‐cells by PD‐L1 has been shown as a mechanism for suppression of T‐cell function, commonly referred to as T‐cell exhaustion. In the absence of PD‐L1 (PD‐L1−/− mice), coronavirus infection of the brain resulted in a heightened inflammatory response, ultimately leading to the more rapid clearance of virus from the CNS (Phares et al., 2013). This comes at a cost however, PD‐L1−/− mice exhibited quicker onset of clinical symptoms and a higher rate of mortality, demonstrating the importance of this pathway in negatively regulating neuroinflammation in the brain. PD‐L1 expression on microglia, as well as on astrocytes and oligodendrocytes, has been shown to decrease T‐cell activation in models of multiple sclerosis, as well as during acute viral encephalitis (Duncan and Miller, 2011; Magnus et al., 2005; Phares et al., 2009). However, little is known about the immunoregulatory role of microglia during chronic, persistent neuroinflammation in animals that recover from viral brain infection.
Human cytomegalovirus (CMV) brain infection is the most significant cause of neurological disorders related to intrauterine infection in humans and is also a major cause of encephalitis during acquired immunodeficiency syndrome (Cheeran et al., 2009a). Using a mouse model of murine (M) CMV infection, we have previously shown that, in the aftermath of a nonlethal acute viral infection, the CNS is maintained in a state of chronic neuroinflammation. Sustained immune activation within the brain is a key feature of herpesvirus pathogenicity (Armien et al., 2010), along with the establishment of latency after clearance of acute infection and the potential for virus reactivation (Fields, 2007). Prolonged immune responses within the brain following MCMV infection are characterized by persistence of antibody‐producing B‐cells, chronic microglial cell activation, and retention of MCMV‐specific effector‐memory CD8+ T‐cells (Mutnal et al., 2011b; Mutnal et al., 2012). Although CD8+ T‐cells play an important role in controlling acute brain infection (Reddehase et al., 1987, 1985), the chronic presence of these IFN‐γ‐producing T‐cells may be damaging to the brain. Although retention of antigen‐specific CD8+ T‐cells following MCMV infection helps to protect against virus reactivation, they are also responsible for long‐term activation of microglia throughout the brain (Mutnal et al., 2011b). Cytotoxic CD8 T‐lymphocytes have been shown responsible for the destruction of healthy bystander neurons in the retina (McPherson et al., 2006). Thus, maintaining CD8+ T‐cells in a functionally suppressed state in the brain may enable both adequate neuroprotection from subsequent infection or reactivation, while also limiting unnecessary bystander neurotoxicity.
In this study, we investigated the role of glial cells in the functional inhibition of persistent CD8+ T‐cells in the postencephalitic brain following MCMV infection. Specifically, we show that PD‐L1, expressed on microglia during chronic neuroinflammation, contributes to the suppression of antiviral CD8+ T‐cell activity. Our data also demonstrate that astrocytes control CD8+ T‐cytokine production through the PD‐1: PD‐L1 pathway.
Materials and Methods
Ethical Statement
This study was carried out in strict accordance with the recommendations in the Guide for the Care and Use of Laboratory Animals of the National Institutes of Health. The protocol was approved by the Institutional Animal Care and Use Committee (Protocol Number: 1105A99494) of the University of Minnesota. All surgery was performed under Ketamine anesthesia, and all efforts were made to minimize suffering.
Virus and Animals
RM461, a MCMV expressing Escherichia coli β‐galactosidase under the control of the human ie1/ie2 promoter/enhancer (Stoddart et al., 1994) was kindly provided by Edward S. Mocarski. The virus was maintained by passage in weanling female Balb/c mice. Salivary gland‐passed virus was then grown in NIH 3T3 cells for two passages, which minimized any carry over of salivary gland tissue. Infected 3T3 cultures were harvested at 80–100% cytopathic effect and subjected to three freeze‐thaw cycles. Cellular debris was removed by centrifugation (1,000g) at 4°C, and the virus was pelleted through a 35% sucrose cushion (in Tris‐buffered saline [50 mM Tris–HCl, 150 mM NaCl, pH 7.4]) at 23,000g for 2 h at 4°C. The pellet was suspended in Tris‐buffered saline containing 10% heat‐inactivated fetal bovine serum (FBS). Viral stock titers were determined on 3T3 cells as 50% tissue culture infective doses (TCID50) per milliliter. Six to eight week old Balb/c mice were obtained from Charles River Laboratories (Wilmington, MA).
Intracerebroventricular Infection of Mice
Infection of mice with MCMV was performed as previously described (Cheeran et al., 2004). Briefly, female mice (6–8 week old) were anesthetized using a combination of Ketamine and Xylazine (20 mg and 2 mg/kg body weight, respectively) and immobilized on a small animal stereotactic instrument equipped with a Cunningham mouse adapter (Stoelting Co., Wood Dale, IL). The skin and underlying connective tissue were reflected to expose reference sutures (sagittal and coronal) on the skull. The sagittal plane was adjusted such that bregma and lambda were positioned at the same coordinates on the vertical plane. Virulent, salivary gland‐passaged MCMV RM461 (1.5 × 10⁵ TCID50 units in 10 µL), was injected into the right lateral ventricle at 0.9 mm lateral, 0.5 mm caudal, and 3.0 mm ventral to bregma using a Hamilton syringe (10 µL) fitted to a 27 G needle. The injection was delivered over a period of 3–5 min. The opening in the skull was sealed with bone wax and the skin was closed using 4‐0 silk sutures with a FS‐2 needle (Ethicon).
Isolation of Brain Leukocytes and FACS
Leukocytes were isolated from control and MCMV‐infected murine brains using a previously described procedure with minor modifications (Cheeran et al., 2007; Ford et al., 1995; Havenith et al., 1998; Marten et al., 2003). In brief, whole brains were harvested, pooled (n = 4–6 animals/group/experiment), and minced finely in RPMI 1640 (2 g/L D‐glucose and 10 mM HEPES) and digested in 0.0625% trypsin (in Ca/Mg‐free HBSS) at room temperature for 20 min. Single cell preparations from infected brains were suspended in 30% Percoll and banded on a 70% Percoll cushion at 900 × g at 15°C. Brain leukocytes obtained from the 30–70% Percoll interface were collected and used for (1) subsequent antibody staining for flow cytometry or (2) suspended in RPMI for ex vivo culture experiments.
For flow cytometric antibody staining, brain leukocytes were first treated with Fc block (anti‐CD32/CD16 in the form of 2.4G2 hybridoma culture supernatant with 2% normal rat and 2% normal mouse serum) to inhibit nonspecific Ab binding and were stained with anti‐mouse immune cell surface markers for 45 min at 4°C [anti‐CD45‐PE‐Cy5, anti‐CD11b‐APC‐CY7, anti‐CD4‐e450, anti‐CD8‐AF700, anti‐major histocompatibility complex (MHC) Class II‐APC, anti‐PD‐1‐PE, and anti‐PD‐L1‐PE or FITC (eBiosciences)]. Analysis by flow cytometry was performed. Control isotype Abs were used for all fluorochrome combinations to assess nonspecific Ab binding. Live leukocytes were gated using forward scatter and side‐scatter parameters on a BD FACSCanto flow cytometer (BD Biosciences). Data were analyzed using FlowJo software (TreeStar).
Ex vivo cultures of brain leukocytes isolated from MCMV‐infected mice at 14 d postinfection were used to investigate CD8+ T‐cell cytokine production following antibody neutralization of the PD‐1: PD‐L1 pathway. Total brain leukocytes suspensions were seeded at a density of 1.3 × 10⁵ cells/well and cultured at 37°C in RPMI complete supplemented with 10% FCS. Aminoguanidine (1 mM; Sigma) and indomethacin (20 µM; Sigma) were added to media to suppress nitric oxide synthetase and prostaglandin production (Duncan and Miller, 2011). Cells were treated for 1 h with either anti‐PD‐L1 neutralizing antibody (10 µg/mL; M1H5 clone; eBioscience) or rat IgG2a isotype control (10 µg/mL; eBioscience) prior to the addition of the CD8 T‐cell specific MCMV‐IE1168–176 peptide (YPHFMPTNL; 5 and 50 µM) (Del Val et al., 1988). Anti‐CD3 (2 µg/mL) stimulation was included as a positive control. Supernatants were collected 48 h after peptide addition and frozen at −20°C until analysis. IFN‐γ and interleukin (IL)−2 concentration were measured using a mouse IFN‐γ or IL‐2 ELISA kit (eBioscience) according to manufacturer's instructions.
Microglial Cell Cultures
Murine cerebral cortical cells from 1‐day‐old Balb/c mice were dissociated after a 30‐min trypsinization (0.25%) and were plated in 75‐cm2 Falcon culture flasks in DMEM containing 10% FBS, penicillin (100 U/mL), streptomycin (100 µg/mL), gentamicin (50 µg/mL), and Fungizone® (250 pg/mL). The medium was replenished 1 and 4 d after plating. On day 12 of culture harvested cells were plated in a 60‐mm Petri dish and incubated for 15 min at 37°C. After extensive washing with culture medium, adherent microglia were collected with a rubber policeman and centrifuged at 1,000 rpm for 10 min. Purified microglial cell cultures were comprised of a cell population in which >98% stained positively with Iba‐1 antibodies and <2% stained positively with antibodies specific to glial fibrillary acid protein, an astrocyte marker. Depending on the experiment, microglia were plated onto either 48‐, 24‐, or 12‐well tissue culture plates (2 × 10⁴, 2 × 10⁵, 1 × 10⁶ cells/well, respectively) for RNA extraction and quantitation or for flow cytometric antibody staining.
Astrocyte Cultures
Purified astrocyte cultures were prepared from microglial cell seed cultures following isolation of microglia (see earlier) at 14 days in vitro. Briefly, after collection of microglia, culture flasks containing the remaining cells were shaken at 180–200 rpm at 37°C for 16 h followed by trypsinization with 0.25% trypsin in HBSS for 30 min. After adding FBS (final concentration 10%), centrifugation and washing, cells were seeded into new flasks with DMEM followed by medium change after 24 h. The subculture procedure was repeated weekly for 2 weeks to remove residual oligodendrocytes and microglia and achieve highly purified astrocyte cultures (95–98% of cells reacted with GFAP antibody). Depending on the experiment, astrocytes were then collected and seeded onto either 48‐, 24‐, or 12‐well tissue culture plates (2 × 10⁴, 2 × 10⁵, 1 × 10⁶ cells/well, respectively) for RNA extraction and quantitation or for flow cytometric antibody staining.
CD8: Glial Cell Co‐cultures
CD8+ T‐cells were isolated using the MagCellect Mouse CD8+ T Cell Isolation Kit (R&D Systems) from the spleens and lymph nodes of naive Balb/c mice. Purified CD8+ T‐cells were placed into culture and stimulated with anti‐CD3 (2 µg/mL) antibody for 1 h prior to transfer onto purified primary microglial or astrocyte cell cultures with or without IFN‐γ pretreatment (8 h; 200U/mL; eBioscience). CD8+ T‐cells were added at a 10:1 CD8: glial cell ratio. Neutralization of PD‐1 and its ligand was performed by treating glial cells with anti‐PD‐1 (J43 clone; eBiosciences), anti‐PD‐L1 (M1H5 clone; eBiosciences), anti‐PD‐L2 (TY25 clone; eBiosciences), or IgG2a for 2 h prior to the addition of anti‐CD3‐activated CD8 T‐cells. Supernatants were collected 48 h after the addition of T‐cells and frozen at −20°C until analysis. IFN‐γ and IL‐2 concentrations were measured using a mouse IFN‐γ or IL‐2 ELISA kit (eBioscience) according to manufacturer's instructions.
Semiquantitative RT‐PCR
RNA was extracted from purified microglia and astrocyte cell cultures using RNAse Easy Kit (Qiagen). cDNA was synthesized with 0.5–1.0 µg of total RNA using Superscript II reverse transcriptase (Invitrogen, Carlsbad, CA) and oligo dT6–12 primers (Sigma‐Genosys, The Woodlands, TX). PCR was performed with the Advantage SYBR Green QPCR master mix (ClonTech, Mountain View, CA). The PCR conditions for the Mx3000P QPCR System (Stratagene) were: 40 denaturation cycles of 95°C for 10 s, annealing at 0°C for 10 s, and elongation at 72°C for 10 s. The relative product levels were quantified using the 2(‐Delta Delta Ct) method (Livak and Schmittgen, 2001) and were normalized to the housekeeping gene hypoxanthine phosphoribosyl transferase‐encoding (HPRT; NM_013556). Data presented are representative of three independent experiments. PD‐L1 primer sequences (NM_021893.3): Forward = 5′‐CGTGAGTGGGAAGAGAAGTGTC‐3′, Reverse = 5′‐CTACAATGAGGAACAACAGGATGG‐3′.
Immunohistochemistry
Brains were harvested from infected mice that were perfused with serial washes of 2% sodium nitrate and phosphate‐buffered saline (PBS) to remove contaminating blood cells and prefixed with 4% paraformaldehyde. Murine brains were subsequently submerged in 4% paraformaldehyde for 24 h and transferred to 30% sucrose solution for 2 d. Brains were placed on a cryostat and tissues were cut into sections of 25‐µm thickness. Following rehydration of tissue sections with PBS, tissue was blocked (1× PBS, 10% normal goat serum and 0.3% Triton X‐100) for 1 h at room temperature, brain sections were incubated overnight at 4 °C with the following primary antibodies: rat α‐mouse MHC Class II (10 µg/mL; eBioscience), rabbit α‐GFAP antibodies (1:1500; DAKO), rabbit α‐Iba1 (2 µg/mL; Wako Chemicals), rat α‐mouse CD8a (10 µg/mL; eBioscience). Brain sections were washed three times with PBS. After washing, secondary antibody (rhodamine‐ or FITC‐conjugate) was added for 1 h at RT followed by nuclear labeling with Hoechst 33342 (Chemicon, Temecula, CA; 1 µg/mL) and viewing under fluorescent microscope.
Statistical Analysis
For comparison of means of multiple groups, analysis of variance was performed followed by either Fisher's protected least significant difference‐test or Scheffe‐test. For comparison of means of pairs of data a two‐tailed Student's T‐test for paired samples was applied.
Results
Post‐MCMV‐Encephalitic Microglia Chronically Express PD‐L1
Direct injection of MCMV into the brain of Balb/c mice results in acute viral encephalitis. This infection is rapidly cleared through the action of microglia, the resident CNS immune sentinels, and the recruitment of innate and adaptive immune cells from the periphery. We have previously shown that this acute and controlled viral brain infection results in chronic neuroinflammation that can persist for at least 30 d following viral clearance (Mutnal et al., 2011b). Isolation and flow cytometry of brain mononuclear cells (BMNCs), including microglia and CNS‐infiltrating leukocytes, from MCMV‐infected mice showed that microglia upregulate the surrogate activation marker, MHC Class II, during the acute phase of infection and continue to chronically express this protein on their surface (Mutnal et al., 2011b). MHC Class II expression on microglia is notably absent in sham‐, mock‐, and uninfected mice. In this study, we first confirmed this widespread and prolonged expression of MHC Class II on microglia using immunohistochemistry. At 30 days postinfection (dpi) in the postencephalitic brains of MCMV‐infected mice, ionized calcium binding adaptor molecule 1 (Iba1) was found to colocalize with MHC Class II on activated microglia (Fig. 1A).
Figure 1.
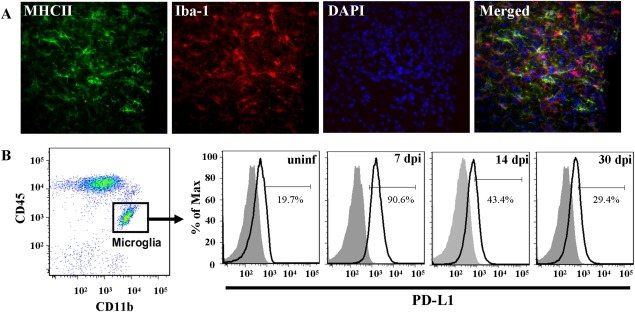
Microglia chronically express MHC Class II and PD‐L1 following MCMV‐induced encephalitis. MCMV‐infected Balb/c mice were perfused (30 dpi) and cryosectioned for immunohistochemistry. (A) Co‐labeling of MHC II (green), as an indicator of activation, and the microglial cell marker, Iba‐1 (red). Nuclear counterstain with DAPI (blue). Tissue section thickness = 25 µm. (B) Mononuclear cells were extracted from uninfected and MCMV‐infected Balb/c mouse brains (7, 14, and 30 dpi). Cells were analyzed for surface expression of PD‐L1 on microglia using flow cytometry. Microglia were identified as CD45intCD11b+ and were specifically gated on for PD‐L1 (black line). Isotype antibody control = filled grey line. Flow plots are representative of three separate experiments.
Recent studies suggest that antigen presenting cells, such as microglia, can suppress T‐cell activation through the PD‐1: PD‐L1 inhibitory pathway. Microglial suppression of CD4+ and CD8+ T‐cells has been shown during the active phase of viral infection in murine models of multiple sclerosis (Carter et al., 2007; Magnus et al., 2005; Phares et al., 2013). It is not known whether similar mechanisms are involved in the inhibition of T‐cells persisting within the CNS during chronic neuroinflammation in the absence of active viral replication. Using our MCMV brain infection model, we first examined the kinetics of PD‐L1 expression on microglia from the acute, productive phase of infection (7 dpi) into the chronic neuroinflammatory, postviral clearance phase (30 dpi). Resting microglia, which are identified by flow cytometry as the CD45intCD11b+ population, in uninfected mice expressed low levels of PD‐L1. In contrast, during the acute phase of viral infection PD‐L1 surface expression on microglia increased dramatically (control = 19.7% vs. MCMV‐infected = 90.6%) and remained elevated during persistent neuroinflammation (29.4%; Fig. 1B).
Persistent Brain‐Infiltrating CD8+ T‐Cells Express the PD‐1 Receptor
CD8+ T‐cells are pivotal to the active clearance of virus from the brain during MCMV infection. As previously shown in mouse models of herpesvirus brain infection (Armien et al., 2010; Mutnal et al., 2011b), we found immunohistological evidence that CD8+ T‐cells persist in the postencephalitic brain following MCMV clearance (Fig. 2A). In addition, kinetic analysis of BMNCs for brain infiltrating CD8+ T‐cells (gated on the CD45+CD11blow infiltrating T‐cell population) from MCMV‐infected brain homogenates showed an increase in the percentage of CD8+ T‐cells as the infection progressed from the acute (7 dpi = 29.9%) to chronic (30 dpi = 64.5%) phases of disease (Fig. 2B). In brain tissues obtained from sham‐infected, control animals, infiltrating CD45(hi) cells were found to be rare (5.6%; Cheeran et al., 2009b; Mutnal et al., 2010, 2011a).
Figure 2.
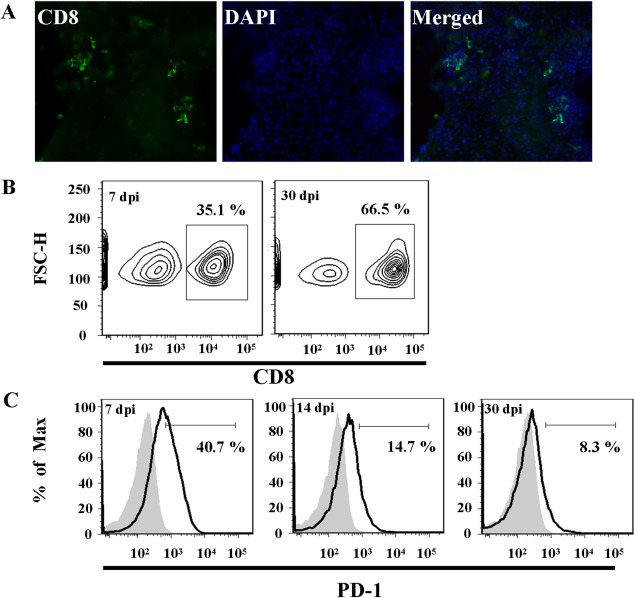
CD8+ T‐cells persist and express PD‐1 in the postencephalitic murine brain. (A) Immunohistochemical detection of CD8+ T‐cells (green) in the parenchyma and surrounding the lateral ventricles in MCMV‐infected mice at 30 dpi. (B, C) Mononuclear cells were extracted from MCMV‐infected Balb/c brains and brain infiltrating T‐cells were identified by flow cytometry as CD45+CD11blow. (B) CD45+CD11blow cells were gated on to analyze the CD8+ cell population in the brains of MCMV‐infected mice at 7 and 30 dpi. (C) PD‐1 surface expression on CD8+ T‐cells at 7, 14, and 30 dpi (black line). Isotype antibody control = filled gray line. Flow plots are representative of three separate experiments.
Antigen experienced CD8+ T‐cells are known to express PD‐1 as an indicator of activation and, subsequently, exhaustion (Hofmeyer et al., 2011). However, the state of PD‐1 expression on persistent CD8+ T‐cells in the brain following viral encephalitis is unknown. To investigate the interaction of microglia and CD8+ T‐cells during chronic neuroinflammation, we examined CD8+ T‐cell PD‐1 expression kinetics following MCMV brain infection. To this end, BMNCs were isolated from MCMV‐infected mice at 7 and 30 dpi. The CD45+CD11blow‐identified T‐cell population was further gated on for analysis of the CD8+ subpopulation. During the acute phase of infection (7 dpi) PD‐1 surface expression on CD8+ T‐cells within the brain was elevated (40.7%). PD‐1 expression remained elevated on CD8+ T‐cells during CNS persistence (14 dpi = 14.7%; 30 dpi = 8.3%), however, the percentage of PD‐1+ CD8+ cells decreased compared with levels observed during the acute infection (Fig. 2C). The CD45+CD11blow population of T‐cells is notably absent from mock‐ and uninfected mice (Cheeran et al., 2007), thus PD‐1 expression on CD8+ T‐cells within control mice is not measurable.
Microglia Inhibit CD8+ T‐Cell Activity via the PD‐1: PD‐L1 Pathway
Chronic activation and PD‐L1 expression on microglia following MCMV brain infection, along with the retention and long‐term PD‐1 expression on CD8+ T‐cells, suggests glial cell involvement in the functional suppression of residual T‐cells in the postviral encephalitic brain. Using primary microglial cells, we directly examined the inhibitory effects of microglial PD‐L1 on CD8+ T‐cell activation. First, we confirmed the activation and upregulation of PD‐L1 on cultured microglial in response to IFN‐γ, TNFα, and IL‐1β, proinflammatory cytokines found during acute and chronic infection (Armien et al., 2010; Marques et al., 2008; Mutnal et al., 2011b). IFN‐γ, TNFα, or IL‐1β stimulation for 24 h resulted in a four‐fold increase in PD‐L1 mRNA expression in microglia, compared with unstimulated controls (Fig. 3A). Similarly, 24 h incubation with IFN‐γ, a potent T‐cell‐secreted cytokine, resulted in a robust increase of surface‐expressed PD‐L1 on microglia (control = 8.6%; IFN‐γ = 92.9%; Fig. 3B). These data confirmed previous reports that resting microglia express low levels of PD‐L1 (Magnus et al., 2005). As a positive control for microglial activation, we found that IFN‐γ‐treatment induced microglial expression of MHC Class II (control = 18.0%; IFN‐γ = 81.7%; Fig. 3C). Both constitutive and IFN‐γ‐induced MHC Class I expression were also detected (control = 44.1%; IFN‐γ = 74.5%; Fig. 3D).
Figure 3.

Proinflammatory cytokines induce PD‐L1 expression in primary cultured murine microglia. Primary purified microglia cultures (1–2 × 10⁵ cells/well) were left untreated or stimulated with IFN‐γ (200 units/mL), TNFα (20 ng/mL) or IL‐β (10 ng/mL). (A) PD‐L1 expression was determined by semiquantitative RT‐PCR of microglial mRNA. (B, C) Flow cytometric detection of surface PD‐L1 (B), MHC II (C), and MHC I (D) on control and IFN‐γ‐stimulated (24 h) microglia. Isotype antibody control = filled gray line. RT‐PCR and flow cytometry graphs are representative of three separate experiments.
To examine microglial inhibition of CD8+ T‐cell activation through PD‐L1, we co‐cultured CD8+ cells with IFN‐γ‐stimulated primary microglia. Microglia were pretreated with IFN‐γ for 8 h before being co‐cultured with either unstimulated CD8+ T‐cells, which express little PD‐1 (11%), or with CD8+ T‐cells stimulated to express PD‐1 (30.5%) via anti‐CD3 antibody pretreatment (48 h; Fig. 4A). Co‐culture of unstimulated CD8+ T‐cells with microglia produced negligible levels of IFN‐γ and IL‐2 in the culture supernatant (Fig. 4B,C). As expected, anti‐CD3‐stimulated CD8+ T‐cells in co‐culture with microglia presented a significant increase in IFN‐γ (P < 0.001) and IL‐2 (P < 0.001) production. Blockade of PD‐L1 on microglia using an anti‐PD‐L1 neutralizing antibody enhanced CD8+ T‐cell IFN‐γ (P = 0.0024) and IL‐2 production. Similarly, blockade of PD‐1 on CD8+ T‐cells with anti‐PD‐1 neutralizing antibody enhanced IFN‐γ (anti‐PD‐1, P = 0.0187) and IL‐2 production. In contrast, neither anti‐PD‐L2 neutralizing antibody nor control IgG significantly affected CD8+ T‐cell IFN‐γ and IL‐2 levels in the supernatant.
Figure 4.

Microglia suppress activated CD8+ T‐cells through PD‐1: PD‐L1. (A) CD8+ T‐cells from uninfected Balb/c mice were placed into culture (2 × 10⁵ cells/well) wells coated with α‐CD3 Abs (2 µg/mL). Cells were collected and analyzed at 0, 24, and 48 h for PD‐1 receptor surface expression. Isotype = filled gray line. (B, C) Unstimulated CD8 T‐cells (untreated) or CD3‐stimulated CD8+ T‐cells were transferred into co‐culture with microglia that received an IFN‐γ (200 Units/mL) pretreatment for 8 h. CD8+ T‐cells were added at a 10:1 CD8: Glial cell ratio. Prior to CD8+ T‐cell addition, co‐cultures were left untreated (control) or treated for 2 h with α‐PD‐L1, α‐PD‐L2, or α‐PD‐1 neutralizing antibody. Treatment with rat IgG2a was used as an isotype antibody control. Supernatants were collected at 24 h and ELISA run for IFN‐γ (B) and IL‐2 (C). Histograms are representative of three separate experiments. *P ≤ 0.01. **P ≤ 0.001.
Chronically Activated Microglia Suppress CD8+ T‐Cell Effector Function via PD‐1: PD‐L1
Previous studies in mouse models of multiple sclerosis have shown that microglia and infiltrating macrophages inhibit immune activation via PD‐L1 interaction with PD‐1 on CD8+ T‐cells (Duncan and Miller, 2011; Phares et al., 2013). These studies, however, concentrate on the role of the PD‐1: PD‐L1 interaction in limiting T‐cell activation using a demyelinating disease model caused by an active viral infection. In this study, we focused on the function of glial‐expressed PD‐L1 in the persistently inflamed CNS of MCMV‐infected mice (>14 dpi); this is long past the acute, virally active phase of disease, which is complete by 7 dpi. The role of microglial PD‐L1 expression in suppressing chronic postencephalitic neuroinflammation is unknown.
To test the functional role of PD‐L1 expression in the brain of postencephalitic mice, we first isolated BMNCs from MCMV‐infected mice at 14 dpi, a time point void of active viral replication and associated with the transition into chronic neuroinflammation, and placed them into ex vivo cultures. Total BMNCs, which include CD4+ T‐cells, CD8+ T‐cells and microglia, were incubated with MCMV IE1168–176 (0, 5, and 50 µM), which has previously been identified as a CD8+ T‐cell‐specific MHC Class I restricted epitope (Del Val et al., 1988; Holtappels et al., 2002), for 48 h and supernatants were analyzed for IFN‐γ and IL‐2 via ELISA. MCMV IE1168–176 stimulation alone resulted in a dose‐dependent increase in CD8+ T‐cell IFN‐γ and IL‐2 production (Fig. 5A,B). Using PD‐L1 neutralizing antibody, added 1 h prior to MCMV IE1168–176 stimulation, we were able to specifically assess the role of PD‐L1 on CD8+ T‐cell IFN‐γ production. In the presence of anti‐PD‐L1 antibody, IFN‐γ and IL‐2 increased dramatically, compared with untreated and IgG2a‐treated control; IFN‐γ production in the presence of anti‐PD‐L1 antibody increased 72% (50 µM IE1) and 250% (5 µM IE1). Similarly, IL‐2 production increased 20% (50 µM IE1) and 120% (5 µM IE1) above untreated and IgG2a‐treated controls.
Figure 5.

PD‐1: PD‐L1 pathway inhibits CD8+ T‐cell IFN‐γ and IL‐2 expression in the postencephalitic brain. Mononuclear cells were isolated from the brains of MCMV‐infected Balb/c mice at 14 dpi (n = 5/group) and cultured (1.3 × 10⁵ cells/well) in the presence of 0, 5, or 50 µM CD8‐specific MCMV‐ IE1168–176 peptide. Prior to the addition of peptide the cultures were treated with PD‐L1 neutralizing antibody (α‐PD‐L1; gray bars), control rat IgG isotype (IgG2a; white bars) or left untreated (black bars). Supernatants were collected after 48 h in culture with peptide and analyzed for IFN‐γ (A) and IL‐2 (B) levels (pg/mL). Data are representative of three separate experiments. **P ≤ 0.001.
Astrocytes Inhibit CD8+ T‐Cell Activity via the PD‐1: PD‐L1 Pathway
Astrocytes were the first glial cells shown to be inducible for MHC Class II expression (Lipp et al., 2007; Shrikant and Benveniste, 1996). In comparison to microglia, astrocyte MHC Class II expression is slower to develop and less robust, thus deeming them the “nonprofessional” antigen presenting cells in the brain (Vardjan et al., 2012). Little is known about the antigen presenting capacity of astrocytes in our model of MCMV‐induced encephalitis. In this study, we first examined MCMV‐infected brain tissue and confirmed MHC Class II colocalization with GFAP‐labeled astrocytes in postencephalitic (30 dpi) mice (Fig. 6A). Chronic astrocyte activation, as indicated by MHC Class II expression, a known marker for glial cell activation, suggests a role for these cells during postencephalitic neuroinflammation, like that observed for microglia. Indeed, when in co‐culture with T‐cells, astrocytes have been shown to suppress T‐cell activation by IFN‐γ (Gold et al., 1996). However, the mechanisms by which astrocytes suppress T‐cells are currently unknown.
Figure 6.

Activated astrocytes express PD‐L1, MHC I, and MHC II. (A) In vivo expression of MHC Class II on astrocytes following MCMV infection of Balb/c mice (30 dpi). GFAP‐positive (red) astrocytes co‐label with MHC Class II (green). Nuclei were stained with DAPI (blue). Tissue section thickness = 25 µm. (B–E) Purified astrocyte cultures (2–3 × 10⁵ cells/well) were left untouched (control) or stimulated with IFN‐γ for 24–48 h. (B) FSC‐A/SSC‐A dot plot shows the gating strategy for flow cytometric analysis of a single cell suspension of cultured astrocytes. (C, D) Flow cytometry of MHC Class II (C) and PD‐L1 (D) surface expression on astrocytes following 24 h stimulation with IFN‐γ. (E) RT‐PCR mRNA expression of PD‐L1 in astrocytes after 24 and 48 h IFN‐γ stimulation. (F) Flow cytometric analysis of MHC Class I expression on astrocytes following IFN‐γ treatment (24 h). Expression values are normalized to unstimulated controls at each time point. RT‐PCR and flow cytometry graphs are representative of three separate experiments.
Using purified murine astrocyte cultures, we investigated the effects of the T‐cell produced proinflammatory cytokine IFN‐γ on astrocyte activation and PD‐L1 expression. Unstimulated and IFN‐γ‐stimulated astrocytes can be extracted from culture plates via light trypsinization (0.5% Trypsin in HBSS) for 15 min and identified by flow cytometry using forward‐ and side‐scatter (Fig. 6B). Flow cytometry confirmed that, like microglia, IFN‐γ stimulation (24 h) resulted in the robust activation of astrocytes as indicated by MHC Class II (Fig. 6C) and PD‐L1 surface protein expression (Fig. 6D). In addition, semiquantitative RT‐PCR of IFN‐γ‐stimulated astrocytes in vitro also showed an increase in PD‐L1 mRNA expression compared with unstimulated control cells (Fig. 6E). Surface expression of MHC Class I was also detected on unstimulated and IFN‐γ‐stimulated (24 h) astrocytes (Fig. 6F).
Based on our finding that microglial expressed PD‐L1 inhibited CD8+ T‐cell activation in the postencephalitic, chronically inflamed brain, we hypothesized that IFN‐γ‐activated murine astrocytes would also possess the ability to suppress CD8+ T‐cell function via interaction through PD‐1 and PD‐L1. To this end, we co‐cultured unstimulated or anti‐CD3‐stimulated CD8+ T‐cells with purified murine astrocytes. Astrocytes were stimulated with IFN‐γ for 24 h before being co‐cultured with the CD8+ T‐cells. Co‐cultures of unstimulated CD8+ T‐cells with astrocytes produced negligible levels of IFN‐γ and IL‐2 in the culture supernatant (Fig. 7A,B). As expected, anti‐CD3‐stimulated CD8+ T‐cells resulted in a significant increase in IFN‐γ (P < 0.001) and IL‐2 (P < 0.001). Blockade of PD‐L1 on astrocytes using an anti‐PD‐L1 neutralizing antibody enhanced CD8+ T‐cell IFN‐γ (P < 0.001) and IL‐2 (P = 0.003) production. Similarly, blockade of PD‐1 on CD8+ T‐cells with anti‐PD‐1 neutralizing antibody enhanced IFN‐γ (P < 0.001) and IL‐2 (P = 0.0016) production compared with unstimulated co‐cultures and cultures treated with IgG antibody. Similar to microglia, anti‐PD‐L2 neutralizing antibody did not affect CD8+ T‐cell production of IFN‐γ and IL‐2 when in co‐culture with astrocytes.
Figure 7.

Astrocytes inhibit CD8+ T‐cell cytokine production through PD‐1: PDL‐1. (A, B) CD8+ T‐cells were either untouched (untreated) or stimulated with anti‐CD3 Abs for 1 h prior to transfer into co‐culture with purified astrocytes (anti‐CD3 stimulated CD8 cells). Astrocyte cultures were pretreated for 8 h with IFN‐γ (200 U/mL) to stimulated PD‐L1 expression. CD8+ T‐cells were added at a 10:1 CD8: Glial cell ratio. Prior to CD8+ T‐cell addition, astrocyte cultures were left untreated (control) or treated for 2 h with α‐PD‐L1, α‐PD‐L2, or α‐PD‐1 neutralizing antibody. Treatment with rat IgG2a was used as an isotype antibody control. Supernatants were collected at 24 h and ELISA run for IFN‐γ (A) and IL‐2 (B). Histograms are representative of three separate experiments. *P ≤ 0.01, **P ≤ 0.001.
Discussion
Long term, persistent inflammation of the CNS is commonly seen during neurodegenerative disease, stroke, and viral brain infection (Neumann, 2001). Observations in animal models of brain infection and disease show that chronic neuroinflammation typically consists of the retention of CD8+ T‐cells and heightened activation of MHC Class II on resident microglia. A similar profile for chronic brain inflammation is reported in this study, where immunohistochemistry and flow cytometry show that approximately 30% of microglia continue to express the surrogate marker for glial cell activation, MHC Class II, at 30 dpi (Fig. 1), long past clearance of active viral replication in the brain. We also confirmed previous findings that, as MCMV brain infection progressed from the productive phase into the chronic persistent phase, the percent of CD8+ T‐cells within the CD45+CD11blow leukocyte population increased from 30% (7 dpi) to 65% (30 dpi; Fig. 2), making CD8+ T‐cells the predominant brain‐infiltrating immune cell type following viral encephalitis. Furthermore, to our knowledge, this study is the first to report the upregulation and maintained expression of MHC Class II on astrocytes during MCMV‐infection (Fig. 6).
CD8+ T‐cells that remain following MCMV brain infection are, at least partially, antigen‐specific. IFN‐γ secretion by these cells is responsible for long‐term microglial activation and TNFα production (Mutnal et al., 2011b). Synergistic action of TNFα and IFN‐γ in the brain has been shown to increase nitric oxide‐induced neurodegeneration (Blais and Rivest, 2004), emphasizing the importance of minimizing chronic neuroinflammation. If not carefully managed, extended inflammation in the brain can lead to secondary neuronal injury and resultant neurocognitive dysfunction (Armien et al., 2010).
Microglia, traditionally thought to provide CNS immune surveillance and proinflammatory support, are now also believed to have a role in negatively regulating active T‐cell responses in the brain. PD‐1 binding with the negative co‐stimulatory molecule PD‐L1, which is upregulated on antigen presenting cells, is a well‐known mechanism for suppression of CD8+ T‐cell proliferation and function (Dong et al., 1999; Kobata et al., 2000; Sharpe and Freeman, 2002). Microglia are the foremost antigen presenting cells of the brain, as evidenced through their expression of MHC Class I and II in response to brain infection (Neumann, 2001; Sedgwick et al., 1993). As previously reported (Magnus et al., 2005), we found low basal expression of PD‐L1 on microglia, approximately 20% of cells in uninfected mice expressed surface PD‐L1 (Fig. 1). PD‐L1 expression on microglia increased robustly during the acute stage of infection, coinciding with the infiltration of IFN‐γ‐secreting CD8+ T‐cells and increased CNS TNFα (Cheeran et al., 2007). Similarly, IFN‐γ and TNFα treatment increased PD‐L1 on in vitro cultured microglia, confirming the role of those cytokines in PD‐L1 upregulation (Fig. 3). Furthermore, we found that blockade of the PD‐1 pathway with either PD‐1 or PD‐L1 neutralizing antibody, both in vitro and in ex vivo brain leukocyte extracts, resulted in increased CD8+ T‐cell IFN‐γ and IL‐2 production. These data demonstrate that microglia suppress CD8+ T‐cell function, as indicated by IFN‐γ and IL‐2 production, through the PD‐1: PD‐L1 pathway.
In this study, MHC Class II expression on microglia and astroglia was used only as an indicator of glial cell activation in response to proinflammatory stimulation. With respect to glial‐cell suppression of CD8+ T‐cells, MHC Class I expression is the critical component, not MHC Class II. To demonstrate this, in Fig. 5, we assessed the effects of glial‐expressed PD‐L1 on CD8+ T‐cells isolated from the brains of MCMV‐infected mice at 14 dpi. In this experiment, we used a MHC Class I restricted peptide for specific CD8+ T‐cell restimulation (MCMV IE1168‐176). We, and others, have previously shown this peptide to robustly activate CD8+ T‐cell ex vivo, as indicated by IFN‐γ stimulation (Del Val et al., 1988; Holtappels et al., 2002; Mutnal et al., 2012).
Using the JHM strain of neurotropic coronavirus, which induces acute encephalomyelitis in mice, Phares et al. demonstrated that PD‐L1 expression on microglia and oligodendroglia during active viral infection facilitated the suppression of CD8 T‐cell function (Phares et al., 2009). Similarly, Duncan et al. showed that microglia in the CNS during active Theiler's murine encephalomyelitis virus (TMEV) infection, which is used as a model for multiple sclerosis, upregulate PD‐L1. Using neutralizing antibody to PD‐L1, they showed that ex vivo microglia suppressed CD4+ and CD8+ T‐cell cytokine production through engagement of the T‐cell PD‐1 receptor. In vivo blockade of PD‐L1, again using neutralizing antibody, resulted in decreased viral loads, but also caused an increase in mortality, presumably through exacerbated immune‐mediated damage to the nervous system (Duncan and Miller, 2011). Although these previous studies have primarily focused on PD‐L1 in managing T‐cell function during acute viral CNS infection, the present study shows the involvement of this negative regulatory pathway in inhibiting persistent CD8+ T‐cell function during postviral encephalitic chronic neuroinflammation. Specifically, treatment of isolated BMNCs, consisting of microglia and brain‐infiltrating leukocytes, with PD‐L1 neutralizing antibody increased the production of IFN‐γ and IL‐2 from MCMV‐IE1168–176‐stimulated memory CD8+ T‐cells (Fig. 5). These experiments were performed on cells extracted from MCMV‐infected brains at 14 dpi, approximately 1 week following the clearance of active viral infection. To our knowledge, this is the first experiment demonstrating the role of microglial PD‐L1 on inhibiting brain CD8+ T‐cells during chronic neuroinflammation and in the absence of productive viral infection.
The role of astrocytes acting as antigen presenting cells is well reported (Shrikant and Benveniste, 1996). In this study, we corroborate previous findings that IFN‐γ robustly upregulates MHC Class II expression on purified cultures of murine astrocytes. In addition, we report that IFN‐γ stimulation‐induced PD‐L1 upregulation on purified astrocytes in vitro, suggesting the involvement of astrocytes as an additional immunosuppressive cell type. Indeed, Pittet et al. have previously shown that IFN‐γ stimulation of purified cultures of human astrocytes‐induced surface PD‐L1 expression, which suppress T‐lymphocytes via engagement of PD‐1 on the surface of CD8 cells (Pittet et al., 2011). Furthermore, we confirmed that astrocytes regulate T‐cells by inhibiting CD8+ T‐cell cytokine production through the physical engagement of T‐cell‐expressed PD‐1 and glial‐expressed PD‐L1 (Gold et al., 1996). As techniques for isolating and culturing astrocytes from the brains of adult mice become available, ex vivo verification of T‐cell suppression by astrocytes by this pathway will be required. Multiple studies have clearly shown that, in relation to effector T‐cell stimulation, microglia are superior to astrocytes. IFNγ induces microglia expression of T‐cell co‐stimulatory molecules (CD80 and CD86) that are necessary second‐signals for glia to functionally activate T‐cells (Aloisi, 2001). To our knowledge, there have been no reports of astrocytes either expressing these co‐stimulatory molecules or being able to effectively activate T‐cells (Cross and Ku, 2000). Studies by Magnus et al., suggest that while astrocytes and microglia both inhibit T‐cell function, the effect is more pronounced in the latter cell type (Magnus et al., 2005). Our in vitro studies show that PD‐L1 neutralization resulted in more potent recovery of CD8+ T‐cell IFN‐γ production in astrocyte co‐cultures (2.4‐fold increase) compared with microglia co‐cultures (1.5‐fold). PD‐L1 neutralization had comparable effects on IL‐2 production in both microglia and astrocyte co‐cultures. These data suggest a more potent role for astrocytes in CD8+ T‐cell suppression in the brain. Such conclusions, however, cannot be drawn from the experiments conducted in this study because of our inability to assess the percentage of PD‐L1 expression on astrocytes in the postencephalitic brain or to evaluate the effect of PD‐L1 neutralization on astrocytes using ex vivo glial: BMNC co‐cultures.
Although reports of chronic neuroinflammation are becoming more common, the role for persistent immune activation remains elusive. Within the context of viral encephalitis, studies have shown that persistent microglial activation as well as CD4+ and CD8+ T‐cell infiltration is associated with neurotoxicity and neurocognitive dysfunction, suggesting extended neuroinflammation may be harmful to the brain (Armien et al., 2010). Conversely, maintaining an antigen‐specific CD8+ T‐cell population in the brain would aide in the rapid clearance of reactivated virus from latently infected neurons (Mutnal et al., 2012; Tsutsui et al., 1995). Regardless of their purpose, this article shows that brain cells actively contribute to the suppression of CD8+ T‐cells and suggests that a new homeostatic environment is created in the postencephalitic CNS that maintains elevated immune surveillance coupled with brain‐cell mediated regulation of persistent adaptive immune cells.
Acknowledgment
The funders had no role in study design, data collection and analysis, decision to publish, or preparation of the manuscript.
References
- Aloisi F. 2001. Immune function of microglia. Glia 36:165–179. [DOI] [PubMed] [Google Scholar]
- Armien AG, Hu S, Little MR, Robinson N, Lokensgard JR, Low WC, Cheeran MC. 2010. Chronic cortical and subcortical pathology with associated neurological deficits ensuing experimental herpes encephalitis. Brain Pathol 20:738–750. [DOI] [PMC free article] [PubMed] [Google Scholar]
- Blais V, Rivest S. 2004. Effects of TNF‐alpha and IFN‐gamma on nitric oxide‐induced neurotoxicity in the mouse brain. J Immunol 172:7043–7052. [DOI] [PubMed] [Google Scholar]
- Carter LL, Leach MW, Azoitei ML, Cui J, Pelker JW, Jussif J, Benoit S, Ireland G, Luxenberg D, Askew GR, KL Milarski, C Groves, T Brown, BA Carito, K Percival, BM Carreno, M Collins, S Marusic. 2007. PD‐1/PD‐L1, but not PD‐1/PD‐L2, interactions regulate the severity of experimental autoimmune encephalomyelitis. J Neuroimmunol 182:124–134. [DOI] [PubMed] [Google Scholar]
- Cheeran MC, Gekker G, Hu S, Min X, Cox D, Lokensgard JR. 2004. Intracerebral infection with murine cytomegalovirus induces CXCL10 and is restricted by adoptive transfer of splenocytes. J Neurovirol 10:152–162. [DOI] [PubMed] [Google Scholar]
- Cheeran MC, Hu S, Palmquist JM, Bakken T, Gekker G, Lokensgard JR. 2007. Dysregulated interferon‐gamma responses during lethal cytomegalovirus brain infection of IL‐10‐deficient mice. Virus Res 130:96–102. [DOI] [PMC free article] [PubMed] [Google Scholar]
- Cheeran MC, Lokensgard JR, Schleiss MR. 2009a. Neuropathogenesis of congenital cytomegalovirus infection: Disease mechanisms and prospects for intervention. Clin Microbiol Rev 22:99–126, Table of Contents. [DOI] [PMC free article] [PubMed] [Google Scholar]
- Cheeran MC, Mutnal MB, Hu S, Armien A, Lokensgard JR. 2009b. Reduced lymphocyte infiltration during cytomegalovirus brain infection of interleukin‐10‐deficient mice. J Neurovirol 15:334–342. [DOI] [PMC free article] [PubMed] [Google Scholar]
- Cross AH, Ku G. 2000. Astrocytes and central nervous system endothelial cells do not express B7‐1 (CD80) or B7‐2 (CD86) immunoreactivity during experimental autoimmune encephalomyelitis. J Neuroimmunol 110:76–82. [DOI] [PubMed] [Google Scholar]
- Del Val M, Volkmer H, Rothbard JB, Jonjic S, Messerle M, Schickedanz J, Reddehase MJ, Koszinowski UH. 1988. Molecular basis for cytolytic T‐lymphocyte recognition of the murine cytomegalovirus immediate‐early protein pp89. J Virol 62:3965–3972. [DOI] [PMC free article] [PubMed] [Google Scholar]
- Dong H, Zhu G, Tamada K, Chen L. 1999. B7‐H1, a third member of the B7 family, co‐stimulates T‐cell proliferation and interleukin‐10 secretion. Nat Med 5:1365–1369. [DOI] [PubMed] [Google Scholar]
- Duncan DS, Miller SD. 2011. CNS expression of B7‐H1 regulates pro‐inflammatory cytokine production and alters severity of Theiler's virus‐induced demyelinating disease. PLoS One 6:e18548. [DOI] [PMC free article] [PubMed] [Google Scholar]
- Fields B. 2007. Fields' virology, 5th ed Philadelphia, PA: Wolters Kluwer Health/Lippincott Williams & Wilkins. [Google Scholar]
- Ford AL, Goodsall AL, Hickey WF, Sedgwick JD. 1995. Normal adult ramified microglia separated from other central nervous system macrophages by flow cytometric sorting. Phenotypic differences defined and direct ex vivo antigen presentation to myelin basic protein‐reactive CD4+ T cells compared. J Immunol 154:4309–4321. [PubMed] [Google Scholar]
- Gold R, Schmied M, Tontsch U, Hartung HP, Wekerle H, Toyka KV, Lassmann H. 1996. Antigen presentation by astrocytes primes rat T lymphocytes for apoptotic cell death. A model for T‐cell apoptosis in vivo. Brain 119(Pt 2):651–659. [DOI] [PubMed] [Google Scholar]
- Havenith CE, Askew D, Walker WS. 1998. Mouse resident microglia: Isolation and characterization of immunoregulatory properties with naive CD4+ and CD8+ T‐cells. Glia 22:348–359. [PubMed] [Google Scholar]
- Hofmeyer KA, Jeon H, Zang X. 2011. The PD‐1/PD‐L1 (B7‐H1) pathway in chronic infection‐induced cytotoxic T lymphocyte exhaustion. J Biomed Biotechnol 2011:451694. [DOI] [PMC free article] [PubMed] [Google Scholar]
- Holtappels R, Thomas D, Podlech J, Reddehase MJ. 2002. Two antigenic peptides from genes m123 and m164 of murine cytomegalovirus quantitatively dominate CD8 T‐cell memory in the H‐2d haplotype. J Virol 76:151–164. [DOI] [PMC free article] [PubMed] [Google Scholar]
- Kobata T, Azuma M, Yagita H, Okumura K. 2000. Role of costimulatory molecules in autoimmunity. Rev Immunogenet 2:74–80. [PubMed] [Google Scholar]
- Latchman YE, Liang SC, Wu Y, Chernova T, Sobel RA, Klemm M, Kuchroo VK, Freeman GJ, Sharpe AH. 2004. PD‐L1‐deficient mice show that PD‐L1 on T cells, antigen‐presenting cells, and host tissues negatively regulates T cells. Proc Natl Acad Sci USA 101:10691–10696. [DOI] [PMC free article] [PubMed] [Google Scholar]
- Lipp M, Brandt C, Dehghani F, Kwidzinski E, Bechmann I. 2007. PD‐L1 (B7‐H1) regulation in zones of axonal degeneration. Neurosci Lett 425:156–161. [DOI] [PubMed] [Google Scholar]
- KJ Livak, TD Schmittgen. 2001. Analysis of relative gene expression data using real‐time quantitative PCR and the 2(‐Delta Delta C(T)) Method. Methods 25:402–408. [DOI] [PubMed] [Google Scholar]
- Magnus T, Schreiner B, Korn T, Jack C, Guo H, Antel J, Ifergan I, Chen L, Bischof F, Bar‐Or A, Wiendl H. 2005. Microglial expression of the B7 family member B7 homolog 1 confers strong immune inhibition: Implications for immune responses and autoimmunity in the CNS. J Neurosci 25:2537–2546. [DOI] [PMC free article] [PubMed] [Google Scholar]
- Marques CP, Cheeran MC, Palmquist JM, Hu S, Urban SL, Lokensgard JR. 2008. Prolonged microglial cell activation and lymphocyte infiltration following experimental herpes encephalitis. J Immunol 181:6417–6426. [DOI] [PMC free article] [PubMed] [Google Scholar]
- Marten NW, Stohlman SA, Zhou J, Bergmann CC. 2003. Kinetics of virus‐specific CD8+ ‐T‐cell expansion and trafficking following central nervous system infection. J Virol 77:2775–2778. [DOI] [PMC free article] [PubMed] [Google Scholar]
- McPherson SW, Heuss ND, Roehrich H, Gregerson DS. 2006. Bystander killing of neurons by cytotoxic T cells specific for a glial antigen. Glia 53:457–466. [DOI] [PubMed] [Google Scholar]
- Mutnal MB, Cheeran MC, Hu S, Little MR, Lokensgard JR. 2010. Excess neutrophil infiltration during cytomegalovirus brain infection of interleukin‐10‐deficient mice. J Neuroimmunol 227:101–110. [DOI] [PMC free article] [PubMed] [Google Scholar]
- Mutnal MB, Cheeran MC, Hu S, Lokensgard JR. 2011a. Murine cytomegalovirus infection of neural stem cells alters neurogenesis in the developing brain. PLoS One 6:e16211. [DOI] [PMC free article] [PubMed] [Google Scholar]
- Mutnal MB, Hu S, Little MR, Lokensgard JR. 2011b. Memory T cells persisting in the brain following MCMV infection induce long‐term microglial activation via interferon‐gamma. J Neurovirol 17:424–437. [DOI] [PMC free article] [PubMed] [Google Scholar]
- Mutnal MB, Hu S, Lokensgard JR. 2012. Persistent humoral immune responses in the CNS limit recovery of reactivated murine cytomegalovirus. PLoS One 7:e33143. [DOI] [PMC free article] [PubMed] [Google Scholar]
- Neumann H. 2001. Control of glial immune function by neurons. Glia 36:191–199. [DOI] [PubMed] [Google Scholar]
- Phares TW, Ramakrishna C, Parra GI, Epstein A, Chen L, Atkinson R, Stohlman SA, Bergmann CC. 2009. Target‐dependent B7‐H1 regulation contributes to clearance of central nervous system infection and dampens morbidity. J Immunol 182:5430–5438. [DOI] [PMC free article] [PubMed] [Google Scholar]
- Phares TW, Stohlman SA, Hinton DR, Bergmann CC. 2013. Enhanced CD8 T‐cell anti‐viral function and clinical disease in B7‐H1‐deficient mice requires CD4 T cells during encephalomyelitis. J Neuroinflammation 9:269. [DOI] [PMC free article] [PubMed] [Google Scholar]
- Pittet CL, Newcombe J, Antel JP, Arbour N. 2011. The majority of infiltrating CD8 T lymphocytes in multiple sclerosis lesions is insensitive to enhanced PD‐L1 levels on CNS cells. Glia 59:841–856. [DOI] [PMC free article] [PubMed] [Google Scholar]
- Reddehase MJ, Mutter W, Munch K, Buhring HJ, Koszinowski UH. 1987. CD8‐positive T lymphocytes specific for murine cytomegalovirus immediate‐early antigens mediate protective immunity. J Virol 61:3102–3108. [DOI] [PMC free article] [PubMed] [Google Scholar]
- Reddehase MJ, Weiland F, Munch K, Jonjic S, Luske A, Koszinowski UH. 1985. Interstitial murine cytomegalovirus pneumonia after irradiation: Characterization of cells that limit viral replication during established infection of the lungs. J Virol 55:264–273. [DOI] [PMC free article] [PubMed] [Google Scholar]
- Sedgwick JD, Schwender S, Gregersen R, Dorries R, ter Meulen V. 1993. Resident macrophages (ramified microglia) of the adult brown Norway rat central nervous system are constitutively major histocompatibility complex class II positive. J Exp Med 177:1145–1152. [DOI] [PMC free article] [PubMed] [Google Scholar]
- Sharpe AH, Freeman GJ. 2002. The B7‐CD28 superfamily. Nat Rev Immunol 2:116–126. [DOI] [PubMed] [Google Scholar]
- Shrikant P, Benveniste EN. 1996. The central nervous system as an immunocompetent organ: Role of glial cells in antigen presentation. J Immunol 157:1819–1822. [PubMed] [Google Scholar]
- Stoddart CA, Cardin RD, Boname JM, Manning WC, Abenes GB, Mocarski ES. 1994. Peripheral blood mononuclear phagocytes mediate dissemination of murine cytomegalovirus. J Virol 68:6243–6253. [DOI] [PMC free article] [PubMed] [Google Scholar]
- Tsutsui Y, Kashiwai A, Kawamura N, Aiba‐Masago S, Kosugi I. 1995. Prolonged infection of mouse brain neurons with murine cytomegalovirus after pre‐ and perinatal infection. Arch Virol 140:1725–1736. [DOI] [PubMed] [Google Scholar]
- Vardjan N, Gabrijel M, Potokar M, Svajger U, Kreft M, Jeras M, de Pablo Y, Faiz M, Pekny M, Zorec R. 2012. IFN‐gamma‐induced increase in the mobility of MHC Class II compartments in astrocytes depends on intermediate filaments. J Neuroinflammation 9:144. [DOI] [PMC free article] [PubMed] [Google Scholar]