

Abstract
This study investigates cognitive deficits and alterations in resting state functional connectivity in civilian mild traumatic brain injury (mTBI) participants with high and low symptoms. Forty-one mTBI participants completed a resting state fMRI scan and the Automated Neuropsychological Assessment Metrics (ANAM) during initial testing (<10 days of injury) and a one month follow up. Data were compared to 30 healthy control subjects. Results from the ANAM demonstrate that mTBI participants performed significantly worse than controls on the code substitution delayed subtest (p=0.032) and weighted throughput score (p=0.001). Among the mTBI patients, high symptom mTBI participants performed worse than those with low symptoms on the code substitution delayed (p=0.017), code substitution (p=0.012), repeated simple reaction time (p=0.031), and weighted throughput score (p=0.009). Imaging results reveal that during the initial visit, low symptom mTBI participants had reduced interhemispheric functional connectivity (IH-FC) within the lateral parietal lobe (p=0.020); however, during follow up, high symptom mTBI participants showed reduced IH-FC compared to the control group within the dorsolateral prefrontal cortex (DLPFC) (p=0.013). Reduced IH-FC within the DLPFC during the follow-up was associated with reduced cognitive performance. Together, these findings suggest that reduced rs-FC may contribute to the subtle cognitive deficits noted in high symptom mTBI participants compared to control subjects and low symptom mTBI participants.
Keywords: resting state fMRI, mild TBI, Automated Neuropsychological Assessment Metrics, functional connectivity
Introduction
Traumatic brain injury (TBI) accounts for 1.7 million hospitalization in the United States each year (Faul et al., 2010). Seventy-five percent of these injuries are diagnosed as mild TBI (mTBI) which is characterized by a Glasgow Coma Scale (GCS) between 13 and 15 (Centers for Disease Control and Prevention (CDC), 2003). In most cases, somatic and cognitive symptoms resolve within the first few months following injury. Common deficits include impaired working memory (McAllister et al., 2006a; McDowell et al., 1997; Miotto et al., 2010) and reduced information processing speed (Hillary et al., 2010a; Johansson et al., 2009). Furthermore, a subset of these participants will continue to suffer from somatic symptoms and cognitive deficits indefinitely, a condition referred to as post concussive syndrome (PCS). This leads us to question whether those participants who develop PCS have unique cognitive deficits compared to both controls and mTBI participants without PCS.
There has been a recent emphasis in clinical research to use computerized cognitive batteries to measure cognitive impairments in various patient populations. Computerized cognitive assessments are more clinically feasible than traditional neuropsychological assessments because they can be administered and scored quickly by a trained examiner. In addition, computerized assessments have the advantage of being able to detect subtle changes in processing speed. However, while computerized cognitive assessments do have many advantages over traditional neuropsychological assessments, it is crucial to note that there are some drawbacks to these assessments. For example, there is greater variability in effort in taking the exam as well as the additional complication of new technologies that may be challenging to older participants. However, in spite of the drawbacks, computerized assessments do provide an effective means to capture various metrics relevant to our understanding of many aspects of cognition. One example of a computerized battery is the Automated Neuropsychological Assessment Metrics (ANAM) (Kane et al., 2007), where there is strong concordance between the measures of the ANAM and results of traditional neuropsychological assessments especially in the domains of processing speed, working memory, memory, and attention (Bleiberg et al., 1997; Kabat et al., 2001). This concordance renders the ANAM well suited for studies assessing cognitive deficits associated with TBI and other neurological disorders.
The ANAM has been effective in detecting cognitive deficits in multiple participant populations including multiples sclerosis (Pellicano et al., 2013), Alzheimer’s Disease (Levinson et al., 2005), and Parkison’s Disease (Hawkins et al., 2012). With respect to TBI, the ANAM has been most widely used with military populations (Ivins et al., 2009; Roebuck-Spencer et al., 2012; Vincent et al., 2008; Vincent et al., 2012) or sports concussions (Brown et al., 2007; Gysland et al., 2012). Based on this previous research, we selected the ANAM to assess deficits and possible recovery of cognitive performance in a civilian mTBI population.
It is currently difficult to predict who will go on to continue to suffer from cognitive symptoms as CT findings and conventional MR findings largely tend to be negative among this population. For example, one of the hallmarks of mTBI is diffuse axonal injury (DAI), the widespread damage to axonal structure throughout the brain as a result of strong shearing forces involved in the trauma. Unfortunately, DAI is often missed by CT and conventional MR imaging (Iverson et al., 2000; Lee et al., 2008). However, recent advances in MR imaging are able to characterize functional and structural alterations induced by mTBI which may aid the clinicians in accurate diagnosis and assist in the prediction of participant outcome following mTBI. Since this injury is diffuse in nature, it is likely that white matter connections across the brain will be disrupted. Recently, diffusion tensor imaging (DTI) has shown great promise in characterizing the structural damage to white matter tracts induced by DAI. Commonly damaged regions following mild TBI include the corpus callosum (Bazarian et al., 2007; Kumar et al., 2009; Mayer et al., 2010; Warner et al., 2010), internal and external capsule (Arfanakis et al., 2002; Bazarian et al., 2007), and cingulum bundles (Mac Donald et al., 2011) (See (Aoki Y, Inokuchi R, Gunshin M, Yahagi N, Suwa H., 2012) for a meta-analysis of DTI studies in mTBI). Therefore since many previous studies have reported damage to the corpus callosum following mTBI, our goal was to specifically assess if this reported damage to structural connections between the two hemispheres would have an effect on the large-scale functional networks involved in cognitive and sensory processing. Since resting state functional Magnetic Resonance Imaging (rs-fMRI) has the ability to address questions regarding functional connections between disparate regions determine efficiency and strength of neuronal networks (van den Heuvel and H. E. Hulshoff Pol, 2010), we selected to examine resting state functional connectivity (rs-FC) in our civilian mTBI participants. While previous evidence suggests that rs-FC is reduced following mTBI including within the Default Mode Network (DMN) (Johnson et al., 2012b; Mayer et al., 2011; Zhou et al., 2012) and the Task Positive Network (TPN) (Mayer et al., 2011; Shumskaya et al., 2012), we specifically chose to focus on inter-hemispheric functional connectivity (IH-FC) and its association with cognitive deficits as measured using the ANAM. Recent reports demonstrate reduced IH-FC among TBI participants following severe TBI (Marquez de la Plata et al., 2011), as well as sports related mTBI (Slobounov et al., 2011). Furthermore, damage to the corpus callosum as measured by magnetic resonance spectroscopy (1H-MRS) was found to be associated with reduced IH-FC in a population of mTBI participants (Johnson et al., 2012a). Similar to the aforementioned studies, we chose to examine IH-FC within the dorsolateral prefrontal cortex (DLPFC), the thalamus, lateral parietal lobe, and medial temporal lobe (MTL). We selected the DLPFC for its role in attention and executive processing, the thalamus because of it’s role in the brain as a relay system for modulating in sensory, the lateral parietal lobe which is part of the DMN (a network often associated with cognitive performance (Hampson et al., 2006)), and the MTL for its role in memory consolidation.
Our aim is to investigate the associations between ANAM measures and IH-FC during the initial and one month following injury in a civilian mTBI population. We hypothesized that mTBI participants will perform worse than a control population on the ANAM and that this performance will be associated with reduced IH-FC. Furthermore, we hypothesized that mTBI participants with a higher number of post concussive symptoms will perform worse on the ANAM and show greater reductions in functional measures compared to those with low symptoms and controls.
Materials and Methods
Participants
Forty-one consecutive mTBI participants (43.7+/−17.0yrs, 30 M) were prospectively recruited from the Adam Cowley Shock Trauma Center at the University of Maryland Medical Center as part of a larger protocol using a combination of advanced MR imaging and neuropsychological assessments, including the ANAM (Kane et al., 2007). For each visit, all MR imaging and neuropsychological assessments were performed on the same day. Data from the one month follow up of a subset of these participants (N=13) was included in a previous publication investigating the association between memory problems and rs-FC within the DMN and TPN (Sours et al., 2013). Thirty neurologically intact subjects (38.7+/−18.1yrs, 16 M) served as a control population. All participants were over the age of 18. Participants were screened and excluded for history of neurological and psychiatric illness, history of stroke, history of brain tumors or seizures, and contraindications to MR. In addition, control participants were screened and excluded for history of any TBI (mild, moderate or severe). mTBI participants were screened and excluded for any history of moderate or severe TBI. Seven mTBI participants (3 classified as low symptoms and 4 classified as high symptom) reported previous mild “concussions” but none of which occurred in the past 10 years. Only those mTBI participants with an admission GCS of 13–15 and mechanism of injury consistent with trauma were included in this study. In addition, participants were included based on one of two sets of criteria: (1) positive head CT or (2) loss of consciousness and/or amnesia and evidence of facial trauma consistent with TBI. Based on the inclusion criteria, this study included participants classified as complicated mTBI (positive head CT) and uncomplicated mTBI (negative head CT). Mechanisms of injury included 10 motor vehicle accidents, 8 assaults, 7 ground-level falls, 7 bicycle accidents, 3 sports related accidents, 2 above ground-level falls, 2 accidents of other mechanisms, and 2 accidents of unknown mechanism. The average GCS of the participants was 14.7, and 9 out of the 41 mTBI participants (22.0%) had evidence of injury based on the clinical CT as read by a board certified trauma radiologist (K.S.). Based on the clinical CT, on four of these participants there were small cortical contusions, four participants had subarachnoid hemorrhage and two of them had subdural hematomas (one participant had a small contusion and subarachnoid hemorrhage). Since conventional MR imaging (T1, T2, FLAIR, and SWI) is more sensitive than conventional CT for detecting subtle abnormalities (Yuh et al., 2013) our radiologist also examined the conventional MR images. MRI was positive on two participants who did not exhibit trauma related injuries based on conventional CT. These findings included a small cortical contusion, and one case of subarachnoid hemorrhage. This results in a study population containing 11 participants (27%) with either positive CT or positive MR findings.
All 41 mTBI participants participated in the rs-fMRI and neuropsychological assessments at the initial stage within 10 days post-injury (mean 7.7+/−2.4 days), and the one month follow up (mean 36.0+/−8.2 days). Control participants completed one imaging session; however, control participants completed the neuropsychological assessments at two time points approximately 6 months apart to account for both test-retest reliability and practice effects.
Due to participant motion during rs-fMRI (greater than 3mm translation or 3 degree rotation), rs-fMRI data from 3 control subjects, 5 mTBI participants (2 in the low symptom group/ 3 in the high symptom group) at the initial stage, and 1 mTBI participant (high symptom group) at the 1 month follow up was excluded from analysis. Therefore, the analysis presented is based on data from 27 control subjects, 36 mTBI patients at the initial stage and 40 mTBI patients at the 1 month follow up. Based on the recent evidence that rs-FC measures are highly impacted by motion (Power et al., 2012), in addition to excluding participants with excess motion, additional analysis of motion parameters was performed. To assess whether motion had a significant role, at each time point, average motion for each of the 6 motion parameters between the three groups (control, high symptom, and low symptom) were compared using ANOVAs.
Data was further analyzed to assess the difference in ANAM performance and imaging measures between mTBI participants with high and low levels of post concussive symptoms. The level of post concussive symptoms was determined by the scores obtained on the Modified Rivermead Post-Concussion Symptoms Questionnaire (RPQ) during the one month follow up. The RPQ asks participants to rate a series of common symptoms following TBI on a scale of 0–4 (King et al., 1995). The International Classification of Disease tenth revision (ICD10) symptom criteria defines PCS as the presence (self-report rating > 0) of three of more of following symptoms: headaches, dizziness, sleep, trouble concentrating, fatigue, memory problems, and irritability last longer than three months following injury (World Health Organization., 2010). However, since the participants in this study were evaluated at less than 3 months post injury and do not satisfy all of the criteria for PCS as established in the DSM-IV-TR criteria, we will refer to them as high symptoms group (three or more of the above RPQ symptoms) and low symptoms group (less than three of the above RPQ symptoms) at the one month follow up. Therefore, for further analysis, the mTBI participant group was subsequently divided into two cohorts consisting of a high symptom group (n=26) and a low symptom group (n=15) based on the RPQ. See Table 1 for demographics for participant populations.
Table 1.
Demographics
| Control | mTBI | p-value Control vs mTBI a | Low Symptom mTBI | High Symptom mTBI | p-value High vs Low Symptom b | |
|---|---|---|---|---|---|---|
| N | 30 | 41 | 15 | 26 | ||
| Age (yrs) | 38.67 ± 18.11 | 43.68 ± 16.98 | 0.236 | 41.80 ± 20.38 | 44.77 ± 14.98 | 0.627 |
| Education (yrs) | 15.10 ± 2.02 | 14.32 ± 2.72 | 0.192 | 15.27 ± 2.94 | 13.77 ± 2.49 | 0.090 |
| GCS | NA | 14.73 ± 0.59 | NA | 14.87 ± 0.35 | 14.65 ± 0.69 | 0.199 |
| Gender (M) | 16 | 30 | 0.086 | 13 | 17 | 0.146 |
| Positive CT | NA | 9 (22.0%) | NA | 4 (26.7%) | 5 (19.2%) | 0.591 |
| Days Since Injury Initial | NA | 7.66 ± 2.36 | NA | 6.67 ± 2.58 | 8.23 ± 2.07 | 0.039** |
| Days Since Injury 1 month | NA | 36.00 ± 8.18 | NA | 39.20 ± 10.96 | 34.15 ± 5.49 | 0.113 |
| MMSE Initial | 29.80 ± 0.61 | 29.28 ± 0.82 | 0.003** | 29.43 ± 0.76 | 29.19 ± 0.85 | 0.389 |
| MMSE 1 month | 29.40 ± 0.93 | 29.34 ± 1.02 | 0.805 | 29.60 ± 0.63 | 29.19 ± 1.17 | 0.155 |
| MACE Initial | 27.40 ±1.85 | 25.93 ± 4.22 | 0.053 | 26.67 ± 1.50 | 25.48 ± 5.21 | 0.294 |
| MACE 1 month | 28.07 ± 1.58 | 27.02 ± 3.51 | 0.099 | 27.13 ± 2.59 | 26.96 ± 4.00 | 0.883 |
| DRS 1 month | NA | 0.41 ± 0.91 | NA | 0.03 ± 0.13 | 0.63 ± 1.09 | 0.010** |
| GOSE 1 month | NA | 6.71 ± 1.72 | NA | 7.40 ± 1.12 | 6.31 ± 1.89 | 0.026** |
Based on t-tests between control and mTBI groups.
Based on t-tests between high symptom mTBI and low symptom mTBI groups.
Neuropsychological Assessment
All participants underwent neuropsychological assessment at each time point. Level of cognitive functioning was assessed by the administration of the Mini Mental State Exam (MMSE) (Folstein MF, Folstein SE, McHugh PR., 1975) and Military Initial Concussion Evaluation (MACE) (McCrea et al., 2000). Participant outcome was determined at the one month follow up by the Glasgow Outcome Scale Extended (GOSE) (Teasdale et al., 1998) and Disability Rating Scale (DRS) (Gouvier et al., 1987). In addition, the total score on the RPQ was determined and used as an overall measure of self-reported symptoms. Furthermore, the symptoms were divided into three broad classes including cognitive, somatic and neuropsychological (Dischinger et al., 2009). Total score in each symptom class was assessed.
ANAM Battery
The ANAM battery selected for this study consists of seven subtests assessing processing speed, working memory, memory, and attention. The ANAM subtests have been described in detail in a previous publication (Reeves et al., 2006). See Table 2 for list of subtests, abbreviations, and cognitive domains are assessed by ANAM.
Table 2.
ANAM Explanation
| Subtest | Abbreviation | Cognitive Domains |
|---|---|---|
| Simple Reaction Time | SRT | Processing speed |
| Code Substitution | CS | Visual search, sustained attention, working memory, processing speed |
| Procedural Reaction Time | PRT | Processing speed |
| Math | MATH | Computational skills, concentration, working memory |
| Match to Sample | MTS | Spatial processing, visuospatial working memory |
| Code Substitution Delayed | CSD | Sustained attention, working memory, short term memory and learning |
| Simple Reaction Time Repeat | SRT2 | Cognitive fatigue, processing speed |
The ANAM records reaction time and accuracy for each subtest, as well as a throughput score to arrive at a single measure encompassing both accuracy and reaction time. The exception to this is that the accuracy of the SRT and SRT2 subtests (simple reaction time tests) is set by default to 100%; therefore, the throughput scores for these two subtests represent only a measure of reaction time. The throughput score is a ratio between the number of correct answers and overall reaction time and has been shown to have greater sensitivity and reduced variability compared to reaction time or percent correct alone (Thorne D.R., 2006). Specifically the ANAM calculates the throughput score as the number of correct responses per the total time that the participant took to respond each time the stimulus appeared on the screen for each of the subsets (number correct response/minute) (Ivins et al., 2009). A higher throughput score indicates a faster, more accurate performance. Finally, a weighted throughput (WT-TH) was computed (previously referred to as the Index of Cognitive Efficiency), which is a weighted summary of the throughput scores from each of the subtests (Reich et al., 2005). The weighting was done so that the throughput score from each subtest contributed equally to the overall score. The precise equation used in this analysis is:
Mood and fatigue will also have an influence on cognitive performance (Reeves et al., 2007). Therefore, in addition to completing the cognitive portion of the ANAM, participants also completed the Sleepiness Index Scale and the Mood Scale portions of the ANAM battery. The Sleepiness Scale is a self reported measure of fatigue based on a 7-point scale (1–7 with higher values representing increased fatigue). The Mood Scale details a self-reported measure of mood based on a 7-point scale (0–6 with higher values representing increased strength of emotion) for vigor, restlessness, depression, anger, fatigue, anxiety, and happiness. Results for the Sleepiness Index Scale and the Mood Scale are reported as mean score for each representative group.
MR Imaging
MR Image Acquisition
Imaging was performed using a 3T Siemens Tim Trio Scanner (Siemens Medical Solutions; Erlangen, Germany) using a 12-channel receive only head coil. A high resolution T1-weighted-MPRAGE (TE = 3.44 ms, TR = 2250ms, TI = 900ms, flip angle = 9°, resolution = 256 × 256 × 96, FOV = 220 mm, sl. Thick. = 1.5 mm) was acquired for anatomic reference. Resting state fMRI was obtained using a T2*-weighted images using a single-shot EPI sequence (TE = 30 ms, TR =2000 ms, FOV = 220 mm, resolution = 64 × 64) with 36 axial slices (sl. thick. = 4 mm) over 5 min 42 s that yielded 171 volumes.
Rs-fMRI Processing
Preprocessing of the imaging data was performed in SPM 8 (http://www.fil.ion.ucl.ac.uk/spm). Preprocessing included motion correction of the time series, slice timing correction, band pass filtering (.009Hz < f < .08Hz), and registration of all the 171 volumes to the first volume of the time series. The resting state series were then registered to the individual’s T1-MPRAGE images and spatially normalized to standard space using the Montreal Neurological Institute (MNI) template available in SPM 8. The data was resampled to a spatial resolution of 2.0 mm isotropic. Spatial blurring was then applied to the resting state data using a 6mm Gaussian kernel. Individual T1-MPRAGE images in MNI space were segmented into white matter (WM), gray matter (GM) and cerebral spinal fluid (CSF) using SPM8. The segmented masks thus created were used to account for time series variance from the non-neuronal contributions of CSF and WM.
The CONN-fMRI Functional Connectivity toolbox v13.h (http://www.nitrc.org/projects/conn/) was used to process the resting state data (Whitfield-Gabrieli and A. Nieto-Castanon, 2012) The mean Blood Oxygen Level Dependent (BOLD) signal time series from the WM mask, CSF mask, and the 6 motion correction parameters were included in the model as regressors to remove the variance related to non-neuronal contributions and motion.
To calculate IH-FC, 5mm spherical ROIs were placed in the left and right thalamus centered at (+/−11, 18, 8), left and right lateral parietal centered at (−37, −62, 29) and (41, −62, 29), left and right MTL centered at (−20, −12, −20) and (22, −12, −20), and 10 mm spheres in the DLPFC centered at (−42,34,20) and (44,36,20) on the MNI template (Figure 1). The mean BOLD time series from the left ROI of each region was extracted and correlated with the time series of each voxel of the entire brain. Correlations were converted to normalized z-scores within the CONN-fMRI Functional Connectivity toolbox prior to further analysis. The average z-score of all voxels with the right ROI was extracted using the Rex toolbox within SPM to measure of IH-FC for the DLPFC, thalamus, lateral parietal and MTL. To visualize alterations in IH-FC, within group functional connectivity maps were created by using the average time series of the left hemisphere seed for the DLPFC, thalamus, lateral parietal, and MTL. Within group functional connectivity maps were thresholded at voxel-wise p-value of 0.001 (uncorrected) and cluster extent threshold of p-value of 0.001 using a family wise error correction for multiple comparisons. To test for voxel-wise difference in rs-FC between the three groups, between group functional connectivity maps were calculated using the average time series of the left hemisphere seed for the DLPFC, thalamus, lateral parietal, and MTL and were thresholded at voxel-wise p-value of 0.001 (uncorrected) and cluster extent threshold of p-value of 0.05 using a family wise error correction for multiple comparisons.
Figure 1.
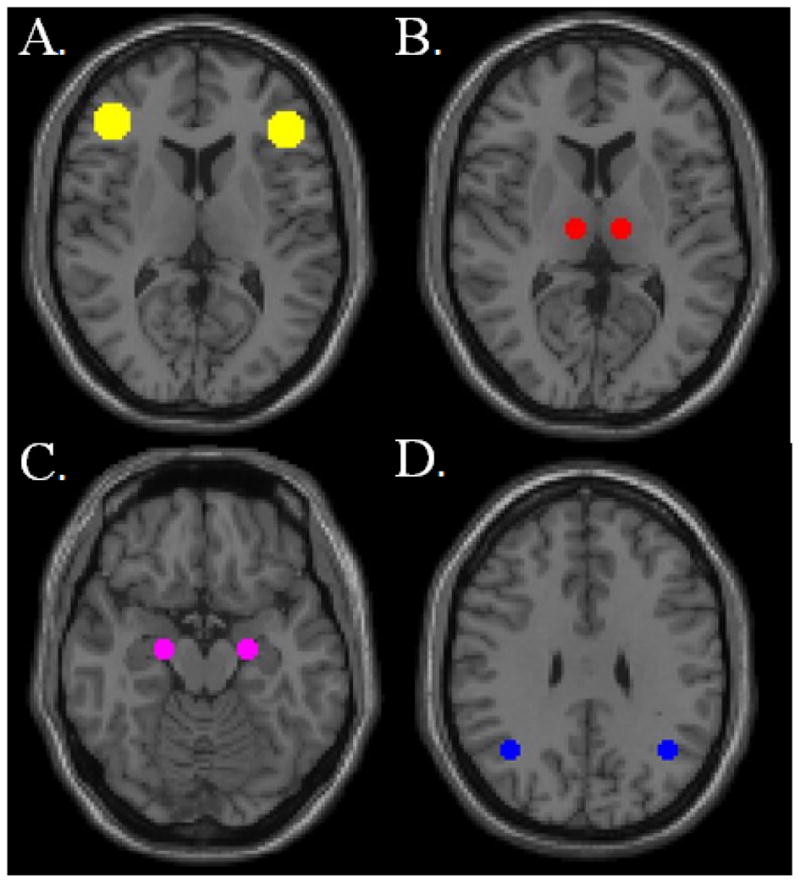
Visualization of regions of interest (ROIs) used to calculate average network interhemispheric functional connectivity (IH-FC). (A) dorsolateral prefrontal cortex (DLPFC) (B) thalamus (C) medial temporal lobe (MTL) and (D) lateral parietal lobe. ROIs are overlaid on MNI template.
Statistical Analysis
Statistical analysis was performed using SPSS (SPSS Inc. Released 2007. SPSS for Windows, Version 16.0. Chicago, SPSS Inc). Group differences in demographic data, Sleepiness Index Scale, and Mood Scale were tested using independent t-tests (either between controls and mTBI participants or between high symptom mTBI and low symptom mTBI). Within the control group, paired t-tests were used to determine within subject variability or practice effects for each ANAM subtest. A two-way mixed-design analysis of covariance (ANCOVA) model, which took into account age, and years of education was used to compute group differences in ANAM throughput scores. We included the two visits as a repeated measures within subject variable and group as the between subjects variable. We repeated the ANCOVA for both control versus mTBI and high symptom mTBI versus low symptom mTBI.
To determine differences in IH-FC we used a separate One-Way ANCOVA accounting for differences in age between groups at each time point to assess group differences between control, high symptom mTBI, and low symptom mTBI. Fisher’s least significant difference (LSD) test was used to correct for multiple comparisons.
Pair-wise associations within the mTBI population between IH-FC and WT-TH were calculated using Pearson’s partial correlations correcting for age and years of education at each time point (initial and one month follow ups separately). In an additional exploratory analysis we investigated pair-wise associations between IH-FC in different regions and each of the individual ANAM subtests using Pearson’s partial correlations correcting for age and years of education at each time point. Correlations shown are uncorrected for multiple comparisons.
Results
Participants
There was no difference in age (p=0.24) or education (p=0.19) between mTBI participants and control subjects; however there was a trend in gender with mTBI participants having a greater percentage of males (p=0.086) (Table 1). There was no difference in age (p=0.627), gender (p=0.146), education (p=0.090) or GCS between high symptom and low symptom mTBI. There was no significant difference in percentage of mTBI participants with intracranial bleed seen by CTs between the high and low symptoms mTBI groups (p=0.590). There was a significant difference between the mTBI groups in time since injury at the initial time point, with the average time delay in testing being longer for high symptom group post-injury (8.23d +/−2.07) than for the low symptom group (6.67d +/−2.58; p=0.04). Time since injury at the initial time point was not significantly different between the two mTBI groups (p=0.11).
Neuropsychological Assessment
There was a significant difference in performance on the MMSE between mTBI participants and controls at the initial time point (p=0.003), but not at the one month follow up (p=0.389) (Table 1). There was a trend towards reduced performance among the mTBI participants on the mental status section of the MACE at the initial (p=0.053) and one month follow up (p=0.099). We observed no significant difference on the MMSE or MACE between high and low symptom mTBI participants at either time point. However, there was a significant difference in participant outcome measures of GOSE and DRS with the high symptom mTBI participants demonstrating reduced GOSE score (p=0.026) and increase DRS score (p=0.010). As predicted, the high symptom mTBI participants scored higher on self-reported symptoms for all three symptom domains, cognitive, somatic and neuropsychological (all p values <0.01 for initial and p <0.001 for 1 month follow up) (see Table 3).
Table 3.
RPQ Scores
| High Symptom mTBI | Low Symptom mTBI | p-value a | |
|---|---|---|---|
| RPQ Total Initial | 23.4+/−18.8 | 6.6+/−8.1 | 0.002 |
| Somatic Total Initial | 11.8+/−10.5 | 2.8+/−3.7 | 0.005 |
| Cognitive Total Initial | 5.1+/−4.3 | 1.5 +/−2.6 | 0.005 |
| Neuropsyc Total Initial | 6.5+/−5.2 | 2.2+/−2.7 | 0.003 |
| RPQ Total 1 month | 22.2+/−15.1 | 2.47+/−3.0 | < 0.001 |
| Somatic Total 1 month | 8.9+/−7.9 | 0.9+/−2.0 | < 0.001 |
| Cognitive Total 1 month | 6.2+/−3.8 | 0.5+/−1.0 | < 0.001 |
| Neuropsyc Total 1 month | 7.2 +/−3.8 | 1.0+/−1.9 | < 0.001 |
Based on t-tests between high symptom mTBI and low symptom mTBI groups.
The results of the analysis of the Mood Scale during the initial visit suggests that compared to control subjects, mTBI participants tended to report reduced vigor and happiness and increased restlessness, depression, and anxiety. At the one month follow up, mTBI participants report increased restlessness, depression, and anxiety. No differences between the groups were noted on the Sleep Index score. During the initial visit, the high symptom mTBI participants reported reduced vigor and increased restlessness. At the one month follow up, high symptom mTBI participants continued to report reduced vigor and but also happiness. At both time points high symptom mTBI participants report an increased Sleep Index score suggesting increased fatigue among these participants (Table 4).
Table 4.
Mood Scale and Sleepiness Index Scale
| Control | mTBI | p-value Control vs mTBI a | Low Symptom mTBI | High Symptom mTBI | p-value High vs Low Symptom b | |
|---|---|---|---|---|---|---|
| Initial Visit | ||||||
| Vigor | 3.7 +/− 1.2 | 2.9 +/−1.3 | 0.014* | 3.6 +/− 1.0 | 2.5 +/− 1.3 | 0.006* |
| Restlessness | 0.6 +/− 0.4 | 1.1 +/− 1.1 | 0.006* | 0.6 +/− 0.7 | 1.3 +/− 1.2 | 0.038* |
| Depression | 0.3 +/− 0.5 | 0.7 +/− 1.0 | 0.023* | 0.4 +/− 0.7 | 0.9 +/− 1.2 | 0.166 |
| Anger | 0.3 +/− 0.7 | 0.6 +/− 1.0 | 0.106 | 0.3 +/− 0.4 | 0.8 +/− 1.7 | 0.083 |
| Fatigue | 1.4 +/− 0.7 | 1.9 +/− 1.4 | 0.096 | 1.4 +/− 1.2 | 2.1 +/− 1.4 | 0.104 |
| Anxiety | 0.3 +/− 0.5 | 0.8 +/− 1.0 | 0.006* | 0.6 +/− 0.6 | 1.0 +/− 1.2 | 0.282 |
| Happiness | 4.3 +/− 1.1 | 3.7 +/− 1.3 | 0.035* | 4.1 +/− 1.1 | 3.4 +/− 1.4 | 0.096 |
| Sleep Index | 2.4 +/− 1.0 | 2.3 +/− 1.3 | 0.703 | 1.7 +/− 0.6 | 2.6 +/− 1.4 | 0.030* |
| 1 month | ||||||
| Vigor | 3.1 +/− 1.3 | 3.0 +/− 1.3 | 0.588 | 3.7 +/− 1.3 | 2.6 +/− 1.2 | 0.006* |
| Restlessness | 0.4 +/− 0.6 | 1.0 +/− 1.1 | 0.024* | 0.6 +/− 0.8 | 1.2 +/− 1.3 | 0.081 |
| Depression | 0.3 +/− 0.5 | 0.7 +/− 1.0 | 0.033* | 0.4 +/− 0.4 | 0.9 +/− 1.1 | 0.096 |
| Anger | 0.3 +/− 0.4 | 0.6 +/− 0.8 | 0.077 | 0.3 +/− 0.5 | 0.7 +/− 1.0 | 0.078 |
| Fatigue | 1.9 +/− 1.3 | 1.6 +/− 1.3 | 0.339 | 1.1 +/− 1.1 | 1.8 +/− 1.4 | 0.082 |
| Anxiety | 0.3 +/− 0.6 | 0.8 +/− 1.0 | 0.028* | 0.4 +/− 0.7 | 1.0 +/− 1.1 | 0.069 |
| Happiness | 4.3 +/− 0.9 | 3.8 +/− 1.3 | 0.117 | 4.5+/− 1.1 | 3.4 +/− 1.3 | 0.008* |
| Sleep Index | 2.5 +/− 1.3 | 2.5 +/− 1.3 | 0.968 | 1.9 +/− 0.9 | 2.9 +/− 1.3 | 0.013* |
Based on t-tests between control and mTBI groups.
Based on t-tests between high symptom mTBI and low symptom mTBI groups.
ANAM Battery
No significant differences in performance on any of the ANAM subsets or WT-TH between the two visits (all p values > 0.05) were among the control group suggesting no practice effects on the ANAM over a one month follow up period.
ANAM performance (as measured by the weighted throughput score at the initial stage) was negatively correlated with age (R=−0.625, p < 0.001) and years of education (R= 0.291, p= 0.015); therefore, age and years of education were included as covariates in analysis of ANAM measures. Based on the results of the two-way mixed-design ANCOVA, MTBI participants performed significantly worse than control subjects on the CSD (p=0.032) and WT-TH (p=0.001) (Table 5). In addition, there was a non-significant trend in the within subjects factor (between visits) for the MTS subtest (p=0.064) suggesting an improvement in performance of this subtest between visits. Furthermore, results between high symptom and low symptom mTBI participants demonstrate that high symptom mTBI participants perform worse than the low symptom mTBI participants on the CSD (p=0.017), CS (p=0.012), SRT2 (p=0.031), and WT-TH (p=0.009). In addition, both the mTBI groups demonstrated recovery in the MTS (p=0.034) and CSD (p=0.025) performance between the initial and 1 month follow ups (Table 6). None of the interaction terms between any of these subsets were significant.
Table 5.
ANAM Results mTBI versus Control
| Control V1 | Control V2 | mTBI Initial | mTBI 1 month | B/n Subjects P-value a | W/in Subjects p-value a | |
|---|---|---|---|---|---|---|
| CS-TH | 51.3 +/−15.0 | 52.1 +/−13.7 | 43.9+/−14.7 | 45.8+/−11.9 | 0.185 | 0.121 |
| CSD-TH | 43.6+/−18.9 | 48.2+/−17.8 | 31.6+/−13.8 | 38.8+/−17.0 | 0.032 | 0.506 |
| MTS-TH | 33.9+/−11.9 | 32.9+/−10.7 | 27.2+/−11.0 | 30.0+/−8.7 | 0.354 | 0.064 |
| MATH-TH | 24.7+/−7.7 | 23.5+/−8.5 | 20.9+/−6.6 | 21.0+/−6.9 | 0.262 | 0.469 |
| PRT-TH | 100.0+/−17.5 | 98.1+/−17.8 | 89.8+/−17.1 | 97.9+/−16.2 | 0.759 | 0.244 |
| SRT-TH | 221.9+/−37.9 | 220.3+/−46.8 | 199.3+/−53.9 | 211.8+/−42.4 | 0.521 | 0.106 |
| SRT2-TH | 219.5+/−45.3 | 225.8+/−47.3 | 202.2+/−47.8 | 210.8+/−36.2 | 0.525 | 0.214 |
| WT-TH | 218.7 +/−46.4 | 220.2+/−46.9 | 184.0+/−41.3 | 179.9+/−41.9 | 0.001 | 0.485 |
Based on results of the two-way mixed-design ANCOVA which included the two visits as a repeated measures within subject variable and group (mTBI vs control) as the between subjects variable. Age and years of education were included in the model as covariates.
Table 6.
ANAM Results High Symptom mTBI versus Low Symptom mTBI
| High Symptom Initial | High Symptom 1 month | Low Symptom Initial | Low Symptom 1 month | B/n Subjects P-value a | W/in Subjects p-value a | |
|---|---|---|---|---|---|---|
| CS-TH | 40.6+/−13.8 | 42.2+/−10.2 | 49.7+/−14.8 | 51.9+/−12.6 | 0.012 | 0.259 |
| CSD-TH | 21.8+/−12.3 | 33.6+/−14.6 | 37.7+/−14.5 | 47.9+/−17.5 | 0.017 | 0.025 |
| MTS-TH | 24.3+/−10.3 | 27.8+/−8.7 | 32.2+/−10.5 | 33.7+/−7.8 | 0.112 | 0.034 |
| MATH-TH | 20.6+/−6.8 | 20.5+/−7.5 | 21.4+/−6.4 | 21.9+/−5.8 | 0.650 | 0.804 |
| PRT-TH | 87.3+/−15.5 | 93.6+/−16.9 | 94.3+/−19.3 | 105.2+/−12.3 | 0.128 | 0.656 |
| SRT-TH | 189.9+/−56.2 | 205.2+/−47.4 | 215.6+/−47.0 | 223.4+/−30.1 | 0.258 | 0.185 |
| SRT2-TH | 188.9+/−51.4 | 200.0+/−35.7 | 225.4+/−30.3 | 229.6+/−29.5 | 0.031 | 0.525 |
| WT-TH | 172.7+/−41/2 | 167.1+/−39.2 | 203.6+/−34.7 | 202.1+/−37.9 | 0.009 | 0.906 |
Based on results of the two-way mixed-design ANCOVA which included the two visits as a repeated measures within subject variable and group (high symptom vs low symptom) as the between subjects variable. Age and years of education were included in the model as covariates.
IH-FC
Based on the results of the one-way ANCOVA, there was no difference among the three groups (control, high symptom mTBI and low symptom mTBI) in IH-FC in DLPFC (F=1.411, p=0.252), thalamus (F=1.002, p=0.374), or MTL (F=1.035, p=0.361) during the initial visit. However, based on the results of the one-way ANCOVA, there was a significant difference between the three groups in the lateral parietal lobe (F=3.517, p=0.036). Post-hoc tests revealed low symptom mTBI participants had significantly lower IH-FC within the lateral parietal lobe compared to the control group (p=0.020). There was also a trend in reduced IH-FC in the high symptom mTBI group compared to the control group (p=0.052) (Figure 2A).
Figure 2.

ROI analysis of group differences in interhemispheric functional connectivity (IH-FC) within the dorsolateral prefrontal cortex (DLPFC), thalamus, lateral parietal lobe, and medial temporal lobe (MTL). (A) Initial stage (B) 1 month follow up. Significance assessed using separate One-Way ANCOVA accounting for differences in age between groups at each time point to assess group differences between control, high symptom mTBI, and low symptom mTBI. Fisher’s least significant difference (LSD) test was used to correct for multiple comparisons. # p <0.10, * p <0.05.
At the one month follow up, there was a significant group difference between the three groups in IH-FC in the DLPFC (F=3.759, p=0.029) but not in the thalamus (F=1.517, p= 0.288), MTL (F=1.908, p=0.157), or the lateral parietal lobe (F=2.041, p=0.138). Post-hoc tests revealed that high symptom mTBI participants have reduced IH-FC in the DLPFC compared to control subjects (p =0.013), while there is only a trend in reduced IH-FC in low symptom mTBI participants when compared to control subjects (p=0.061) (Figure 2B).
Between Group Functional Connectivity Maps
There were no regions of significant differences in rs-FC for the DLPFC or MTL between any of the groups at either time point. During the initial visit, an increased connectivity between the left lateral parietal in the control group compared to the high symptom group was observed in the left orbitofrontal cortex (Figure 3A). Increased connectivity was noted between the left lateral parietal in the control group compared to the low symptom group in the right lateral parietal (Figure 3B). No differences in functional connectivity with the left lateral parietal lobe were noted between the high symptom group and low symptom group. Interestingly, at the 1 month follow up, increased functional connectivity between the left thalamus and cortical regions including the right insula, right primary somatosensory cortex, and right somatosensory association area was observed in the high symptom group compared to the low symptom group (Figure 4).
Figure 3.

Visualization of the between group functional connectivity maps for the left lateral parietal ROI during the initial visit. Warm colors represent regions of increased rs-FC in the control group compared to (A) the high symptom mTBI group and(B) the low symptom mTBI group. Functional connectivity maps were thresholded at voxel-wise p-value of 0.001 (uncorrected) and cluster extent threshold of p-value of 0.05 using a family wise error correction for multiple comparisons. Results are overlaid on MNI template.
Figure 4.
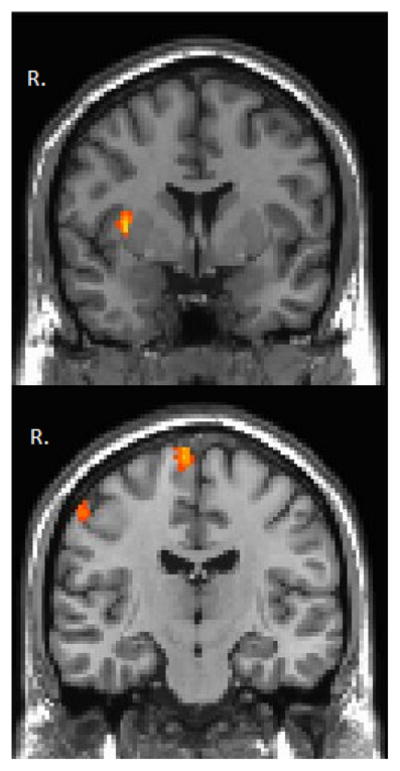
Visualization of the between group functional connectivity maps for the left thalamus parietal ROI during the 1 month follow up. Warm colors represent regions of increased rs-FC in the high symptom mTBI group compared to the low symptom mTBI group. Functional connectivity maps were thresholded at voxel-wise p-value of 0.001 (uncorrected) and cluster extent threshold of p-value of 0.05 using a family wise error correction for multiple comparisons. Results are overlaid on MNI template.
fMRI Motion Analysis
Comparison of average motion parameters for each of the groups at each time point are shown in Supplemental Figure 1. Significant difference in the average translation in the y direction (F=3.35, p=0.042) was observed during the initial visit. There were no statistically significant differences in the average motion parameters between the three groups during the 1 month time point. However, in order to further ensure that results reported in regards to differences in IH-FC between the three groups are not effected by this y-direction translation, Pearson’s correlations between the translation in the y direction and the IH-FC determined for each region were calculated. There were no significant correlations between IH-FC and translation in the y direction. Scatter plots for correlations are shown in Supplemental Figure 2.
Correlations between Imaging and ANAM
There were no significant correlations noted between IH-FC and ANAM WT-TH score within the control group or the mTBI participants at the initial stage. However, at the one month follow up, mTBI participants demonstrated significant positive correlations between the IH-FC within the DLPFC and the WT-TH (R=0.438, p=0.010) (Figure 5). In the exploratory investigation looking into associations between IH-FC and the individual subtests, mTBI patients demonstrated significant positive correlations between the IH-FC within the parietal lobe and the MATH throughput score (R=0.448, p=0.010) and IH-FC within the DLPFC and the MTS throughput score (R=0.395, p=0.025) during the initial visit. Positive correlations were found between the IH-FC within the DLPFC and the MATH throughput score (R=0.335, p=0.040) during the one month follow up.
Figure 5.

Correlations between rs-FC and weighted throughput scores of the ANAM (WT-TH) during the 1 month follow up in mTBI participants only. (A) Scatter plot between IH-FC DLPFC and WT-TH. Significance assessed Pearson’s partial correlations correcting for age and years of education.
Discussion
This study demonstrates that the ANAM is able to detect subtle changes in neurocognitive performance following mTBI, and that IH-FC is a sensitive measure to distinguish high symptom mTBI participants from a control population. The results of our study lead to three main conclusions regarding mTBI and cognitive performance. First, as a whole, mTBI participants perform worse on measures of cognitive performance, specifically demonstrating deficits in immediate memory as measured by reduced performance on the CSD subtest. However, high symptom mTBI participants also noted unique deficits in measures of information processing and increased levels of cognitive fatigue as measured by reduced performance in the CS and SRT2 subtests respectively. Second, mTBI participants exhibited reduced IH-FC in the lateral parietal lobe in the initial stage, but reduced IH-FC in the DLPFC during the one month follow up. Finally, during the one month follow up, an association between the reduced IH-FC within the DLPFC and impaired cognitive performance on the ANAM was observed suggesting an association between imaging measures and cognitive performance in mTBI participants.
Neurocognitive Performance
Results from this study demonstrate that as a whole mTBI participant have significantly lower scores on the CSD subtest as well as the WT-TH. MTBI participants often report deficits in both sustained attention (Maruishi et al., 2007) and working memory (McAllister et al., 2006b; McDowell et al., 1997; Miotto et al., 2010), hence it is not surprising that mTBI participants in this study would show deficits in the CSD subtest which assess these cognitive domains. Furthermore, because the cognitive deficits following mTBI are often subtle, the WT-TH score may be an ideal measure to determine cognitive impairment following mTBI as it encompasses several aspects of the cognitive measure.
Results from the ANAM demonstrate that in addition to deficits in overall performance and memory, high symptom mTBI participants also have deficits in processing speed and visual attention as indicated by reduced performance on the CS subtest. In addition, high symptom mTBI participants performed worse on the SRT2 subtest, which is administered towards the end of the computerized tests to obtain a measure of cognitive fatigue. Reduced information processing is a common symptom following mTBI (Hillary et al., 2010b; Johansson et al., 2009), and may contribute to the cognitive fatigue noted on the high symptom mTBI participants in this study. Further, this is supported by other neuroimaging studies that have demonstrated that mTBI participants have increased activations during cognitive tasks indicating that mTBI participants must put forth greater mental effort to complete tasks, contributing to greater cognitive fatigue (McAllister et al., 2001). There are noted differences in the self reported Mood and Sleepiness Index Scales between the high symptom and low symptom groups. Since cognitive performance may be influenced by mood and levels of fatigue the results of this study must be interpreted in the context of this limitation.
It is important to note that recent research has raised concerns that the ANAM fails to detect cognitive deficits in mTBI participants when assessed at greater than 10 days post injury (Coldren et al., 2012). While our results do demonstrate minimal cognitive deficits in the mTBI group within the one month post injury time frame with only reduced performance in the CS subtest, our results do show multiple cognitive deficits in mTBI participants who report high symptoms compared to those with low symptoms. This suggests that while the ANAM may not be sensitive enough to detect all of the subtle cognitive deficits associated with a mild head injury, the ANAM does appear sensitive enough to detect deficits present in mTBI participants with high symptoms.
IH-FC
MTBI has been shown to reduce rs-FC in multiple networks including IH-FC (Slobounov et al., 2011) the TPN (Mayer et al., 2011; Shumskaya et al., 2012), and the DMN (Johnson et al., 2012b; Mayer et al., 2011; Zhou et al., 2012), but simaltaneously increase rs-FC between network (Mayer et al., 2011; Sours et al., 2013). Our results are consistent with these findings of reduced IH-FC. For example, our results extend those of Slobounov and colleagues who noted reduced IH-FC in the DLPFC networks in the initial stage (around 10 days post injury) in a population of concussed athletes. Although, unlike Slobounov and colleagues, our data did not show reduced IH-FC within the MTL (or hippocampal network), based on our ROI analysis, our data does show reduced IH-FC within the lateral parietal lobe during the initial stage. This reduction in IH-FC within the lateral parietal lobe was confirmed by our between group rs-FC map during the initial visit (Figure 3B). Once the lateral parietal lobes in both hemispheres are main nodes of the DMN, this finding is consistent with previous studies noting reduced rs-FC within the DMN (Johnson et al., 2012b; Mayer et al., 2011; Zhou et al., 2012). Furthermore, these results suggests that the temporal pattern of altered rs-FC may vary among networks across the brain, with the lateral parietal lobe (associated with the DMN) showing some recovery by the one month follow up while alterations in the DLPFC IH-FC do not.
The combination of the findings from the study in athletes and those from this study on civilian mTBI appear to suggest that the changes in resting state networks are present across the first month following injury. Furthermore, once the reduction in IH-FC within the DLPFC at the one month follow up is associated with reduced performance on the ANAM, this may indicate that the alterations noted by Slobounov and colleagues in IH-FC may still be present at one month following injury. This finding stresses the importance of future studies to longitudinally assess functional changes in mTBI participants and to examine how these changes are associated with post concussive symptoms and cognitive performance.
While other groups have found alterations in thalamic functional connectivity following mTBI (Tang et al., 2011), our participants did not demonstrate altered IH-FC within the thalamus. However, similar to previous results, our between group rs-FC maps do demonstrate increased rs-FC between the thalamus and the cortex, in the high symptom mTBI group compared to those with low symptoms (Figure 4). Since many of the post concussive symptoms are somatic in nature, it is intriguing that those with more symptoms have increased thalamo-cortical connectivity. In addition, the thalamus consists of multiple nuclei with connections to various regions of the cortex and is, therefore, not a homogeneous structure. Further analysis is needed to determine if rs-FC within the thalamo-cortical connections of specific thalamic nuclei is altered, and how these alterations are associated with both cognitive performance as measured by the ANAM and somatic symptoms as well.
Limitations
One of the main limitations of this study is that mTBI participants were not followed into the chronic stages of injury. Alterations in rs-FC following TBI have been noted in the chronic stage, and it will be important to determine in the future how these functional alterations are associated with cognitive performance as measured by the ANAM. Another potential limitation is that the mTBI population in this study contains complicated and uncomplicated mTBI participants. Although there was no significant difference in percentage of positive CT and/or MRI participants in the high symptom group compared to the low symptom group, it is possible that the sequalae of injury among complicated mTBI participants may differ from the uncomplicated mTBI participants. It should be noted that the grouping of participants was driven by post concussive symptoms and that the resulting difference in the distribution of complicated mTBI participants into the two groups was not significant.
An additional limitation is that our results are based upon a single cognitive assessment, the ANAM. While there is no ideal test for assessing mTBI, and every available computerized assessment has its advantages and disadvantages, we believe that the ability of the ANAM to detect such subtle changes in cognitive performance in the mTBI population makes it a useful tool in mTBI research in the civilian population. A final limitation is that in the initial stage, mTBI with high symptoms were scanned at a later time point since injury than those with low symptoms (8 days compared to 6 days). However, since the majority of the differences between the two populations persist into the one month follow ups of injury when there was no difference in time when the imaging and ANAM data was obtained since injury, we do not believe that this difference at the timing of the initial stage scan had an impact on our results. While the results of this study are compelling, given the fact that MTBI is a very heterogeneous injury, generalization of the results to the mTBI population must be treated with caution prior to verifying the findings of this study on a larger set of mTBI patients from multiple centers.
Conclusions
In conclusion, our results demonstrate that the ANAM is able to detect subtle cognitive deficits in a civilian mTBI population in the early stages of injury as well as able to detect specific cognitive deficits indicating reduced processing speed and increased cognitive fatigue in mTBI participants suffering from extensive post concussive symptoms. Furthermore, our data demonstrate that the reduction in overall cognitive performance noted in mTBI participants is associated with altered communication between neural networks as measured by reduced IH-FC of the DLPFC. These results stress the importance of monitoring the recovery of mTBI with both extensive cognitive evaluations and advanced neuroimaging methods to aid in the development of better prognostic markers for post concussive syndrome.
Supplementary Material
Comparison of mean motion parameters for the three groups. Bar graphs of the mean of the 6 motion parameters for the three groups (control, low symptom mTBI, high symptom mTBI) for (A) the initial visit and (B) the 1 month follow up. Significance assessed using separate One-Way ANOVA between groups at each time point to assess group differences between the three groups. * p <0.05.
Scatter plot of the mean translation in the y direction versus IH-FC within the dorsolateral prefrontal cortex (DLPFC), thalamus, lateral parietal lobe, and medial temporal lobe (MTL). Data is shown for all rs-fMRI scans (control at one visit and high symptom mTBI and low symptom mTBI at the initial and 1 month follow up). Significance assessed Pearson’s bivariate correlations.
Acknowledgments
The authors would like to thank Joshua Betz, Jacqueline Janowich and Teodora Stoica for their help with participant recruitment and George Makris for his help with acquiring and processing the data. This study was supported by DOD award W81XWH-08-1-0725 and W81XWH- 12-1-0098. Chandler Sours was partly supported by an NRSA Grant from the National Institute of Neurological Disorders and Stroke (1F31NS081984)
Abbreviations
- ANAM
Automated Neuropsychological Assessment Metrics
- DAI
diffuse axonal injury
- DLPFC
dorsolateral prefrontal cortex
- DMN
Default Mode Network
- DRS
Disability Rating Scale
- IH-FC
interhemspheric functional connectivity
- GOSE
Glasgow Outcome Scale Extended
- MACE
Military Initial Concussion Evaluation
- MMSE
Mini Mental Status Exam
- mTBI
mild traumatic brain injury
- PCS
Post concussive syndrome
- RPQ
Rivermead Post Concussion Symptoms Questionnairre
- rs-FC
resting state functional connectivity
- rs-fMRI
resting state functional MRI
- TPN
Task Positive Network
Contributor Information
Chandler Sours, Email: csour001@umaryland.edu.
Joseph Rosenberg, Email: jrosenberg2@umm.edu.
Robert Kane, Email: kaner@georgetown.edu.
Steve Roys, Email: sroys@umm.edu.
Jiachen Zhuo, Email: jzhuo@umm.edu.
Kathirkamanthan Shanmuganathan, Email: kshanmuganathan@umm.edu.
References
- Aoki Y, Inokuchi R, Gunshin M, Yahagi N, Suwa H. Diffusion tensor imaging of mild traumatic brain injury: a meta-analysis. J Neurol Neurosurg Psychiatry. 2012;83:870–876. doi: 10.1136/jnnp-2012-302742. [DOI] [PMC free article] [PubMed] [Google Scholar]
- Arfanakis K, Haughton VM, Carew JD, Rogers BP, Dempsey RJ, Meyerand ME. Diffusion tensor MR imaging in diffuse axonal injury. AJNR Am J Neuroradiol. 2002;23:794–802. [PMC free article] [PubMed] [Google Scholar]
- Bazarian JJ, Zhong J, Blyth B, Zhu T, Kavcic V, Peterson D. Diffusion tensor imaging detects clinically important axonal damage after mild traumatic brain injury: a pilot study. J Neurotrauma. 2007;24:1447–1459. doi: 10.1089/neu.2007.0241. [DOI] [PubMed] [Google Scholar]
- Bleiberg J, Garmoe WS, Halpern EL, Reeves DL, Nadler JD. Consistency of within-day and across-day performance after mild brain injury. Neuropsychiatry Neuropsychol Behav Neurol. 1997;10:247–253. [PubMed] [Google Scholar]
- Brown CN, Guskiewicz KM, Bleiberg J. Athlete characteristics and outcome scores for computerized neuropsychological assessment: a preliminary analysis. J Athl Train. 2007;42:515–523. [PMC free article] [PubMed] [Google Scholar]
- Centers for Disease Control and Prevention (CDC); National Center for Injury Prevention and Control. Report to Congress on mild traumatic brain injury in the United States: steps to prevent a serious public health problem. Atlanta, GA: Centers for Disease Control and Prevention; 2003. [Google Scholar]
- Coldren RL, Russell ML, Parish RV, Dretsch M, Kelly MP. The ANAM lacks utility as a diagnostic or screening tool for concussion more than 10 days following injury. Mil Med. 2012;177:179–183. doi: 10.7205/milmed-d-11-00278. [DOI] [PubMed] [Google Scholar]
- Dischinger PC, Ryb GE, Kufera JA, Auman KM. Early predictors of postconcussive syndrome in a population of trauma patients with mild traumatic brain injury. J Trauma. 2009;66:289–96. doi: 10.1097/TA.0b013e3181961da2. discussion 296–7. [DOI] [PubMed] [Google Scholar]
- Faul M, Xu L, Wald M, Coronado V. Traumatic brain injury in the United States: emergency department visits, hospitalizations, and deaths. Center of Disease Control; 2010. [Google Scholar]
- Folstein MF, Folstein SE, McHugh PR. “Mini-mental state”. A practical method for grading the cognitive state of patients for the clinician. Journal of Psychiatric Research. 1975;12:189–198. doi: 10.1016/0022-3956(75)90026-6. [DOI] [PubMed] [Google Scholar]
- Gouvier WD, Blanton PD, LaPorte KK, Nepomuceno C. Reliability and validity of the Disability Rating Scale and the Levels of Cognitive Functioning Scale in monitoring recovery from severe head injury. Arch Phys Med Rehabil. 1987;68:94–97. [PubMed] [Google Scholar]
- Gysland SM, Mihalik JP, Register-Mihalik JK, Trulock SC, Shields EW, Guskiewicz KM. The relationship between subconcussive impacts and concussion history on clinical measures of neurologic function in collegiate football players. Ann Biomed Eng. 2012;40:14–22. doi: 10.1007/s10439-011-0421-3. [DOI] [PubMed] [Google Scholar]
- Hampson M, Driesen NR, Skudlarski P, Gore JC, Constable RT. Brain connectivity related to working memory performance. J Neurosci. 2006;26:13338–13343. doi: 10.1523/JNEUROSCI.3408-06.2006. [DOI] [PMC free article] [PubMed] [Google Scholar]
- Hawkins KA, Jennings D, Vincent AS, Gilliland K, West A, Marek K. Traditional neuropsychological correlates and reliability of the automated neuropsychological assessment metrics-4 battery for Parkinson’s disease. Parkinsonism Relat Disord. 2012;18:864–870. doi: 10.1016/j.parkreldis.2012.04.021. [DOI] [PubMed] [Google Scholar]
- Hillary FG, Genova HM, Medaglia JD, Fitzpatrick NM, Chiou KS, Wardecker BM, Franklin RG, Jr, Wang J, DeLuca J. The nature of processing speed deficits in traumatic brain injury: is less brain more? Brain Imaging Behav. 2010a;4:141–154. doi: 10.1007/s11682-010-9094-z. [DOI] [PubMed] [Google Scholar]
- Hillary FG, Genova HM, Medaglia JD, Fitzpatrick NM, Chiou KS, Wardecker BM, Franklin RG, Jr, Wang J, DeLuca J. The nature of processing speed deficits in traumatic brain injury: is less brain more? Brain Imaging Behav. 2010b;4:141–154. doi: 10.1007/s11682-010-9094-z. [DOI] [PubMed] [Google Scholar]
- Iverson GL, Lovell MR, Smith S, Franzen MD. Prevalence of abnormal CT-scans following mild head injury. Brain Inj. 2000;14:1057–1061. doi: 10.1080/02699050050203559. [DOI] [PubMed] [Google Scholar]
- Ivins BJ, Kane R, Schwab KA. Performance on the Automated Neuropsychological Assessment Metrics in a nonclinical sample of soldiers screened for mild TBI after returning from Iraq and Afghanistan: a descriptive analysis. J Head Trauma Rehabil. 2009;24:24–31. doi: 10.1097/HTR.0b013e3181957042. [DOI] [PubMed] [Google Scholar]
- Johansson B, Berglund P, Ronnback L. Mental fatigue and impaired information processing after mild and moderate traumatic brain injury. Brain Inj. 2009;23:1027–1040. doi: 10.3109/02699050903421099. [DOI] [PubMed] [Google Scholar]
- Johnson B, Zhang K, Gay M, Neuberger T, Horovitz S, Hallett M, Sebastianelli W, Slobounov S. Metabolic alterations in corpus callosum may compromise brain functional connectivity in MTBI patients: An 1 H-MRS study. Neuroscience letters. 2012a;509:5–8. doi: 10.1016/j.neulet.2011.11.013. [DOI] [PMC free article] [PubMed] [Google Scholar]
- Johnson B, Zhang K, Gay M, Horovitz S, Hallett M, Sebastianelli W, Slobounov S. Alteration of brain default network in subacute phase of injury in concussed individuals: resting-state fMRI study. Neuroimage. 2012b;59:511–518. doi: 10.1016/j.neuroimage.2011.07.081. [DOI] [PMC free article] [PubMed] [Google Scholar]
- Kabat MH, Kane RL, Jefferson AL, DiPino RK. Construct validity of selected Automated Neuropsychological Assessment Metrics (ANAM) battery measures. Clin Neuropsychol. 2001;15:498–507. doi: 10.1076/clin.15.4.498.1882. [DOI] [PubMed] [Google Scholar]
- Kane RL, Roebuck-Spencer T, Short P, Kabat M, Wilken J. Identifying and monitoring cognitive deficits in clinical populations using Automated Neuropsychological Assessment Metrics (ANAM) tests. Arch Clin Neuropsychol. 2007;22(Suppl 1):S115–26. doi: 10.1016/j.acn.2006.10.006. [DOI] [PubMed] [Google Scholar]
- King NS, Crawford S, Wenden FJ, Moss NE, Wade DT. The Rivermead Post Concussion Symptoms Questionnaire: a measure of symptoms commonly experienced after head injury and its reliability. J Neurol. 1995;242:587–592. doi: 10.1007/BF00868811. [DOI] [PubMed] [Google Scholar]
- Kumar R, Husain M, Gupta RK, Hasan KM, Haris M, Agarwal AK, Pandey CM, Narayana PA. Serial changes in the white matter diffusion tensor imaging metrics in moderate traumatic brain injury and correlation with neuro-cognitive function. J Neurotrauma. 2009;26:481–495. doi: 10.1089/neu.2008.0461. [DOI] [PubMed] [Google Scholar]
- Lee H, Wintermark M, Gean A, Ghajar J, Manley G, Mukherjee P. Focal lesions in acute mild traumatic brain injury and neurocognitive outcome: CT versus 3T MRI. 2008;25:1049–1056. doi: 10.1089/neu.2008.0566. [DOI] [PubMed] [Google Scholar]
- Levinson D, Reeves D, Watson J, Harrison M. Automated neuropsychological assessment metrics (ANAM) measures of cognitive effects of Alzheimer’s disease. Arch Clin Neuropsychol. 2005;20:403–408. doi: 10.1016/j.acn.2004.09.001. [DOI] [PubMed] [Google Scholar]
- Mac Donald CL, Johnson AM, Cooper D, Nelson EC, Werner NJ, Shimony JS, Snyder AZ, Raichle ME, Witherow JR, Fang R, Flaherty SF, Brody DL. Detection of blast-related traumatic brain injury in U.S. military personnel. N Engl J Med. 2011;364:2091–2100. doi: 10.1056/NEJMoa1008069. [DOI] [PMC free article] [PubMed] [Google Scholar]
- Marquez de la Plata CD, Garces J, Shokri Kojori E, Grinnan J, Krishnan K, Pidikiti R, Spence J, Devous MDS, Moore C, McColl R, Madden C, Diaz-Arrastia R. Deficits in functional connectivity of hippocampal and frontal lobe circuits after traumatic axonal injury. Arch Neurol. 2011;68:74–84. doi: 10.1001/archneurol.2010.342. [DOI] [PMC free article] [PubMed] [Google Scholar]
- Maruishi M, Miyatani M, Nakao T, Muranaka H. Compensatory cortical activation during performance of an attention task by patients with diffuse axonal injury: a functional magnetic resonance imaging study. J Neurol Neurosurg Psychiatry. 2007;78:168–173. doi: 10.1136/jnnp.2006.097345. [DOI] [PMC free article] [PubMed] [Google Scholar]
- Mayer AR, Ling J, Mannell MV, Gasparovic C, Phillips JP, Doezema D, Reichard R, Yeo RA. A prospective diffusion tensor imaging study in mild traumatic brain injury. Neurology. 2010;74:643–650. doi: 10.1212/WNL.0b013e3181d0ccdd. [DOI] [PMC free article] [PubMed] [Google Scholar]
- Mayer AR, Mannell MV, Ling J, Gasparovic C, Yeo RA. Functional connectivity in mild traumatic brain injury. Hum Brain Mapp. 2011;32:1825–1835. doi: 10.1002/hbm.21151. [DOI] [PMC free article] [PubMed] [Google Scholar]
- McAllister TW, Flashman LA, McDonald BC, Saykin AJ. Mechanisms of working memory dysfunction after mild and moderate TBI: evidence from functional MRI and neurogenetics. J Neurotrauma. 2006a;23:1450–1467. doi: 10.1089/neu.2006.23.1450. [DOI] [PubMed] [Google Scholar]
- McAllister TW, Flashman LA, McDonald BC, Saykin AJ. Mechanisms of working memory dysfunction after mild and moderate TBI: evidence from functional MRI and neurogenetics. J Neurotrauma. 2006b;23:1450–1467. doi: 10.1089/neu.2006.23.1450. [DOI] [PubMed] [Google Scholar]
- McAllister TW, Sparling MB, Flashman LA, Guerin SJ, Mamourian AC, Saykin AJ. Differential working memory load effects after mild traumatic brain injury. Neuroimage. 2001;14:1004–1012. doi: 10.1006/nimg.2001.0899. [DOI] [PubMed] [Google Scholar]
- McCrea M, Kelly J, Randolph C. Standardized Assessment of Concussion (SAC): Manual for Adminstration, Scoring, and Interpretation. 2 Comprehensive Neuropsychological Services; 2000. [Google Scholar]
- McDowell S, Whyte J, D’Esposito M. Working memory impairments in traumatic brain injury: evidence from a dual-task paradigm. Neuropsychologia. 1997;35:1341–1353. doi: 10.1016/s0028-3932(97)00082-1. [DOI] [PubMed] [Google Scholar]
- Miotto EC, Cinalli FZ, Serrao VT, Benute GG, Lucia MC, Scaff M. Cognitive deficits in patients with mild to moderate traumatic brain injury. Arq Neuropsiquiatr. 2010;68:862–868. doi: 10.1590/s0004-282x2010000600006. [DOI] [PubMed] [Google Scholar]
- Pellicano C, Kane RL, Gallo A, Xiaobai L, Stern SK, Ikonomidou VN, Evangelou IE, Ohayon JM, Ehrmantraut M, Cantor FK, Bagnato F. Cognitive impairment and its relation to imaging measures in multiple sclerosis: a study using a computerized battery. J Neuroimaging. 2013;23:445–452. doi: 10.1111/j.1552-6569.2011.00687.x. [DOI] [PubMed] [Google Scholar]
- Power JD, Barnes KA, Snyder AZ, Schlaggar BL, Petersen SE. Spurious but systematic correlations in functional connectivity MRI networks arise from subject motion. Neuroimage. 2012;59:2142–2154. doi: 10.1016/j.neuroimage.2011.10.018. [DOI] [PMC free article] [PubMed] [Google Scholar]
- Reeves DL, Bleiberg J, Roebuck-Spencer T, Cernich AN, Schwab K, Ivins B, Salazar AM, Harvey SC, Brown FH, Jr, Warden D. Reference values for performance on the Automated Neuropsychological Assessment Metrics V3.0 in an active duty military sample. Mil Med. 2006;171:982–994. doi: 10.7205/milmed.171.10.982. [DOI] [PubMed] [Google Scholar]
- Reeves DL, Winter KP, Bleiberg J, Kane RL. ANAM genogram: historical perspectives, description, and current endeavors. Arch Clin Neuropsychol. 2007;22(Suppl 1):S15–37. doi: 10.1016/j.acn.2006.10.013. [DOI] [PubMed] [Google Scholar]
- Reich S, Short P, Kane R, Weiner W, Shulman L, Anderson K. Validation of the ANAM Test Battery in Parkinson’s Disease. Ft. Belvoir: Defense Technical Information Center; 2005. [Google Scholar]
- Roebuck-Spencer TM, Vincent AS, Twillie DA, Logan BW, Lopez M, Friedl KE, Grate SJ, Schlegel RE, Gilliland K. Cognitive change associated with self-reported mild traumatic brain injury sustained during the OEF/OIF conflicts. Clin Neuropsychol. 2012;26:473–489. doi: 10.1080/13854046.2011.650214. [DOI] [PubMed] [Google Scholar]
- Shumskaya E, Andriessen TMJC, Norris DG, Vos PE. Abnormal whole-brain functional networks in homogeneous acute mild traumatic brain injury. Neurology. 2012;79:176–182. doi: 10.1212/WNL.0b013e31825f04fb. [DOI] [PubMed] [Google Scholar]
- Slobounov SM, Gay M, Zhang K, Johnson B, Pennell D, Sebastianelli W, Horovitz S, Hallett M. Alteration of brain functional network at rest and in response to YMCA physical stress test in concussed athletes: RsFMRI study. Neuroimage. 2011;55:1716–1727. doi: 10.1016/j.neuroimage.2011.01.024. [DOI] [PMC free article] [PubMed] [Google Scholar]
- Sours C, Zhuo J, Janowich J, Aarabi B, Shanmuganathan K, Gullapalli RP. Default mode network interference in mild traumatic brain injury - A pilot resting state study. Brain Res. 2013;1537:201–215. doi: 10.1016/j.brainres.2013.08.034. [DOI] [PMC free article] [PubMed] [Google Scholar]
- Tang L, Ge Y, Sodickson DK, Miles L, Zhou Y, Reaume J, Grossman RI. Thalamic resting-state functional networks: disruption in patients with mild traumatic brain injury. Radiology. 2011;260:831–840. doi: 10.1148/radiol.11110014. [DOI] [PMC free article] [PubMed] [Google Scholar]
- Teasdale GM, Pettigrew LE, Wilson JT, Murray G, Jennett B. Analyzing outcome of treatment of severe head injury: a review and update on advancing the use of the Glasgow Outcome Scale. J Neurotrauma. 1998;15:587–597. doi: 10.1089/neu.1998.15.587. [DOI] [PubMed] [Google Scholar]
- Thorne DR. Throughput: a simple performance index with desirable characteristics. Behavioural brain methods. 2006;38:569–573. doi: 10.3758/bf03193886. [DOI] [PubMed] [Google Scholar]
- van den Heuvel MP, Hulshoff Pol HE. Exploring the brain network: a review on resting-state fMRI functional connectivity. Eur Neuropsychopharmacol. 2010;20:519–534. doi: 10.1016/j.euroneuro.2010.03.008. [DOI] [PubMed] [Google Scholar]
- Vincent AS, Bleiberg J, Yan S, Ivins B, Reeves DL, Schwab K, Gilliland K, Schlegel R, Warden D. Reference data from the automated Neuropsychological Assessment Metrics for use in traumatic brain injury in an active duty military sample. Mil Med. 2008;173:836–852. doi: 10.7205/milmed.173.9.836. [DOI] [PubMed] [Google Scholar]
- Vincent AS, Roebuck-Spencer T, Gilliland K, Schlegel R. Automated Neuropsychological Assessment Metrics (v4) Traumatic Brain Injury Battery: military normative data. Mil Med. 2012;177:256–269. doi: 10.7205/milmed-d-11-00289. [DOI] [PubMed] [Google Scholar]
- Warner MA, Marquez de la Plata C, Spence J, Wang JY, Harper C, Moore C, Devous M, Diaz-Arrastia R. Assessing spatial relationships between axonal integrity, regional brain volumes, and neuropsychological outcomes after traumatic axonal injury. J Neurotrauma. 2010;27:2121–2130. doi: 10.1089/neu.2010.1429. [DOI] [PMC free article] [PubMed] [Google Scholar]
- Whitfield-Gabrieli S, Nieto-Castanon A. Conn: a functional connectivity toolbox for correlated and anticorrelated brain networks. Brain Connect. 2012;2:125–141. doi: 10.1089/brain.2012.0073. [DOI] [PubMed] [Google Scholar]
- World Health Organization. International Classification of Disease. World Health Organization; 2010. 10th Review. [Google Scholar]
- Yuh EL, Mukherjee P, Lingsma HF, Yue JK, Ferguson AR, Gordon WA, Valadka AB, Schnyer DM, Okonkwo DO, Maas AI, Manley GT TRACK-TBI Investigators. Magnetic resonance imaging improves 3-month outcome prediction in mild traumatic brain injury. Ann Neurol. 2013;73:224–235. doi: 10.1002/ana.23783. [DOI] [PMC free article] [PubMed] [Google Scholar]
- Zhou Y, Milham MP, Lui YW, Miles L, Reaume J, Sodickson DK, Grossman RI, Ge Y. Default-Mode Network Disruption in Mild Traumatic Brain Injury. Radiology. 2012;265:882–892. doi: 10.1148/radiol.12120748. [DOI] [PMC free article] [PubMed] [Google Scholar]
Associated Data
This section collects any data citations, data availability statements, or supplementary materials included in this article.
Supplementary Materials
Comparison of mean motion parameters for the three groups. Bar graphs of the mean of the 6 motion parameters for the three groups (control, low symptom mTBI, high symptom mTBI) for (A) the initial visit and (B) the 1 month follow up. Significance assessed using separate One-Way ANOVA between groups at each time point to assess group differences between the three groups. * p <0.05.
Scatter plot of the mean translation in the y direction versus IH-FC within the dorsolateral prefrontal cortex (DLPFC), thalamus, lateral parietal lobe, and medial temporal lobe (MTL). Data is shown for all rs-fMRI scans (control at one visit and high symptom mTBI and low symptom mTBI at the initial and 1 month follow up). Significance assessed Pearson’s bivariate correlations.