

Abstract
BACKGROUND
Studies have found that central obesity is associated with higher carotid–femoral pulse wave velocity (PWV). However, traveled distance (TD) measured over the body surface can be substantially overestimated with wider waist circumference (WC). We sought to investigate whether central obesity biases the estimation of PWV and whether this bias explains the association between PWV and different measures of adiposity.
METHODS
Seven hundred eleven participants (49.5% men) from the Baltimore Longitudinal Study of Aging with PWV, anthropometrics, and quantification of different fat depots by computed tomography and dual x-ray absorptiometry were included. TD and relative PWV were estimated with a tape measure over the body surface or linear distances taken from radiological images, unaffected by obesity.
RESULTS
A significant association was found between wider WC and a greater difference between the 2 TD measurements and their respective PWV in both sexes (r ≥ 0.34; P < 0.001). This overestimation bias appeared to be generally higher in women than men (0.27 m/sec for each unit increase in WC; P < 0.0001). When TD estimated over the body surface was used to calculate PWV, greater WC, total body fat, subcutaneous fat, and visceral fat were all associated with higher PWV (P < 0.05 for all). However, when PWV was calculated using TD estimated from radiological images or body height, only the association with visceral fat held significant.
CONCLUSIONS
When TD is measured over the body surface, the role of obesity on PWV is substantially overestimated. After accounting for this bias, PWV was still independently associated with visceral fat but not with other measures of adiposity, confirming its contribution to arterial stiffening.
Keywords: arterial stiffness, blood pressure, hypertension, obesity, pulse wave velocity, travel distance, visceral fat, waist circumference.
Carotid–femoral pulse wave velocity (PWV) is considered to be a gold-standard measurement of arterial stiffness and a strong independent risk factor for cardiovascular disease and mortality.1 Our group2–4 and others5–12 have recently shown significant cross-sectional and longitudinal association between PWV and waist circumference (WC), suggesting that central obesity plays a role in the pathogenesis of arterial stiffness. A possible alternative explanation for the association between PWV and central obesity is, however, that the carotid–femoral traveled distance (TD), which is an essential factor in PWV calculation13 usually assessed by tape stretched over the surface of the body, could be systematically biased in obese individuals.1,14,15 Unfortunately, no population study so far has investigated whether the measuring of TD is biased in persons with central obesity and to what extent an obesity artifact may affect PWV calculation. Furthermore, although human studies have demonstrated a positive relationship between the amount of visceral fat and PWV,16,17 it has yet to be determined whether this association is merely a result of erroneous TD estimation or it reflects a genuine role of central obesity in the pathophysiology of arterial stiffness.
In this study, we hypothesized that wider WC is associated with an overestimation of TD and that this overestimation bias would explain, in part at least, the extent of the association between PWV and central obesity reported previously. To test this hypothesis, in addition to the traditional TD acquired over the body surface, we estimated linear TD using anatomical landmarks on computed tomography (CT) scout images, unaffected by central obesity, in participants of the Baltimore Longitudinal Study of Aging (BLSA). We compared the 2 TD measurements and their respective PWV and analyzed their association with WC and other measures of adiposity.
METHODS
Study population
The study sample was drawn from the BLSA, an ongoing, prospective study of normative aging in community-dwelling volunteers living primarily in the Baltimore-Washington area (United States).18 Participants are enrolled in the study when they are healthy (e.g., no diabetes, cardiovascular disease, or cancer) and followed thereafter with regular visits. As a result, they are promptly diagnosed when any disease develops and treated consequently. A total of 738 unique participants (n = 375 women and 363 men) with PWV, total-body dual x-ray absorptiometry scan (DEXA), abdominal CT, and WC available at the same study visit were included in the analysis. Seventeen of them were excluded because of inadequate CT scout images quality (typically, either the manubrium of the sternum, the pubic symphysis, or the neck of the femur was cut out of the image; see image reading protocol below). Finally, we considered 10 participants whose PWV was greater than 3 SDs above or below the sex-specific mean PWV value to be outliers.
All clinical variables presented in this analysis were routinely collected at each visit as per study protocol. The study protocol was approved by the Intramural Research Program of the National Institute on Aging and the Institutional Review Board of the MedStar Health Research Institute (Baltimore, MD). All participants provided informed participation consent at each visit.
Estimation of carotid–femoral pulse wave traveled time
Carotid–femoral pulse wave transit time (TT) was measured after the subject had rested in supine position in a quiet room for at least 10 minutes. Subjects abstained from food or from drinking coffee or other caffeine-containing beverages for at least 45 minutes before the test. Medications were not discontinued during the test. TT was calculated as the time interval between the feet of carotid and femoral arterial waveforms. Five hundred seventy-six of the 711 measurements included in this analysis were obtained using a Complior SP device (Artech Medical, Paris, France), and 135 measurements were obtained using a SphygmoCor device (AtCor Medical, Sydney, Australia), as described in detail elsewhere.2
Body surface–derived TD and PWV
The estimation of TD was performed over the body surface using a tape measure, with all participants lying on a bed without a pillow under the head and according to a standardized protocol used throughout the years since the introduction of PWV in the BLSA in the late 1980s.2 Body surface–derived TD was calculated subtracting the distance from the carotid location to the manubrium of the sternum (CA_MS) from the sum of the distances between the manubrium of the sternum (MS_UMB) and the femoral site (UMB_FA) of measurement (body surface distance = ((MS_UMB + UMB_FA) − CA_MS)) (Figure 1a).1,19,20 Body surface–derived PWV was calculated as the ratio between body surface distance and TT. This TD and PWV based on measures obtained over the body surface will further be referred to as subtracted TD and subtracted PWV, respectively.
Figure 1.
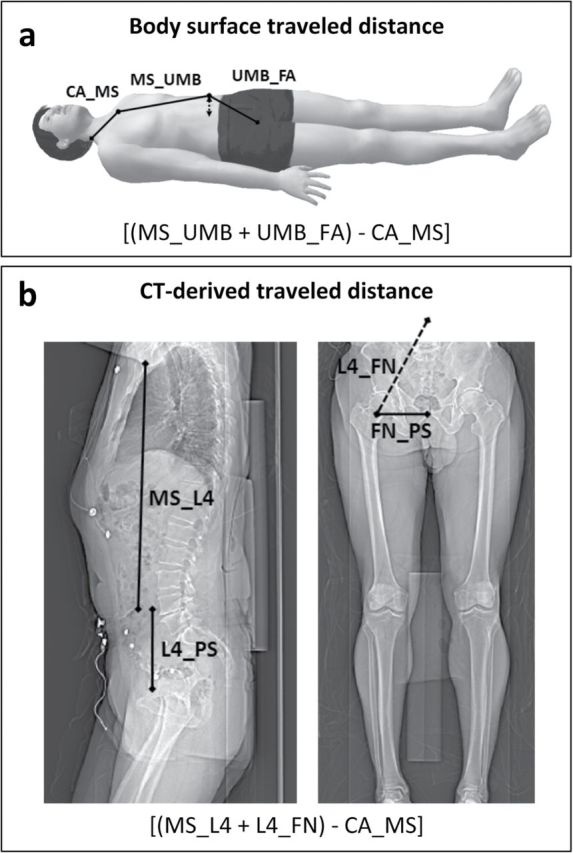
Estimation of carotid–femoral traveled distance over the body surface and using computed tomography (CT) scout images. (a) Carotid–femoral distance was estimated over the body surface using a tape measure and (b) on CT scout images using the ImageJ software and according to a specific protocol (see text for details). In the formula in b, L4_FN was calculated as the square root of the sum of the squares of L4_PS and FN_PS; CA_MS was the same measured above the body surface because this measure is not affected by central obesity. The arrowed line in a represents graphically the potential impact of central obesity in overestimating distances taken over the surface of the body. Abbreviations: CA, carotid artery; FA, femoral artery; L4, fourth lumbar vertebra; FN, femoral neck; MS, manubrium of the sternum; PS, pubic symphysis; UMB, umbilicus.
CT-derived TD and PWV
All participants included in the analysis underwent a CT scan with a Somatom Sensation CT scanner (Siemens, Malvern, PA) according to the BLSA study protocol, which comprises the estimation of some thoracic, abdominal, and thigh muscles CT-derived parameters. Scout images of the body trunk and pelvis were saved in DICOM format and analyzed by 2 independent researchers following a meticulous reading protocol and using image-processing software (ImageJ, http://rsbweb.nih.gov/ij/; National Institutes of Health, Bethesda, MD).
The sagittal scout image of the body trunk (executed at the beginning of each scan to locate the correct levels for subsequent axial slices of the thorax and abdomen) was used to measure the distance between the manubrium of the sternum and the mid-fourth lumbar vertebral disk (MS_L4), which corresponds to aortic bifurcation site21 and the umbilicus22 in most patients (Figure 1b, left). The distance between the mid-fourth lumbar vertebral disk and the neck of the femur (L4_FN) (Figure 1b, right), corresponding to the common femoral artery,23 was calculated as the square root of the sum of the squares of the distance between the mid-fourth lumbar vertebral disk and the pubic symphysis (L4_PS) and the distance between the pubic symphysis and the neck of the femur (PS_FN) (Figure 1b), according to the Pythagorean theorem. Thus, the distance between the manubrium of the sternum and the common femoral artery measured over the body surface passing through the umbilicus corresponded to the distance between the manubrium of the sternum and the femoral neck measured using CT scout images passing through L4. The CT-derived TD was then calculated subtracting the distance from the carotid location to the manubrium of the sternum (the same measured over the body surface because this is not affected by central obesity) from the distance between the manubrium of the sternum and the femoral neck (CT-derived distance = ((MS_L4 + L4_FN) − CA_MS)). CT-derived PWV was then calculated as the ratio between CT-derived distance and TT. This TD and PWV based on measures obtained from CT images will further be referred as subtracted TDCT and subtracted PWVCT, respectively.
Eighty percent direct and estimated TD and PWV
Most recent guidelines14 recommend taking the carotid–femoral distance in a straight line (preferentially with a sliding caliper or infantometer) and using 80% of this distance as the standard distance for daily practice.14,20 As an alternative, estimation of TD from body height is also suggested.14,24 Hence, with the aim of removing body habitus bias and avoiding the use of the so-called subtraction method, 2 additional PWVs were calculated: (i) 0.8 × direct PWVCT, by calculating TD as 80% of direct carotid–femoral straight distance from CT images (0.8 × direct TDCT = ((CA_MS + MS_L4 + L4_PS) × 0.80)); (ii) estimated PWV, by calculating TD using the formula proposed by Weber and colleagues (estimated TD = (body height/4) + 7.28).24 The same TT was used as denominator for all of the above PWV calculations.
Estimation of body and abdominal fat
Total body fat.
Total body fat was measured by DEXA using the Prodigy Scanner (General Electric, Madison, WI) with version 10.51.006 software, as validated in previous studies.17
Total, subcutaneous, and visceral abdominal fat.
A 10-mm axial transversal slice obtained using a Somatom Sensation CT scanner (Siemens, Malvern, PA) at the level between the fourth and the fifth lumbar vertebra was used to estimate total, subcutaneous, and visceral adipose tissue areas. Food residues in the intestines were removed, and different fat depots were automatically segmented and quantified, as previously described.25
Anthropometric measurements and other clinical variables
Waist circumference, defined as the minimal abdominal circumference between the lower edge of the rib cage and the iliac crests, was measured according to a highly standardized procedure, and National Cholesterol Education Program Adult Treatment Panel III criteria were used to estimate the prevalence of central obesity (WC >88cm in women and >102cm in men). The sagittal abdominal diameter, the distance between the back surface and the top of the abdomen midway between the lower edge of the rib cage and the iliac crests, was measured with an anthropometer after a gentle expiration by the patient in a standing position.26 Height and weight were also measured, and body mass index was calculated as weight divided by squared height (kg/m2). A body mass index ≥30kg/m2 was used as an index of general obesity. Systolic and diastolic blood pressure were measured in triplicate and averaged with participant in the supine position before the assessment of PWV using a validated automatic oscillometric device. Heart rate was measured at the same time. Antihypertensive medications included diuretics, beta-blockers, calcium channel antagonists, angiotensin-converting enzyme inhibitors, angiotensin II receptor blockers, and/or peripheral vasodilators. Diabetes mellitus was diagnosed according to the 2011 American Diabetes Association criteria27 or use of diabetes medications.
Statistical analysis
All analyses were done using the SAS package (version 9.3; SAS Institute, Cary, NC) on data stratified by sex. Continuous data are presented as mean ± SD, and categorical data are presented as percentages. Comparisons between women and men were performed using the Student t test or the χ2 test as appropriate. Subtracted TD (obtained following body contours and potentially biased by central obesity) and subtracted TDCT (from CT images, where linear distances are not influenced by central obesity) were calculated with the same approach (i.e., subtraction method1,19); therefore they were deemed comparable in values. We calculated the difference between the 2 TD measurements (subtracted TD minus subtracted TDCT) and between their respective PWV (subtracted PWV minus subtracted PWVCT) and assessed the association of these differences with WC and other relevant clinical characteristics by linear regression and correlation coefficient analysis. Then, to assess whether removing the effect of central obesity using CT-derived TD or TD estimated from body height would affect the relationship between PWV and different expressions of body and abdominal fat, linear regression and correlation coefficients were also determined for the association between either subtracted PWV, Subtracted PWVCT, 0.8 × direct PWVCT, or estimated PWV with WC, total body fat (kg), total abdominal fat area, subcutaneous fat area, and visceral fat area (cm2). Statistical significance was set at P < 0.05.
RESULTS
Participants’ characteristics
The characteristics of the study subjects are shown in Table 1. The prevalence of central obesity was significantly higher in women than men, as was the amount of total body fat and total and subcutaneous abdominal fat. Men were older than women and had more visceral fat, higher blood pressure, and a higher prevalence of diabetes (Table 1).
Table 1.
Characteristics of the study population
| Characteristic | Women (n = 359) | Men (n = 352) |
|---|---|---|
| Age, years | 66±12 | 68±13** |
| Race, black | 31 | 18* |
| Height, cm | 162±6 | 176±7* |
| Weight, kg | 71±15 | 84±13* |
| Body mass index, kg/m2 | 27±5 | 27±4 |
| Waist circumference, cm | 84±12 | 96±11* |
| Sagittal abdominal diameter, cm | 22±4 | 26±4* |
| Systolic blood pressure, mm Hg | 121±18 | 126±15*** |
| Diastolic blood pressure, mm Hg | 64±10 | 69±9* |
| Heart rate, beats/min | 66±10 | 62±10* |
| Obesity | 25 | 23 |
| Central obesity | 38 | 28*** |
| Antihypertensive medications | 37 | 47*** |
| Diabetes mellitus | 10 | 15*** |
| Total body fat, kg | 29±11 | 26±9* |
| Total abdominal fat, cm2 | 401±164 | 354±125* |
| Subcutaneous abdominal fat, cm2 | 312±139 | 237±91* |
| Visceral abdominal fat, cm2 | 89±47 | 118±55* |
| Traveled distance, TD | ||
| Body surface TD, subtracted TD, cm | 41±5 | 44±5* |
| CT-derived TD, subtracted TDCT, cm | 37±3 | 40±3* |
| 0.8 × direct TDCT, 80% of carotid–femoral distance, cm | 52±3 | 56±3* |
| Estimated TD, (height/4) + 7.28, cm | 48±2 | 51±2* |
| Difference between body surface and CT-derived TD, cm | 4.4±4.2 | 4.3±4.1 |
| Pulse wave velocity, PWV | ||
| PWV using subtracted TD, m/sec | 7.4±1.7 | 8.1±2* |
| PWV using subtracted TDCT, m/sec | 6.6±1.5 | 7.4±1.9* |
| PWV using 0.8 × direct TDCT, m/sec | 9.5±2 | 10.4±2.6* |
| PWV using estimated TD, m/sec | 8.6±1.9 | 9.4±2.4* |
Data are mean ± SD or percentage.
Abbreviation: CT, computed tomography.
*P for comparison < 0.0001; **P for comparison < 0.01; ***P for comparison < 0.05.
Comparison between body surface- vs. CT-derived TD and PWV
As expected, men had longer TD than women, whichever method was used, but the difference between subtracted TD and subtracted TDTC was similar in both sexes (Table 1). However, this difference was significantly higher in both women and men with central obesity than in their counterparts (women: 5.9±4.5 vs. 3.6±3.7cm; men: 6.0±4.5 vs. 3.6±3.7cm; P < 0.0001 for both). As it has been previously shown in our population,2 men had higher subtracted PWV than women but also had higher Subtracted PWVCT, 0.8 × direct PWVCT, and estimated PWV (Table 1). In both women and men, we found a linear positive relationship between WC and the difference between subtracted TD and subtracted TDTC, confirming the hypothesis of an overestimation bias of TD (Figure 2a) and consequently PWV (Figure 2b) with wider WC in both sexes. Interestingly, for each unit increase of WC, the overestimation of TD (and therefore PWV) appeared to be generally higher in women than men (beta coefficients for female sex in the overall model including WC predicting the difference in TD = 1.63cm, SE = 0.33, P < 0.0001; predicting the difference in PWV = 0.27 m/sec, SE = 0.06, P < 0.0001) (Figure 2). Other significant correlates of the difference in TD and consequently in PWV were the sagittal abdominal diameter, weight, and body mass index (Table 2). Of note, each of these 3 parameters also had a high significant correlation with WC (correlation coefficient >0.75 with P < 0.0001 for all). No association was found between the difference in TD or PWV and body height or age (Table 2). In multivariable analysis of the overall sample adjusted for age, sex, race, height, and weight, WC remained independently associated with increased difference in TD (beta coefficient = 0.54cm; SE = 0.22; P = 0.02) and in PWV (beta coefficient = 0.009 m/sec; SE = 0.004; P = 0.04).
Figure 2.
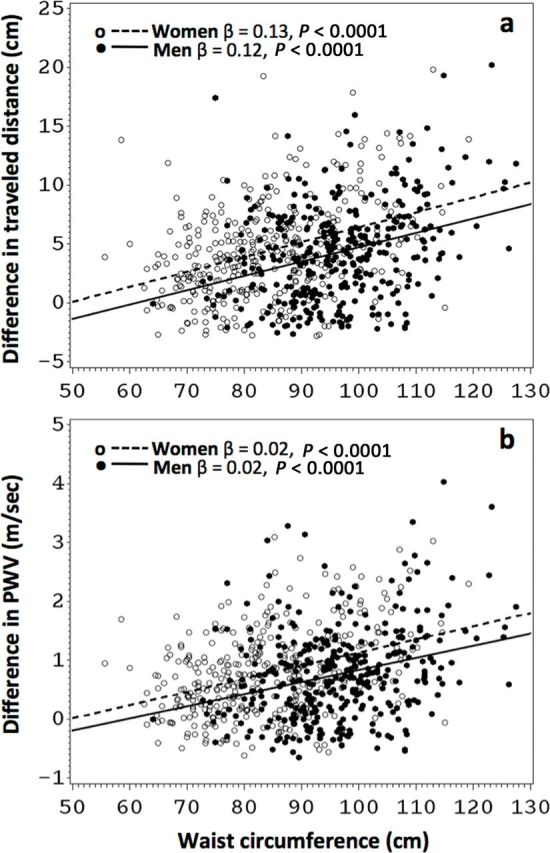
Relationship between waist circumference and the difference in body-derived minus computed tomography (CT)–derived traveled distance and pulse wave velocity. (a) The difference in traveled distance (TD) for women (circles, dashed lines) and men (dots, solid lines) was calculated subtracting the TD calculated from CT scout images from the TD measured over the body surface with a tape measure. (b) The respective pulse wave velocity values were calculated, subtracted, and plotted against waist circumference.
Table 2.
Correlation coefficients of participant characteristics with the difference between body surface and computed tomography–derived traveled distance and pulse wave velocity
| Characteristsics | Subtracted TD minus subtracted TDCT | Subtracted PWV minus subtracted PWVCT | ||
|---|---|---|---|---|
| Women | Men | Women | Men | |
| Waist circumference | 0.34* | 0.28* | 0.34* | 0.26* |
| Sagittal abdominal diameter | 0.33* | 0.26* | 0.32* | 0.26* |
| Weight | 0.38* | 0.27* | 0.35* | 0.23* |
| Height | −0.02 | 0.05 | −0.07 | 0.02 |
| Body mass index | 0.41* | 0.26* | 0.40* | 0.23* |
| Age | −0.06 | −0.06 | 0.05 | 0.04 |
Abbreviations: CT, computed tomography; PWV, pulse wave velocity; TD, traveled distance.
*P < 0.001.
Impact of distance overestimation on the association between PWV and adiposity
We then separately analyzed the correlation of subtracted PWV, subtracted PWVCT, 0.8 × direct PWVCT, and estimated PWV with WC and different measures of fat, including total body fat by DEXA, and total, subcutaneous, and visceral abdominal fat by CT. All of these measures of adiposity showed significant association with PWV calculated using the distance measured over the body surface. However, none of them, except visceral fat, demonstrated a significant association with PWV calculated using TD from CT scout images (Table 3). Thus, despite accounting for the overestimation in TD due to central obesity, the association of subtracted PWVCT with visceral fat remained significant (Table 3). The association with visceral fat remained significant also when PWV was calculated using 80% of straight carotid–femoral distance recently recommended by the expert consensus14 or in women when estimating TD from body height (Table 3). The strength of the association with visceral fat decreased by about one-third when using subtracted TDCT or 0.8 × direct TDCT or estimated TD to calculate PWV as compared with subtracted TD from body surface (Table 3). These associations were also generally higher in women than men, but not significantly. After multivariable adjustments, including age, sex, hypertension, and diabetes, WC remained significantly associated with subtracted PWV (beta coefficient = 0.019 m/sec per cm of WC; SE = 0.006; P = 0.002), as well as with total body fat and total, subcutaneous, and visceral abdominal fat (P < 0.001 for all). No significant associations were found between either estimated PWV or subtracted PWVCT or 0.8 × direct PWVCT with WC and other quantifications of body fat after accounting for these variables (P ≥ 0.08 for all).
Table 3.
Correlation coefficients of pulse wave velocity calculated using different distance estimates with waist circumference and other measures of adiposity
| Adiposity measures | Non-CT-based PWV | CT-based PWV | |||
|---|---|---|---|---|---|
| Subtracted PWV | Estimated PWV | Subtracted PWVCT | 0.8 × direct PWVCT | ||
| Waist circumference | |||||
| Women | 0.19* | 0.02 | 0.03 | 0.09 | |
| Men | 0.12*** | −0.07 | 0.02 | −0.01 | |
| Total body fat | |||||
| Women | 0.15** | −0.05 | −0.02 | 0.01 | |
| Men | 0.12*** | −0.07 | 0.02 | −0.02 | |
| Total abdominal fat | |||||
| Women | 0.22* | 0.00 | 0.04 | 0.06 | |
| Men | 0.19* | −0.01 | 0.08 | 0.04 | |
| Subcutaneous fat | |||||
| Women | 0.15** | −0.01 | 0.02 | 0.01 | |
| Men | 0.13*** | −0.06 | 0.01 | −0.02 | |
| Visceral fat | |||||
| Women | 0.31* | 0.19* | 0.21* | 0.19* | |
| Men | 0.22* | 0.08 | 0.16** | 0.13*** | |
Abbreviations: CT, computed tomography; PWV, pulse wave velocity.
*P < 0.001; **P < 0.01; ***P < 0.05. Otherwise P not significant.
DISCUSSION
This study showed a significant overestimation of TD and consequently of PWV with increasing central obesity in both men and women. For the same increase in WC, women generally displayed higher increase in TD and consequently in PWV. Interestingly, when correcting PWV for the effect of central obesity using TD estimates from CT images or body height, the association between PWV and different quantification of body fat disappeared, except for visceral fat.
Errors in PWV estimation can be introduced in calculating the TD between pulse assessment points.14,24 To date, a variety of methods have been used by different groups, which could lead to differences in TD values of up to 15cm20 and consequently in PWV values as high as 30%.13 Consensuses within the field believe that part of these differences are due to the impact that large abdomen and/or breast size may have on the TD measured by tape measure, especially in obese people.1,14,24 However, no community-based study has yet investigated this issue in a large population with prevalent obesity. Huybrechts and colleagues, in a small study, compared the “real TD” measured within the aorta by magnetic resonance imaging with 11 different estimates of TD obtained using a tape measure and showed a small impact of body mass index, even when considering the recommended 80% straight carotid–femoral distance.20 A more recent paper from the same group and study population compared straight magnetic resonance imaging and tape measure carotid–femoral distance and found significantly longer distances when using a tape measure only in women.15 However, only 5% of the 98 healthy individuals included in these studies had a body mass index >30kg/m2, and the effect of WC was never tested.15,20
To our knowledge, our study is the first to show a linear relationship between the increase in WC and the overestimation of TD and consequently of PWV. Furthermore, in accordance with previous findings,15 this overestimation appeared to be generally higher in women at all values of WC. Sagittal abdominal diameter, weight, and body mass index were also significant correlates of the difference in TD. These findings shed light on previous reports from our group2–4 and others5–12 showing a significant association between PWV and WC, which, interestingly, was generally stronger in women. Indeed, most of these studies measured the TD following the contours of the body and passing through the sternum and the umbilicus and subtracting the carotid–suprasternal distance, as recommended by prior expert consensuses.1,19 At the same time, some studies failed to demonstrate an independent association of WC with PWV, regardless whether TD was measured in a straight line28 or following the body contours.29,30 Beyond the method used to estimate TD, differences in sample size and characteristics, study protocol, and statistical analysis may be responsible for some of the heterogeneity in these results.
Our findings support the most recent recommendations to measure the straight carotid–femoral distance using a sliding caliper or infantometer,14 particularly in women.15 Valid alternative estimates may be obtained from body height,14,24 and this method would be particularly useful to be tested in previous longitudinal studies.2,10,31 Our findings are also particularly relevant to diet-intervention studies that report the effect of weight loss on PWV using carotid–femoral distance measured over the body.32,33 Indeed, the decrease in PWV over time shown in these studies may simply be the result of a reduction in carotid–femoral distance estimation due to the achieved decrease in body weight, WC, and/or body mass index.32,33
In our study, PWV obtained using TD measured over the surface of the body was associated with WC and various expressions of body fat, including total body fat by DEXA and different component of abdominal fat quantified by CT, as previously shown.16,17,34 However, after calculating PWV using linear distances obtained from CT scout images or from body height, only the association with visceral fat remained consistently significant in univariable analysis. Interestingly, the same result was observed when using 80% of the straight carotid–femoral distance recommended by a most recent consensus document.14 These findings support the notion of a specific effect of visceral fat on arterial stiffness.
Scant evidence exists in the literature regarding a cause–effect relationship between visceral fat and arterial stiffness. Some previous studies exploring the association between PWV and visceral fat in humans likely suffered from the limitation of measuring TD following the body contours explored in this analysis.16,17,34 Nevertheless, studies using alternative measures of arterial stiffness not affected by TD estimation (such as carotid elastic modulus1) have confirmed the association of PWV with visceral fat34–36 and showed that the degree of arterial stiffening with weight gain was determined by the amount of abdominal visceral fat gain, independently of the amount of total body fat gained.37 Accordingly, a decrease in visceral fat was likely responsible for the effect of weight loss on PWV reported in 2 studies, which estimated PWV using magnetic resonance imaging38 or maintaining TD constant throughout the course of the study.39 Several mechanisms have been proposed by which visceral fat may promote arterial stiffening, including the secretion by adipocytes of peptides such as angiotensin, interleukin 6, tumor necrosis factor α, plasminogen activator inhibitor 1,40 leptin, and adiponectin.17 Furthermore, visceral obesity is associated with insulin resistance and diabetes,41 which may serve as part of the link between increased visceral adipose tissue and stiffening of the aorta.16
PWV measurements have been made in the BLSA measuring the TD over the body surface since 1988. We acknowledge that recent literature has been increasingly suggesting taking the carotid–femoral distance in a straight line and using 80% of this distance as a new standard,14 instead of the subtraction method used in this study and recommended in previous consensus documents.1,19 However, because a definitive agreement is still lacking, to date we have been keen not to introduce any change in methodology that would produce a period shift in our longitudinal data. The straight tape measure carotid–femoral distance was not available in our study, but we used the straight distance from CT scout images as a proxy to calculate the 80% TD recommended by most recent guidelines and to test its association with different fat depots. Because of the likely imperfect overlap between our radiological and over-the-body landmarks, we anticipated that a difference of at least ±3cm between the two distances within the same individual would be due to measurement error (assuming ±1cm for each different point of reference; i.e., manubrium of the sternum on body surface vs. on x-ray image, umbilicus vs. L4, and femoral artery vs. femoral neck). The actual location of the femoral pulse, which we assumed at the level of the femoral neck, may also vary significantly in obese individuals23 who tend to accumulate fat tissue at the groin.19 For these reasons, we performed sensitivity analyses, which resulted in removing, first, participants with a CT-derived distance greater than the one measured over the body (n = 47 women and 58 men, with a maximum difference of −2.8 and −2.6cm, respectively) and, second, potential outliers (n = 77, with studentized residual <−2 or >2). After excluding these persons, the results did not differ for either men or women (data not shown). In addition, if the analyses were restricted to participants who underwent PWV examination with the Complior device, the significance of the results did not substantially change (data not shown). Finally, our method did not account for larger bust size in women, which is likely to have contributed to the higher overestimation in carotid–femoral distance and PWV observed in women.
Although a general consensus is still lacking, our study findings demonstrate the important bias introduced when measuring the carotid–femoral distance over the body surface using a tape measure, especially in individuals with larger WC, and strongly support the most recent recommendations to use 80% of the straight carotid–femoral distance (preferentially measured with a sliding caliper or infantometer) as the standard TD for clinical practice.14 The specific association between visceral fat and PWV demonstrated in this study, together with other data in the literature,34–37 emphasizes the role of visceral adipose tissue as a major contributor to arterial stiffness, which certainly deserves further basic and clinical investigation.
DISCLOSURE
The authors declared no conflict of interest.
ACKNOWLEDGMENTS
Marco Canepa and Majd AlGhatrif contributed equally to this work. This work was supported by the Intramural Research Program of the National Institutes of Health, National Institute on Aging and Medstar Research Institute.
REFERENCES
- 1. Laurent S, Cockcroft J, Van Bortel L, Boutouyrie P, Giannattasio C, Hayoz D, Pannier B, Vlachopoulos C, Wilkinson I, Struijker-Boudier H, European Network N-i. Expert consensus document on arterial stiffness: methodological issues and clinical applications. Eur Heart J 2006; 27:2588–2605 [DOI] [PubMed] [Google Scholar]
- 2. AlGhatrif M, Strait JB, Morrell CH, Canepa M, Wright J, Elango P, Scuteri A, Najjar SS, Ferrucci L, Lakatta EG. Longitudinal trajectories of arterial stiffness and the role of blood pressure: the Baltimore Longitudinal Study of Aging. Hypertension 2013; 62:934–941 [DOI] [PMC free article] [PubMed] [Google Scholar]
- 3. Scuteri A, Najjar SS, Muller DC, Andres R, Hougaku H, Metter EJ, Lakatta EG. Metabolic syndrome amplifies the age-associated increases in vascular thickness and stiffness. J Am Coll Cardiol 2004; 43:1388–1395 [DOI] [PubMed] [Google Scholar]
- 4. Scuteri A, Orru M, Morrell CH, Tarasov K, Schlessinger D, Uda M, Lakatta EG. Associations of large artery structure and function with adiposity: effects of age, gender, and hypertension. The SardiNIA Study. Atherosclerosis 2012; 221:189–197 [DOI] [PMC free article] [PubMed] [Google Scholar]
- 5. Mackey RH, Sutton-Tyrrell K, Vaitkevicius PV, Sakkinen PA, Lyles MF, Spurgeon HA, Lakatta EG, Kuller LH. Correlates of aortic stiffness in elderly individuals: a subgroup of the Cardiovascular Health Study. Am J Hypertens 2002; 15:16–23 [DOI] [PubMed] [Google Scholar]
- 6. Wildman RP, Mackey RH, Bostom A, Thompson T, Sutton-Tyrrell K. Measures of obesity are associated with vascular stiffness in young and older adults. Hypertension 2003; 42:468–473 [DOI] [PubMed] [Google Scholar]
- 7. Czernichow S, Bertrais S, Oppert JM, Galan P, Blacher J, Ducimetiere P, Hercberg S, Zureik M. Body composition and fat repartition in relation to structure and function of large arteries in middle-aged adults (the SU.VI.MAX study). Int J Obes (Lond) 2005; 29:826–832 [DOI] [PubMed] [Google Scholar]
- 8. Dahlen EM, Bjarnegard N, Lanne T, Nystrom FH, Ostgren CJ. Sagittal abdominal diameter is a more independent measure compared with waist circumference to predict arterial stiffness in subjects with type 2 diabetes—a prospective observational cohort study. Cardiovasc Diabetol 2013; 12:55. [DOI] [PMC free article] [PubMed] [Google Scholar]
- 9. Teoh WL, Price JF, Williamson RM, Payne RA, Van Look LA, Reynolds RM, Frier BM, Wilkinson IB, Webb DJ, Strachan MW. Metabolic parameters associated with arterial stiffness in older adults with Type 2 diabetes: the Edinburgh Type 2 diabetes study. J Hypertens 2013; 31:1010–1017 [DOI] [PubMed] [Google Scholar]
- 10. McEniery CM, Spratt M, Munnery M, Yarnell J, Lowe GD, Rumley A, Gallacher J, Ben-Shlomo Y, Cockcroft JR, Wilkinson IB. An analysis of prospective risk factors for aortic stiffness in men: 20-year follow-up from the Caerphilly prospective study. Hypertension 2010; 56:36–43 [DOI] [PubMed] [Google Scholar]
- 11. Holewijn S, den Heijer M, van Tits LJ, Swinkels DW, Stalenhoef AF, de Graaf J. Impact of waist circumference versus adiponectin level on subclinical atherosclerosis: a cross-sectional analysis in a sample from the general population. J Intern Med 2010; 267:588–598 [DOI] [PubMed] [Google Scholar]
- 12. Johansen NB, Vistisen D, Brunner EJ, Tabak AG, Shipley MJ, Wilkinson IB, McEniery CM, Roden M, Herder C, Kivimaki M, Witte DR. Determinants of aortic stiffness: 16-year follow-up of the Whitehall II study. PLoS One 2012; 7:e37165. [DOI] [PMC free article] [PubMed] [Google Scholar]
- 13. Girerd N, Legedz L, Paget V, Rabilloud M, Milon H, Bricca G, Lantelme P. Outcome associations of carotid–femoral pulse wave velocity vary with different measurement methods. Am J Hypertens 2012; 25:1264–1270 [DOI] [PubMed] [Google Scholar]
- 14. Van Bortel LM, Laurent S, Boutouyrie P, Chowienczyk P, Cruickshank JK, De Backer T, Filipovsky J, Huybrechts S, Mattace-Raso FU, Protogerou AD, Schillaci G, Segers P, Vermeersch S, Weber T. Expert consensus document on the measurement of aortic stiffness in daily practice using carotid–femoral pulse wave velocity. J Hypertens 2012; 30:445–448 [DOI] [PubMed] [Google Scholar]
- 15. Bossuyt J, Van De Velde S, Azermai M, Vermeersch SJ, De Backer TL, Devos DG, Heyse C, Filipovsky J, Segers P, Van Bortel LM. Noninvasive assessment of carotid-femoral pulse wave velocity: the influence of body side and body contours. J Hypertens 2013; 31:946–951 [DOI] [PubMed] [Google Scholar]
- 16. Sutton-Tyrrell K, Newman A, Simonsick EM, Havlik R, Pahor M, Lakatta E, Spurgeon H, Vaitkevicius P. Aortic stiffness is associated with visceral adiposity in older adults enrolled in the study of health, aging, and body composition. Hypertension 2001; 38:429–433 [DOI] [PubMed] [Google Scholar]
- 17. Windham BG, Griswold ME, Farasat SM, Ling SM, Carlson O, Egan JM, Ferrucci L, Najjar SS. Influence of leptin, adiponectin, and resistin on the association between abdominal adiposity and arterial stiffness. Am J Hypertens 2010; 23:501–507 [DOI] [PMC free article] [PubMed] [Google Scholar]
- 18. Shock NW, Greulich RC, Andres RA, Arenberg D, Costa PT, Lakatta E, Tobin JD. Normal Human Aging: The Baltimore Longitudinal Study of Aging. NIH publication no. 84–2450. US Government Printing Office: Washington DC, 1984, p. 45 [Google Scholar]
- 19. Van Bortel LM, Duprez D, Starmans-Kool MJ, Safar ME, Giannattasio C, Cockcroft J, Kaiser DR, Thuillez C. Clinical applications of arterial stiffness, Task Force III: recommendations for user procedures. Am J Hypertens 2002; 15:445–452 [DOI] [PubMed] [Google Scholar]
- 20. Huybrechts SA, Devos DG, Vermeersch SJ, Mahieu D, Achten E, de Backer TL, Segers P, van Bortel LM. Carotid to femoral pulse wave velocity: a comparison of real travelled aortic path lengths determined by MRI and superficial measurements. J Hypertens 2011; 29:1577–1582 [DOI] [PubMed] [Google Scholar]
- 21. Ratcliffe JF. The anatomy of the fourth and fifth lumbar arteries in humans: an arteriographic study in one hundred live subjects. J Anat 1982; 135:753–761 [PMC free article] [PubMed] [Google Scholar]
- 22. Dixon AK. Abdominal fat assessed by computed tomography: sex difference in distribution. Clin Radiol 1983; 34:189–191 [DOI] [PubMed] [Google Scholar]
- 23. Yaganti V, Mejevoi N, Hasan O, Cohen M, Wasty N. Pitfalls associated with the use of current recommendations for fluoroscopy-guided common femoral artery access. Catheter Cardiovasc Interv 2013; 81:674–679 [DOI] [PubMed] [Google Scholar]
- 24. Weber T, Ammer M, Rammer M, Adji A, O’Rourke MF, Wassertheurer S, Rosenkranz S, Eber B. Noninvasive determination of carotid-femoral pulse wave velocity depends critically on assessment of travel distance: a comparison with invasive measurement. J Hypertens 2009; 27:1624–1630 [DOI] [PubMed] [Google Scholar]
- 25. Makrogiannis S, Caturegli G, Davatzikos C, Ferrucci L. Computer-aided assessment of regional abdominal fat with food residue removal in CT. Acad Radiol 2013; 20:1413–1421 [DOI] [PMC free article] [PubMed] [Google Scholar]
- 26. Seidell JC, Andres R, Sorkin JD, Muller DC. The sagittal waist diameter and mortality in men: the Baltimore Longitudinal Study on Aging. Int J Obes Relat Metab Disord 1994; 18:61–67 [PubMed] [Google Scholar]
- 27. American Diabates Association. Diagnosis and classification of diabetes mellitus. Diabetes Care 2011; 34:S62–S69 [DOI] [PMC free article] [PubMed] [Google Scholar]
- 28. Oren A, Vos LE, Uiterwaal CS, Grobbee DE, Bots ML. Aortic stiffness and carotid intima-media thickness: two independent markers of subclinical vascular damage in young adults? Eur J Clin Invest 2003; 33:949–954 [DOI] [PubMed] [Google Scholar]
- 29. Rodrigues SL, Baldo MP, Lani L, Nogueira L, Mill JG, Sa Cunha R. Body mass index is not independently associated with increased aortic stiffness in a Brazilian population. Am J Hypertens 2012; 25:1064–1069 [DOI] [PubMed] [Google Scholar]
- 30. Bechlioulis A, Vakalis K, Naka KK, Bourantas CV, Papamichael ND, Kotsia A, Tzimas T, Pappas K, Katsouras CS, Michalis LK. Increased aortic pulse wave velocity is associated with the presence of angiographic coronary artery disease in overweight and obese patients. Am J Hypertens 2013; 26:265–270 [DOI] [PubMed] [Google Scholar]
- 31. Wildman RP, Farhat GN, Patel AS, Mackey RH, Brockwell S, Thompson T, Sutton-Tyrrell K. Weight change is associated with change in arterial stiffness among healthy young adults. Hypertension 2005; 45:187–192 [DOI] [PubMed] [Google Scholar]
- 32. Barinas-Mitchell E, Kuller LH, Sutton-Tyrrell K, Hegazi R, Harper P, Mancino J, Kelley DE. Effect of weight loss and nutritional intervention on arterial stiffness in type 2 diabetes. Diabetes Care 2006; 29:2218–2222 [DOI] [PubMed] [Google Scholar]
- 33. Cooper JN, Buchanich JM, Youk A, Brooks MM, Barinas-Mitchell E, Conroy MB, Sutton-Tyrrell K. Reductions in arterial stiffness with weight loss in overweight and obese young adults: potential mechanisms. Atherosclerosis 2012; 223:485–490 [DOI] [PMC free article] [PubMed] [Google Scholar]
- 34. Ferreira I, Snijder MB, Twisk JW, van Mechelen W, Kemper HC, Seidell JC, Stehouwer CD. Central fat mass versus peripheral fat and lean mass: opposite (adverse versus favorable) associations with arterial stiffness? The Amsterdam Growth and Health Longitudinal Study. J Clin Endocrinol Metab 2004; 89:2632–2639 [DOI] [PubMed] [Google Scholar]
- 35. Geerts CC, Evelein AM, Bots ML, van der Ent CK, Grobbee DE, Uiterwaal CS. Body fat distribution and early arterial changes in healthy 5-year-old children. Ann Med 2012; 44:350–359 [DOI] [PubMed] [Google Scholar]
- 36. Diamant M, Lamb HJ, van de Ree MA, Endert EL, Groeneveld Y, Bots ML, Kostense PJ, Radder JK. The association between abdominal visceral fat and carotid stiffness is mediated by circulating inflammatory markers in uncomplicated type 2 diabetes. J Clin Endocrinol Metab 2005; 90:1495–1501 [DOI] [PubMed] [Google Scholar]
- 37. Orr JS, Gentile CL, Davy BM, Davy KP. Large artery stiffening with weight gain in humans: role of visceral fat accumulation. Hypertension 2008; 51:1519–1524 [DOI] [PMC free article] [PubMed] [Google Scholar]
- 38. Rider OJ, Tayal U, Francis JM, Ali MK, Robinson MR, Byrne JP, Clarke K, Neubauer S. The effect of obesity and weight loss on aortic pulse wave velocity as assessed by magnetic resonance imaging. Obesity (Silver Spring) 2010; 18:2311–2316 [DOI] [PubMed] [Google Scholar]
- 39. Dengo AL, Dennis EA, Orr JS, Marinik EL, Ehrlich E, Davy BM, Davy KP. Arterial destiffening with weight loss in overweight and obese middle-aged and older adults. Hypertension 2010; 55:855–861 [DOI] [PMC free article] [PubMed] [Google Scholar]
- 40. Bays HE. Adiposopathy is “sick fat” a cardiovascular disease? J Am Coll Cardiol 2011; 57:2461–2473 [DOI] [PubMed] [Google Scholar]
- 41. McFarlane SI, Banerji M, Sowers JR. Insulin resistance and cardiovascular disease. J Clin Endocrinol Metab 2001; 86:713–718 [DOI] [PubMed] [Google Scholar]