

Abstract
We recently showed that insulin increased ER stress in human adipose tissue. The effect of insulin resistance on ER stress is not known. It could be decreased, unchanged, or increased, depending on whether insulin regulates ER stress via the metabolic/phosphoinositide 3-kinase (PI3K) or alternate signaling pathways. To address this question, we examined effects of lipid-induced insulin resistance on insulin stimulation of ER stress. mRNAs of several ER stress markers were determined in fat biopsies obtained before and after 8-h hyperglycemic-hyperinsulinemic clamping in 13 normal subjects and in 6 chronically insulin-resistant patients with type 2 diabetes mellitus (T2DM). In normal subjects, hyperglycemia-hyperinsulinemia increased after/before mRNA ratios of several ER stress markers (determined by ER stress pathway array and by individual RT-PCR). Lipid infusion was associated with inhibition of the PI3K insulin-signaling pathway and with a decrease of hyperinsulinemia-induced ER stress responses. In chronically insulin-resistant patients with T2DM, hyperglycemic-hyperinsulinemia did not increase ER stress response marker mRNAs. In summary, insulin resistance, either produced by lipid infusions in normal subjects or chronically present in T2DM patients, was associated with decreased hyperinsulinemia-induced ER stress responses. This suggests, but does not prove, that these two phenomena were causally related.
Introduction
Endoplasmic reticulum (ER) stress is increased in adipose tissue of obese rodents (1–3) and humans (4–6) and has been associated with several obesity-related pathologies including type 2 diabetes mellitus (T2DM), hypertension, atherogenic dyslipidemia, and nonalcoholic fatty liver disease (1–3,7–11). The reason why ER stress is increased in obesity is complex and includes hypoxia, inflammation (12,13), and hyperinsulinemia. We recently showed that short-term physiologic increases in circulating insulin upregulated the unfolded protein response (UPR), an adaptive ER stress response that reflects ER stress, in subcutaneous adipose tissue of normal subjects, dose dependently over the entire physiological insulin range (14). Whether the chronic hyperinsulinemia in insulin-resistant subjects has similar effects on ER stress responses is not known and depends on the mechanism through which insulin stimulates ER stress. Hence, if insulin signaling occurred through the so-called metabolic, i.e., the phosphoinositide 3-kinase (PI3K) pathway, one would expect little or no insulin effect on ER stress in obese subjects or in patients with T2DM, in whom this pathway is inhibited. If, on the other hand, insulin signaling occurred via alternate pathways, collectively called mitogen-activated protein kinase pathways, insulin could increase ER stress even in “insulin-resistant” subjects. Instances of such “selective insulin resistance,” i.e., resistance in the metabolic/PI3K pathway and normal or increased activity in an alternate insulin signaling pathway, are increasingly being recognized (15–17).
To differentiate between these possibilities, we examined effects of hyperinsulinemia on ER stress markers in subcutaneous adipose tissue of normal subjects in whom the metabolic/PI3K pathway was inhibited with lipid infusion and in subcutaneous adipose tissue of insulin-resistant patients with T2DM, in whom the metabolic/PI3K pathway is known to be inhibited.
Research Design AND Methods
Subjects and Studies
We studied 13 healthy subjects (9 male/4 female) and 6 patients (3 male/3 female) with T2DM. Their characteristics are shown in Table 1. Informed written consent was obtained from all subjects after explanation of the nature, purpose, and potential risks of these studies. The study protocol was approved by the institutional review board of Temple University Hospital. None of the healthy subjects had a family history of diabetes or other endocrine disorders or were taking medications. The patients with T2DM were treated with long-acting insulin (3/6), short-acting insulin (2/6), sulfonylureas (2/6), metformin (5/6), blood pressure–lowering drugs (5/6), and lipid-lowering drugs (4/6). All drugs except insulin were discontinued 2 days before admission. The last insulin dose was taken 2 h before admission. Body weight of all study volunteers was stable for at least 2 months before the studies. Subjects were admitted to Temple University Hospital’s Clinical Research Center on the evening before the studies, which began at ∼8:00 a.m. after an overnight fast. The following three studies were performed.
Table 1.
Studies and study subjects
| 1 HG/HI | 2 HG/HI+L | 3 HG/HI | |
|---|---|---|---|
| DM | No | No | Yes |
| Sex | 4M/2F | 5M/2F | 3M/3F |
| Age, years | 27 ± 3 | 31 ± 5 | 53 ± 1 |
| WT, kg | 81.0 ± 6.4 | 87.7 ± 8.6 | 90.5 ± 9.2 |
| HT, cm | 170 ± 4 | 174 ± 3 | 169 ± 5 |
| BMI, kg/m2 | 27.9 ± 2.0 | 29.2 ± 3.3 | 31.8 ± 2.8 |
| FBG, mg/dL | 85.7 ± 2.6 | 89.6 ± 3.3 | 162 ± 3 |
| FBG, mmol/L | 4.8 ± 0.1 | 5.0 ± 0.2 | 9.0 ± 0.2 |
| A1C, % | 5.4 ± 0.2 | 5.6 ± 0.2 | 8.5 ± 0.7 |
| A1C, mmol/mol | 36 ± 1 | 38 ± 1 | 69 ± 5 |
| DM duration, years | — | — | 14 ± 4 |
DM, diabetes mellitus; F, female; FBG, fasting blood glucose; HG, high glucose (hyperglycemia); HG/HI+L, hyperglycemia/hyperinsulinemia plus lipid; HI, high insulin (1 mU/kg/min); HT, height; M, male; WT, weight.
Study 1: 8-Hour Hyperglycemic-Hyperinsulinemic (No Insulin Infusion) Clamps in Healthy Subjects (n = 6)
In this study, endogenous hyperinsulinemia was the result of infusions with 20% glucose i.v. (to produce glucose levels of ∼200–250 mg/dL, ∼11.1–13.9 mmol/L). Plasma electrolytes, body weight, and fluid balances were monitored every 4 h. Potassium (20 mg) and magnesium (400 g) were given orally if needed.
Study 2: 8-Hour Hyperglycemic-Hyperinsulinemic (No Insulin Infusion) Clamps With Coinfusion of Lipid/Heparin in Healthy Subjects (n = 7)
Lipid/heparin infusions were started together with the glucose infusions at 0 h and consisted of intravenous infusion of Intralipid III, a 20% fat emulsion (1.5 mL/min; Abbott Laboratories, Chicago, IL) and heparin (a 200-unit bolus followed by infusion of 0.4 units/kg/min).
Study 3: 8-Hour Isoglycemic-Hyperinsulinemic (Insulin Infusion at a Rate of 2 mU/kg/min) Clamps in 6 Patients With T2DM
Glucose was clamped at the patient’s postabsorptive glucose level (isoglycemic clamp) by a variable rate infusion of 20% glucose.
Fat Biopsies
Immediately before the infusions and again after 8 h, open subcutaneous fat biopsies were obtained from the lateral aspect of the upper thigh under local anesthesia by a surgeon as previously described (13).
RT-PCR
Total RNA was isolated from frozen adipose tissues, and real-time RT-PCR was performed with an SYBR Green One-Step qRT-PCR kit (cat. no. 75770; Affymetrix, Santa Clara, CA) and an Eppendorf Mastercycler ep realplex cycler as previously described (4). Primers used were as follows: human GRP78 sense gttggtggctcgactcgaat, antisense cgctacagcttcatctggg; human/mouse XBP1s sense ttgagaaccaggagttaa, antisense cctgcacctgctgcggact; human activating transcription factor 4 (ATF4) sense ccacgttggatgacac, antisense ggcttcctatctccttcag; human CHOP sense ggagaaccaggaaacggaaac, antisense tcttcagctagctgtgccac; human phosphodiesterase 3b (PDE3B) sense gccacagatgttgctacatgc, antisense gacaggcagccataactctc; human protein disulfide-isomerase A3 (PDI-A3) sense ctgtggcatccatcttggct, antisense ggtgtggtcactgtaagaacct; human calreticulin sense accctgagtacaagggtgag, antisense agatggtgccagacttgacc; human calnexin sense cagaccagtggtatggagtat, antisense gactgacagtgccaccatct; and human/mouse 18S (cat. no. 5103G; Ambion). Triplicate samples were normalized with 18s or β-actin.
Immunoprecipitation
Rabbit anti–IRS-1 sera (from Upstate, Lake Placid, NY) and protein A agarose beads were used to immunoprecipitate IRS-1–associated PI3K from fat extracts (100 µg).
Western Blots
Adipose tissues were extracted and protein content was measured using the Bio-Rad protein assay (Bio-Rad, Richmond, CA). Sample preparation and performance of Western blots were as previously described (4). The primary antibodies used were as follows: a rabbit antiserum (Upstate) that recognizes the N-SH2 region of PI3K and the regulatory p85 subunit of PI3K.
Analytical Procedures
Plasma glucose was measured with a glucose analyzer (YSI, Yellow Springs, OH). Insulin was determined in serum by radioimmunoassay with a specific antibody that cross-reacts minimally (0.2%) with proinsulin (Linco, St. Charles, MO). Free fatty acids (FFAs) were measured in plasma, containing Paraoxon (Sigma-Aldrich, St. Louis, MO), a lipoprotein lipase inhibitor, with a kit from Wako Pure Chemical (Richmond, VA).
Statistical Analysis
All data are expressed as means ± SE. Pre- and postbiopsy values in Fig. 1E–G were compared using the two-tailed t test. Normality was tested with the Kolmogorov-Smirnov test. The Wilcoxon signed rank test was used to determine significance of the data that were not normally distributed. Two-way ANOVA was used in Fig. 1D to test for significant differences between studies with Student-Newman-Keuls post hoc analysis. If data were not normally distributed, the Kruskal-Wallis one-way ANOVA with Dunn post hoc analysis was used. To test the differences in glucose infusion rate (GIR) across time, one-way repeated-measures ANOVA with Student-Newman-Keuls post hoc analysis was used. If data were not normally distributed, the Friedman repeated-measures ANOVA on ranks was used.
Figure 1.
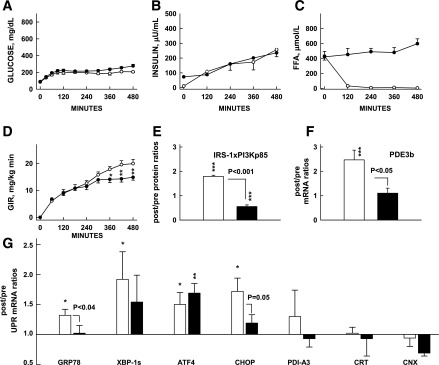
Effects of lipid-induced insulin resistance on UPR mRNA. Effects of 8-h hyperglycemic-hyperinsulinemic clamps with (closed symbols) or without (open symbols) lipid/heparin infusions on plasma glucose, insulin, and FFA concentrations and GIRs needed to maintain hyperglycemia (GIR) (A–D) on after/before ratios of IRS-1–associated PI3K (p85) protein and after/before mRNA of PDE3b, two insulin targets in adipose tissue (E and F) and seven UPR after/before mRNA ratios (G). Shown are means ± SE; *P < 0.05, **P < 0.02, ***P < 0.01 compared with before/after ratios of 1.0 (paired Student t test). CNX, calnexin; CRT, calreticulin; IRS1xPI3Kp85, IRS1-associated PI3K 85 KD protein; PDI-A3, protein disulfide-isomerase A3.
Results
Lipid-Induced Acute Insulin Resistance Inhibits Insulin Stimulation of UPR mRNA in Adipose Tissue of Healthy Subjects
Infusion of glucose, either without or with infusion of lipid in healthy subjects (studies 1 and 2), (Table 1) resulted in similar degrees of hyperglycemia and hyperinsulinemia but different levels of plasma FFA (Fig. 1A–C). Lipid infusion resulted in systemic (Fig. 1D) and adipose tissue insulin resistance (inhibition of insulin-stimulated PI3K activation [Fig. 1E] and PDE3B mRNA [Fig. 1F]).
Hyperglycemic-hyperinsulinemia increased after/before mRNA ratios of GRP78, XBP1s, ATF4, and CHOP. Hyperglycemic-hyperinsulinemia with lipid infusion–induced insulin resistance was associated with significantly reduced insulin-mediated increases in after/before mRNA ratios of GRP78 and Chop (Fig. 1G).
UPR Pathway Array Confirms UPR mRNA Stimulation by Insulin and the Prevention of This Effect by Lipid Infusion
To confirm the effects of insulin and lipid-induced insulin resistance on a larger number of UPR markers, we performed a UPR pathway–associated gene expression PCR array with pooled adipose tissue (aliquots of 4 biopsy samples each) from studies 1 and 2. In response to hyperinsulinemia, after/before mRNA ratios of 20 of the 84 UPR markers in the array rose >1.5-fold above basal, whereas 3 decreased to <75% of basal. Coinfusion of lipid decreased the insulin-induced rise in all 20 UPR markers (from 1.98 ± 0.14- to 1.08 ± 0.07-fold, P < 0.001) and increased the insulin-induced decrease in all 3 UPR markers (from 0.25 ± 0.08 to 1.07 ± 0.13, P < 0.02).
These results supported in a large number of UPR markers the finding that insulin stimulated, whereas lipid-mediated metabolic/PI3K insulin resistance was associated with inhibition of insulin-stimulated UPR transcription (Table 2).
Table 2.
Effects of insulin and lipid-induced insulin resistance on differentially expressed UPR mRNA
| Gene bank accession no. | Symbol | Description | HG+HI (study 1) increase over basal >1.5 fold | HG+HI+lipid (study 2) |
|---|---|---|---|---|
| UP binding, protein folding | ||||
| NM014278 | HSPA4L | Heat shock 70kDa protein 4-like | 2.95 | 1.15 |
| NM030752 | T-CP1 | T-complex 1 | 1.77 | 1.11 |
| NM198334 | GANAB | Glucosidase, α; neutral AB | 1.71 | 0.77 |
| NM021130 | PPIA | Peptidylprolyl isomerase A | 1.58 | 1.15 |
| NM013247 | HTRA2 | Htr A serine peptidase 2 | 1.52 | 1.04 |
| NM019891 | EROILB | Erol-like β | 1.53 | 1.18 |
| Translation regulation | ||||
| NM032025 | eIF2α | Eukaryotic translation initiation factor 2A | 1.78 | 1.47 |
| NM004836 | eIF2αK3 | Eukaryotic translation initiation factor-2α kinase 3 PERK | 1.58 | 1.22 |
| NM14330 | PPP1R15A | Protein phosphatase 1, regulatory subunit 15A GADD 34 | 1.55 | 0.61 |
| ER-associated destruction (ERAD) | ||||
| NM153692 | HTRA4 | HtrA serine peptidase 4 | 4.12 | 1.31 |
| NM014685 | HERPUD1 | Homocysteine-inducible ER stress–inducible ubiquitine-like domain member-1 | 1.67 | 1.23 |
| NM013247 | HTRA2 | HtrA serine peptidase 2 | 1.52 | 1.04 |
| Transcription factors | ||||
| NM001433 | ERN1 | ER to nucleus signaling 1, IRE1 | 2.50 | 0.38 |
| NM005080 | XBP1 | X-box binding protein 1 | 2.22 | 1.29 |
| NM004083 | DDIT3 | DNA damage–inducible transcript 3, CHOP | 2.12 | 1.72 |
| NM001675 | ATF4 | Activating transcription factor 4 | 1.76 | 1.23 |
| NM004381 | ATF6B | Activating transcription 6β | 1.68 | 0.76 |
| HSP | ||||
| NM005527 | HSP AIL | Heat shock 70 kDa protein 1-like | 2.50 | 0.52 |
| NM006644 | HSP 1H | Heat shock 105 kDa protein 1 | 1.78 | 1.02 |
| NM006260 | DNAJC3 | Hsp40 homolog, subfamily C, member 3 | 1.76 | 1.42 |
| (mean 1.98 ± 0.14, decrease to <0.25 of basal) | (mean 1.08 ± 0.07; P < 0.001) | |||
| NM005194 | CEBPB | CCAAT/enhancer-binding protein β, C/EBP β | 0.20 | 1.34 |
| NM025191 | EDEM3 | ER degradation enhancer mannosidase α-like 3 | 0.14 | 0.94 |
| NM005346 | HSPA1B | Heat shock 70 kDa protein-1 B | 0.41 | 0.94 |
| (mean 0.25 ± 0.08) | (mean 1.07 ± 0.13; P < 0.02) |
Subcutaneous upper-thigh fat biopsies were obtained before and after 8-h hyperglycemic-hyperinsulinemic clamps without (HG+HI) and with (HG+HI+lipid) coinfusion of lipid. Shown are after/before mRNA ratios from pooled fat biopsies (n = 4) determined with a human UPR pathway array (cat. no. PAH-098Z; SABiosciences Co.).
Insulin Stimulation of the UPR Is Reduced in Chronically Insulin-Resistant Patients With T2DM
To examine effects of chronic insulin resistance on ER stress, we compared UPR responses with comparable hyperglycemic-hyperinsulinemia in six insulin-resistant patients with T2DM with those in six healthy control subjects (study 1 vs. 3) (Table 1). Insulin-stimulated glucose uptakes (GIR) were significantly lower in T2DM patients than in control subjects, indicating systemic insulin resistance. Whereas basal UPR mRNA levels were not significantly different, in response to hyperinsulinemia, GRP78, XBP1s, ATF4, and CHOP mRNAs rose in control subjects but not in patients with T2DM. This showed that chronic metabolic/PI3K insulin resistance was associated with inhibition of insulin stimulation of UPR mRNA in subcutaneous adipose tissue of patients with T2DM (Fig. 2).
Figure 2.
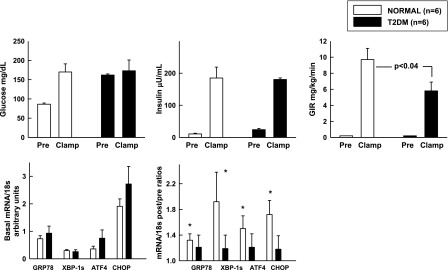
Effects of comparable hyperglycemia hyperinsulinemia for 8 h on GIR and UPR mRNA in patients with T2DM and nondiabetic control subjects. Insulin was infused at 2 mU/kg/min in T2DM patients and in nondiabetic control subjects. In T2DM patients, glucose was clamped at isoglycemic levels (i.e., at their postabsorptive hyperglycemic levels). Shown are means ± SE preclamp and clamp (60–240 min) glucose, insulin, and GIR values. Basal UPR mRNA/18s and after/before UPR mRNA/18s ratios, *P < 0.05 compared with an after/before ratio of 1.0.
Discussion
This study showed that in normal subjects, lipid infusions, known to inhibit the metabolic/PI3K insulin-signaling pathway (18–20) not only inhibited systemic insulin actions on glucose uptake and plasma FFA levels but also decreased ER stress responses in their adipose tissue. Moreover, in obese T2DM patients, in whom the metabolic/PI3K pathway is chronically inhibited (21), ER stress responses to insulin were similarly inhibited. Together, these results suggested, but did not prove, that inhibition of the PI3K insulin signaling and inhibition of insulin-induced ER stress responses may be causally related.
Inasmuch as insulin-induced lowering of plasma FFA levels was associated with a rise in ER stress marker mRNA, our results seem to disagree with studies showing stimulation of ER stress by an increase in FFAs in 3T3-L1 preadipocytes (22–24). However, these in vitro data cannot easily be compared with results obtained under the more complex in vivo situation. In fact, the in vivo results may reflect two counteracting effects, namely, UPR stimulation by FFAs, on one hand, and a larger reduction of ER stress caused by FFA-induced inhibition of insulin action on the other hand.
The finding that inhibiting the metabolic insulin actions was associated with decreased insulin-mediated ER stress responses suggested that the ER stress responses were the consequence of metabolic insulin actions, for instance, on glucose uptake/metabolism and protein synthesis. Supporting this conclusion were our previous findings (14) that insulin-induced ER stress was associated with increased protein synthesis, known to be stimulated by insulin (25) and increased production of posttranslational protein modifications including ubiquitinations, suggesting an increase in unfolded proteins, a major cause for ER stress.
Inasmuch as ER stress can be produced by insulin, the development of insulin resistance could be considered an adaptive defense to prevent further increase in insulin-induced ER stress. Similar views, i.e., that insulin resistance may be an appropriate cellular defense against stressful overnutrition and hyperinsulinemia, have recently been proposed (26–29). Nevertheless, even though insulin resistance may be an appropriate and adaptive cellular response, it will become ineffective and overall maladaptive if its cause, for instance, excess caloric intake, continues and the nutrients that cannot enter the cells accumulate extracellularly.
In summary, we showed 1) that lipid infusions produced acute insulin resistance (inhibition of insulin-mediated activation of PI3K) and diminished insulin-mediated ER stress responses in adipose tissue of normal subjects and 2) that insulin was unable to increase ER stress responses in chronically insulin-resistant patients with T2DM. These results suggest, but do not prove, that inhibition of the metabolic PI3K insulin pathway was responsible for the decrease in insulin-mediated ER stress responses in adipose tissue of nondiabetic and diabetic subjects and could be an adaptive defense against further increase in ER stress.
Article Information
Acknowledgments. The authors thank Maria Mozzoli and Yan Chen for excellent technical assistance and Constance Harris Crews for typing the manuscript.
Funding. This work was supported by grants from the National Institutes of Health (R01-DK58895 and DK090588) and a grant from the American Diabetes Association (1-10-CT-06) (all to G.B.).
Duality of Interest. No potential conflicts of interest relevant to this article were reported.
Author Contributions. G.B. designed the study and wrote the manuscript. P.C. and C.H. contributed and researched data. K.K., B.P., and L.F. contributed data and contributed to the discussion. G.B. is the guarantor of this work and, as such, had full access to all the data in the study and takes responsibility for the integrity of the data and the accuracy of the data analysis.
References
- 1.Ozcan U, Cao Q, Yilmaz E, et al. Endoplasmic reticulum stress links obesity, insulin action, and type 2 diabetes. Science 2004;306:457–461 [DOI] [PubMed] [Google Scholar]
- 2.Hirosumi J, Tuncman G, Chang L, et al. A central role for JNK in obesity and insulin resistance. Nature 2002;420:333–336 [DOI] [PubMed] [Google Scholar]
- 3.Nakatani Y, Kaneto H, Kawamori D, et al. Involvement of endoplasmic reticulum stress in insulin resistance and diabetes. J Biol Chem 2005;280:847–851 [DOI] [PubMed] [Google Scholar]
- 4.Boden G, Duan X, Homko C, et al. Increase in endoplasmic reticulum stress-related proteins and genes in adipose tissue of obese, insulin-resistant individuals. Diabetes 2008;57:2438–2444 [DOI] [PMC free article] [PubMed] [Google Scholar]
- 5.Sharma NK, Das SK, Mondal AK, et al. Endoplasmic reticulum stress markers are associated with obesity in nondiabetic subjects. J Clin Endocrinol Metab 2008;93:4532–4541 [DOI] [PMC free article] [PubMed] [Google Scholar]
- 6.Gregor MF, Yang L, Fabbrini E, et al. Endoplasmic reticulum stress is reduced in tissues of obese subjects after weight loss. Diabetes 2009;58:693–700 [DOI] [PMC free article] [PubMed] [Google Scholar]
- 7.Lee AH, Scapa EF, Cohen DE, Glimcher LH. Regulation of hepatic lipogenesis by the transcription factor XBP1. Science 2008;320:1492–1496 [DOI] [PMC free article] [PubMed] [Google Scholar]
- 8.Flamment M, Kammoun HL, Hainault I, Ferré P, Foufelle F. Endoplasmic reticulum stress: a new actor in the development of hepatic steatosis. Curr Opin Lipidol 2010;21:239–246 [DOI] [PubMed] [Google Scholar]
- 9.Deng Y, Wang ZV, Tao C, et al. The Xbp1s/GalE axis links ER stress to postprandial hepatic metabolism. J Clin Invest 2013;123:455–468 [DOI] [PMC free article] [PubMed] [Google Scholar]
- 10.So J-S, Hur KY, Tarrio M, et al. Silencing of lipid metabolism genes through IRE1α-mediated mRNA decay lowers plasma lipids in mice. Cell Metab 2012;16:487–499 [DOI] [PMC free article] [PubMed] [Google Scholar]
- 11.Hasty AH, Harrison DG. Endoplasmic reticulum stress and hypertension - a new paradigm? J Clin Invest 2012;122:3859–3861 [DOI] [PMC free article] [PubMed] [Google Scholar]
- 12.Hosogai N, Fukuhara A, Oshima K, et al. Adipose tissue hypoxia in obesity and its impact on adipocytokine dysregulation. Diabetes 2007;56:901–911 [DOI] [PubMed] [Google Scholar]
- 13.Boden G, Silviera M, Smith B, Cheung P, Homko C. Acute tissue injury caused by subcutaneous fat biopsies produces endoplasmic reticulum stress. J Clin Endocrinol Metab 2010;95:349–352 [DOI] [PMC free article] [PubMed] [Google Scholar]
- 14.Boden G, Cheung P, Salehi S, et al. Insulin regulates the unfolded protein response in human adipose tissue. Diabetes 2014;63:912–922 [DOI] [PMC free article] [PubMed] [Google Scholar]
- 15.Jiang ZY, Lin YW, Clemont A, et al. Characterization of selective resistance to insulin signaling in the vasculature of obese Zucker (fa/fa) rats. J Clin Invest 1999;104:447–457 [DOI] [PMC free article] [PubMed] [Google Scholar]
- 16.Cusi K, Maezono K, Osman A, et al. Insulin resistance differentially affects the PI 3-kinase- and MAP kinase-mediated signaling in human muscle. J Clin Invest 2000;105:311–320 [DOI] [PMC free article] [PubMed] [Google Scholar]
- 17.Li S, Brown MS, Goldstein JL. Bifurcation of insulin signaling pathway in rat liver: mTORC1 required for stimulation of lipogenesis, but not inhibition of gluconeogenesis. Proc Natl Acad Sci U S A 2010;107:3441–3446 [DOI] [PMC free article] [PubMed] [Google Scholar]
- 18.Boden G, Jadali F, White J, et al. Effects of fat on insulin-stimulated carbohydrate metabolism in normal men. J Clin Invest 1991;88:960–966 [DOI] [PMC free article] [PubMed] [Google Scholar]
- 19.Dresner A, Laurent D, Marcucci M, et al. Effects of free fatty acids on glucose transport and IRS-1-associated phosphatidylinositol 3-kinase activity. J Clin Invest 1999;103:253–259 [DOI] [PMC free article] [PubMed] [Google Scholar]
- 20.Yu C, Chen Y, Cline GW, et al. Mechanism by which fatty acids inhibit insulin activation of insulin receptor substrate-1 (IRS-1)-associated phosphatidylinositol 3-kinase activity in muscle. J Biol Chem 2002;277:50230–50236 [DOI] [PubMed] [Google Scholar]
- 21.Saltiel AR, Kahn CR. Insulin signalling and the regulation of glucose and lipid metabolism. Nature 2001;414:799–806 [DOI] [PubMed] [Google Scholar]
- 22.Schröder M, Kaufman RJ. The mammalian unfolded protein response. Annu Rev Biochem 2005;74:739–789 [DOI] [PubMed] [Google Scholar]
- 23.Guo W, Wong S, Xie W, Lei T, Luo Z. Palmitate modulates intracellular signaling, induces endoplasmic reticulum stress, and causes apoptosis in mouse 3T3-L1 and rat primary preadipocytes. Am J Physiol Endocrinol Metab 2007;293:E576–E586 [DOI] [PubMed] [Google Scholar]
- 24.Jiao P, Ma J, Feng B, et al. FFA-induced adipocyte inflammation and insulin resistance: involvement of ER stress and IKKβ pathways. Obesity (Silver Spring) 2011;19:483–491 [DOI] [PubMed] [Google Scholar]
- 25.Proud CG. Regulation of protein synthesis by insulin. Biochem Soc Trans 2006;34:213–216 [DOI] [PubMed] [Google Scholar]
- 26.Saltiel AR. Insulin resistance in the defense against obesity. Cell Metab 2012;15:798–804 [DOI] [PubMed] [Google Scholar]
- 27.Hoehn KL, Salmon AB, Hohnen-Behrens C, et al. Insulin resistance is a cellular antioxidant defense mechanism. Proc Natl Acad Sci U S A 2009;106:17787–17792 [DOI] [PMC free article] [PubMed] [Google Scholar]
- 28.Boden G. Pathogenesis of type 2 diabetes. Insulin resistance. Endocrinol Metab Clin North Am 2001;30:801–815, v [DOI] [PubMed] [Google Scholar]
- 29.Unger RH. Lipid overload and overflow: metabolic trauma and the metabolic syndrome. Trends Endocrinol Metab 2003;14:398–403 [DOI] [PubMed] [Google Scholar]