Abstract
Introduction:
Recent technology developments have demonstrated the benefit of using whole slide imaging (WSI) in computer-aided diagnosis. In this paper, we explore the feasibility of using automatic WSI analysis to assist grading of clear cell renal cell carcinoma (RCC), which is a manual task traditionally performed by pathologists.
Materials and Methods:
Automatic WSI analysis was applied to 39 hematoxylin and eosin-stained digitized slides of clear cell RCC with varying grades. Kernel regression was used to estimate the spatial distribution of nuclear size across the entire slides. The analysis results were correlated with Fuhrman nuclear grades determined by pathologists.
Results:
The spatial distribution of nuclear size provided a panoramic view of the tissue sections. The distribution images facilitated locating regions of interest, such as high-grade regions and areas with necrosis. The statistical analysis showed that the maximum nuclear size was significantly different (P < 0.001) between low-grade (Grades I and II) and high-grade tumors (Grades III and IV). The receiver operating characteristics analysis showed that the maximum nuclear size distinguished high-grade and low-grade tumors with a false positive rate of 0.2 and a true positive rate of 1.0. The area under the curve is 0.97.
Conclusion:
The automatic WSI analysis allows pathologists to see the spatial distribution of nuclei size inside the tumors. The maximum nuclear size can also be used to differentiate low-grade and high-grade clear cell RCC with good sensitivity and specificity. These data suggest that automatic WSI analysis may facilitate pathologic grading of renal tumors and reduce variability encountered with manual grading.
Keywords: Computer-aided diagnosis, Fuhrman nuclear grade, nuclear size distribution imaging, renal cell carcinoma, whole slide imaging
INTRODUCTION
Whole slide imaging (WSI) has introduced several novel applications in digital pathology.[1,2,3,4,5] Recent studies have applied automatic image analysis methods to WSI slides (termed automatic WSI analysis hereafter), thereby providing useful diagnostic, therapeutic, and prognostic information.[6,7,8] This novel approach has allowed image analysis tools to more accurately and reproducibly provide a quantitative evaluation of cellular material on digital pathology slides.
In this study, we applied automatic WSI analysis slides to facilitate grading of clear cell renal cell carcinoma (RCC). Clear cell RCC has been manually (i.e. using conventional light microscopy) graded for decades by pathologists using the Fuhrman nuclear grade for prognosis evaluation.[9,10,11] Studies have shown that Fuhrman nuclear grade is an independent factor that determines survival of patients with clear cell RCC.[12,13,14,15] This grading system uses nuclear size and nuclear polymorphism to grade RCC. Grades I, II, and III are determined by nuclear size (nuclear diameter of 10 μm = Grade I, 15 μm = Grade II, 20 μm = Grade III), whereas Grade IV is also determined by nuclear polymorphism and mitoses. The Fuhrman nuclear grade is determined by the most malignant features in one high power field,[9] thus implying that grading of these tumors requires an exhaustive microscopic examination on the entire slide. The diagnostic intra- and inter-observer agreement for Fuhrman nuclear grade has been questioned.[16,17,18,19] As a result, more simplified systems, such as two-tier and three-tier grading systems, have been proposed to achieve better concordance, while retaining comparable prognostic evaluation power.[20,21,22] Despite of this improvement, the tedious task of determining Fuhrman nuclear grade may be better handled using more efficient, objective, and quantitative methods, such as automatic WSI analysis.
To test this hypothesis, we applied automatic WSI analysis, previously described by our group,[23] to hematoxylin and eosin (H&E)-stained slides of clear cell RCC and calculated the spatial distribution of nuclear size. The distribution images ascertained may also provide a panoramic view to assist pathologists in quickly locating high-grade (“hot spot”) regions of interest that will lead to better diagnostic concordance and accuracy. We further examined whether the distribution images can provide the assignment of Fuhrman nuclear grades. The maximum nuclear size was correlated with the Fuhrman nuclear grade manually determined by an experienced pathologist.
MATERIALS AND METHODS
Case Selection
A total of 39 de-identified H&E-stained glass slides of clear cell RCC were selected from the archives at the University of Pittsburgh Medical Center following Institutional Review Board approval. The stain quality, diagnosis, and Fuhrman nuclear grade of RCC were determined by an experienced genitourinary surgical pathologist (AVP). A total of 3, 11, 12, and 13 cases were selected for Grades I, II, III, and IV, respectively. We selected only three cases for Grade I because of its rarity (5-10%) among clear cell RCC cases.[10,20,21]
Automatic Whole Slide Imaging Analysis
The H&E-stained glass slides were digitized using a whole slide scanner (Nanozoomer 2.0 HT, Hamamatsu, Japan) at ×20 magnification using automatic focusing and scanned with a single z-axis. The whole slide images were analyzed using an automatic stain recognition algorithm[23] implemented in WS-Recognizer, a free analysis tool available to the public (http://ws-recognizer.labsolver.org). A support vector machine (SVM)[24] classifier was trained to recognize nuclei using an interactive interface. A person with no specialty training on pathology was engaged in training the classifier. The foreground pixels (i.e. the pixels from nuclei) were manually selected from nuclei in different views across the tissue section, whereas background pixels were manually selected from the remaining regions (e.g. cell body, background tissue, etc.,). The program then sampled the red-blue-green color of pixels to train the classifier. The recognition result of a view was then presented in the navigation window to examine whether the classifier was well-trained. The average training time for each WSI took around 1 min. Once the recognition quality was confirmed by the user, the tool conducted automatic WSI analysis using parallel image recognition, as shown in Figure 1. The tool automatically tessellated a WSI into several equal-sized image blocks with an additional margin to handle the boundary condition. The nuclei in the image blocks were recognized by the SVM classifier, and five iterations of smoothing were used to remove fragments. As what we did in our previous study,[23] the sizes of the recognized nuclei were estimated, and the spatial distribution of nuclear size was calculated using kernel regression:[25,26]
Figure 1.
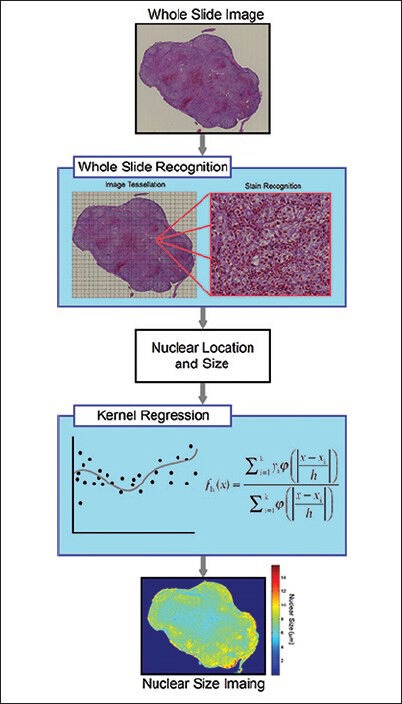
Flow chart summarizing automatic whole slide image analysis. The whole slide image is first tessellated into several equal-sized blocks padded with an additional margin to avoid double counting. The nuclei in each block are then recognized to obtain their size and location. The size and location information are used in kernel regression analysis to calculate the nuclear size distribution across the entire slide

where yi is a scalar feature of the ith stain. h is the kernel bandwidth, and ɸ is the kernel function. A Gaussian distribution function was used as the kernel functions, and the bandwidth was set to 40 μm. To correct for bias due to partial section of nuclei, the regressed nuclear size was multiplied by π/2. The maximum nuclear size of cells present on the entire slide was then recorded. Since overlapping nuclei may cause an overestimation on the largest nuclear size, we took an average on the largest 1% nuclei as an approximation. The nuclear size to distinguish high-grade from low-grade tumors is a trade-off between sensitivity and specificity. Therefore, we used a receiver operating characteristic (ROC) curve to determine the optimal separation size between the high-grade and low-grade tumor. Processing time using a personal laptop (Sony Vaio with 3.10 GHz quad-core processor and 8 GB memory) was on average 20 min for each WSI.
RESULTS
We first applied our method[23] to tumors of different Fuhrman nuclear grades. Figure 2 shows the spatial distribution of nuclear size in the Grade I (a), II (b), III (c), and IV (d) tumors. The corresponding morphology of tumor cell nuclei present in H&E-stained slides is also depicted in Figure 2 at ×20 scanning magnification, and the locations of these fields of view on the WSI are annotated by means of rectangles in the accompanying spatial distribution images. The spatial distribution of nuclear size, which is represented by heat maps, corresponds accurately with the morphologic size of nuclei in tumors of different grades. The red color represents larger nuclear size, whereas blue represents smaller nuclear size. The spatial distribution image offers a panoramic view of nuclear size distribution within the tumor across the entire slide. Figure 3 includes additional cases used to facilitate a qualitative correlation and to present the distribution images from tumors with different Fuhrman grades. High-grade tumors show higher values (red) in the distribution images, whereas low-grade tumors show lower values (blue). The nuclear size shown in the distribution image represents a consistent trend that correlates with morphologic tumor grades. This supports our claim that the spatial distribution of the nuclear size correlates with the manual Fuhrman nuclear grade.
Figure 2.
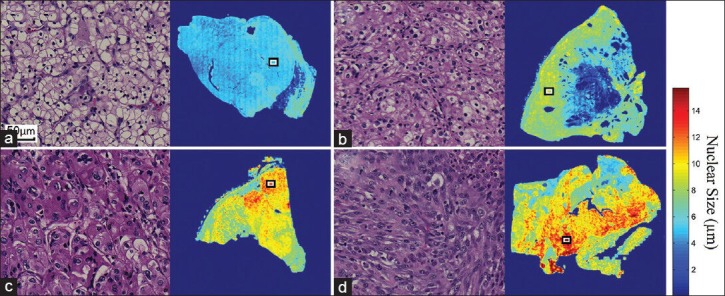
The spatial distribution of nuclear size calculated from (a) A Grade I, (b) A Grade II,c) A Grade III, and (d) A Grade IV clear cell renal cell carcinoma. The nuclei of these tumors are shown at ×20 magnification (left panels, H&E stain), and their corresponding locations within whole slide imaging slides are annotated by rectangles (right panels). The distribution images provide panoramic views of the quantitative measurement that may assist pathologists in better locating tumor regions of higher grade
Figure 3.
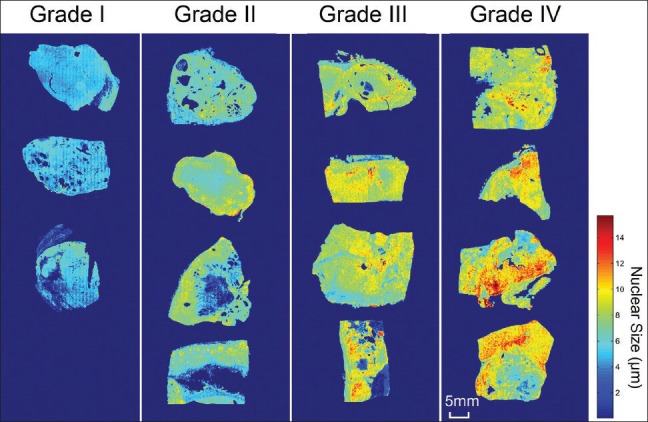
The spatial distribution of nuclear size in clear cell renal cell carcinoma tumors with different Fuhrman grades. The nuclear size shown in the distribution image represents a consistent trend that correlates with manually assigned tumor nuclear grades. High-grade tumors show higher values (red) in the distribution images, whereas low-grade tumors show lower values (blue)
The spatial distribution of nuclear size can assist the inspection on a clear cell RCC tumor, as shown in Figure 4. The tumor annotated in Figure 4a is a high-grade clear cell RCC (Grade IV) with areas of necrosis. Figure 4b shows the spatial distribution of nuclear size calculated from automatic WSI analysis. The red color in this case, which represents regions with larger nuclear size, reveals infiltration of tumor cells into the peripheral tissue. Figure 4c shows the tumor morphology for an area that corresponds to larger nuclear size in the distribution image. Figure 4d shows an area with necrosis, which is indicated by the reduced nuclear size in the inset distribution image. Hence, the distribution images in this study provide a panoramic view of the tumor characteristics that can enable a fast inspection of the entire section.
Figure 4.
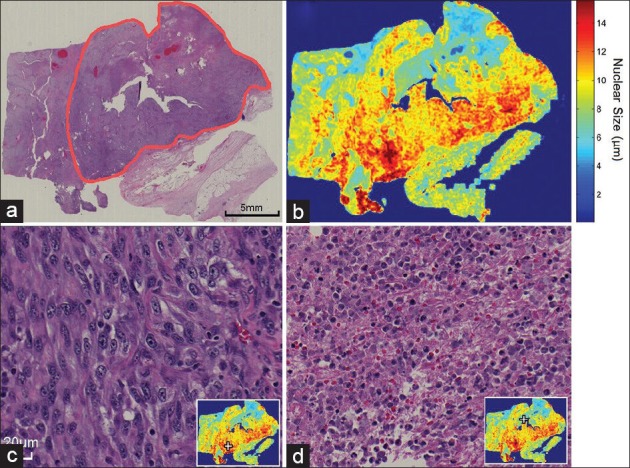
The spatial distribution of nuclear size can be used as a guide to assist pathologists in locating regions of interest. (a) A low magnification overview of a Grade IV clear cell renal cell carcinoma is annotated using a red contour (H&E stain). (b) The spatial distribution of nuclear size can be used to locate high-grade regions (red) as well as necrosis regions (blue). (c) The high-grade region (located at the + mark) shows tumor cells with enlarged and pleomorphic nuclei and a prominent nucleolus. (d) This necrosis region can also be located at the + mark on the distribution image (inset)
The results of our quantitative analysis are demonstrated in Figure 5, which shows the distribution of area ratio with respect to nuclear size in tumors of different grades. As shown in Figure 5, the distributions of high-grade tumors (Grades III and IV) are shifted to the right, as opposed to the distributions of low-grade tumors (Grades I and II), which are centered at the lower nuclear size. This result suggests that nuclear size, like in Fuhrman grade, can be used to differentiate high-grade tumors (Grades III and IV) from low-grade tumors (Grades I and II). However, the distribution of Grades I and II tumors demonstrates substantial overlap centered at a nuclear size of 6 μm. Similarly, the nuclear size distributions of Grades III and IV tumors demonstrate substantial overlap centered at a nuclear size of 9 μm. This indicates that tumor nuclear size may not be able to differentiate between Grades I and II as well as between Grades III and IV.
Figure 5.
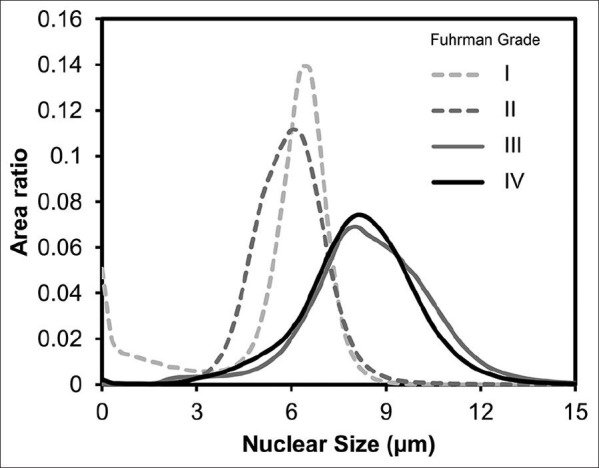
Distribution of area ratio with respect to nuclear size in different tumor grades. The distribution of Grades III and IV tumors shows substantial shift-to-the-right, whereas the distributions of Grades I and II tumors are centered on a nuclear size of 6 μm. This distribution supports a two-tiered grading scheme
Since the Fuhrman nuclear grade is determined by regions with the highest grade, we calculated the maximum nuclear size and compared it across different tumor grades. Figure 6 shows the maximum nuclear size of Grades I-IV tumors. The error bar shows the standard deviation. The maximum nuclear size showed an increasing trend from Grades I and II to Grade III tumors. One-way ANOVA showed significant group differences (P < 0.001), and posthoc analysis using Tukey's criterion showed that there were significant differences between (i) Grades I and III tumors, (ii) Grades I and IV tumors, (iii) Grades II and III tumors, and (iv) Grades II and IV tumors. There was no significant difference in nuclear size between Grades I and II tumors, nor was this encountered between Grades III and IV tumors. This result suggests that the maximum nuclear size can be used to classify high-grade tumors (Grades III and IV) from low-grade tumors (Grades I and II). However, a more detailed classification (e.g. Grade III vs. IV) cannot be achieved using the maximum nuclear size.
Figure 6.
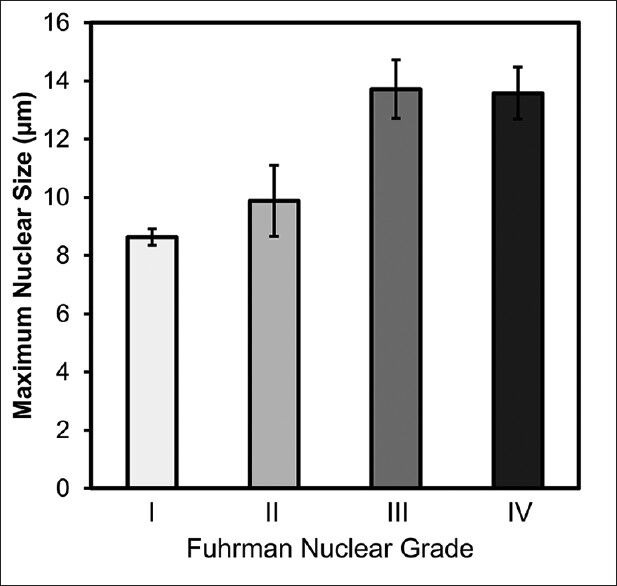
Maximum nuclear size of tumors determined using image analysis compared with manual Fuhrman nuclear grades. The maximum nuclear size presents an increasing trend in Grades I, II, and III/IV. One-way analysis of variance supports a significant group difference (P < 0.001). Posthoc analysis shows significant differences between Grades I and III, I and IV, II and III, as well as II and IV
Figure 7 shows the ROC curve of using the maximum nuclear size to classify low-grade (Grades I and II) from high-grade tumors (Grades III and IV). The optimal operation point was determined to be at a nuclear size of 12.0 μm, which gives a false positive rate of 0.2 and a true positive rate of 1.0. The area under the curve is 0.97, which suggests that there is good sensitivity and specificity when using nuclear size in our image algorithm to grade clear cell RCC tumors.
Figure 7.
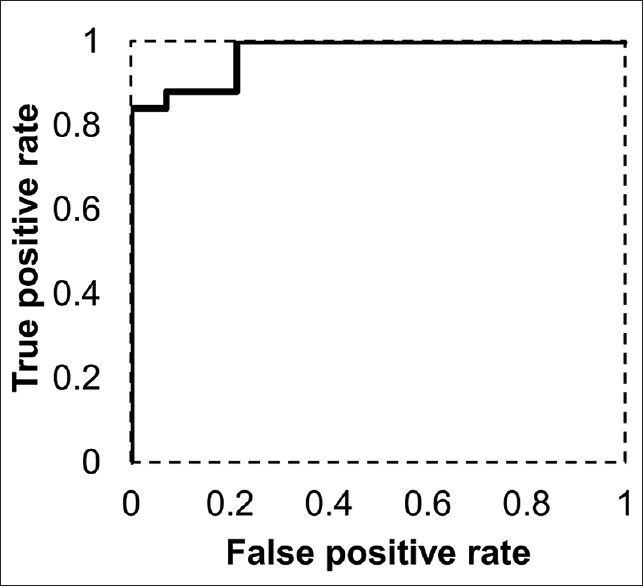
Receiver operating characteristic curve using maximum nuclear size to classify low-grade (Grades I and II) and high-grade tumors (Grades III and IV). The optimal operation point is at a maximum nuclear size of 12.0 μm, which gives a false positive rate of 0.2 and a true positive rate of 1.0. The area under the curve is 0.97, suggesting good sensitivity and specificity using nuclear size in the image analysis algorithm to classify low-grade tumors from high-grade ones
DISCUSSION
This study showed that automatic WSI analysis can be used to assist grading of clear cell RCC. The qualitative analysis showed that the spatial distribution of nuclear size can be used to locate those tumor regions with larger nuclei or that contain tumor necrosis, both of which are crucial features in the prognostic evaluation of clear cell RCC. Our quantitative measurements showed that the maximum nuclear size calculated from automatic WSI analysis can be used to distinguish high-grade tumors (Grades III and IV) from low-grade tumors (Grades I and II) with high sensitivity and specificity. This suggests that automatic WSI analysis may assist with grading clear cell RCC using a two-tier system.[21,22] Since the recent grading system recommended by the International Society of Urological Pathology (ISUP) considers predominately nucleolar prominence,[27] which correlates with nuclear size,[28] nuclear size calculated automatically with WSI analysis offers a simple method for quantitative tumor grading.
A novel finding in this study is the spatial distribution of nuclear size, which retains spatial information that can be leveraged to facilitate locating regions of interest, as demonstrated in Figure 4. It is noteworthy that several other studies have already applied stain classification, morphology detection, or texture analysis to WSI analysis for diagnostic and prognostic evaluation.[6,7,8,29,30,31,32,33] One study also applied image analysis to assist classification of Fuhrman nuclear grade,[34] but these image analysis methods focused mainly on microscopic features and discarded spatial information at the macroscopic or low magnification level. Consequently, the information generated in the aforementioned image analysis studies was not used to assist pathologists with locating regions of interest in the original slide. By contrast, the nuclear size information calculated using our approach can be used either alone or to assist a pathologist to identify regions of interests in the whole slide image. This may eliminate inadvertently missing important regions of high nuclear grading. In clinical application, this technique may help reduce human errors in missing the regions of interest (e.g. areas of tumor with the highest nuclear grade) and improve intra- and inter-observer agreement.
Despite the advantages mentioned above, automatic WSI analysis should be used with caution. This is because image analysis is dependent upon proper processing and preparation of the pathology tissue. For example, slides with bleached or inhomogeneous staining, or those with thick tissue sections may not be suitable for automatic WSI analysis. In our study, we excluded cases with poor H&E staining or where there were uneven tissue sections or fold artifacts that could affect image analysis. Automatic WSI analysis, therefore, requires good quality control measures to avoid possible errors.[35] There are also other limitations in our WSI analysis. One limitation of our approach is that the maximum nuclear size in the slides cannot distinguish Grade I from Grade II tumors. However, this drawback is minimized because studies have shown that Grades I and II tumors have a similar prognosis and that there is limited benefit in distinguishing them.[20,21,22,35] Another limitation is that the maximum nuclear size in the slide cannot distinguish Grade III from Grade IV tumors. This limitation is expected since Grade IV is determined by the morphology of the nuclei, and not just their size. The recent ISUP grading system not only considers nuclear pleomorphism to be important, but also sarcomatoid/rhabdoid differentiation.[27] These tumors will require more advanced image analysis algorithms to better characterize tissue patterns, such as nuclear texture and nuclear shapes. Similarly, the nuclei segmentation algorithm used in our study requires interactive training from users. Although the training took approximately 1 min, this can be better handled using an offline training methods.[37,38,39] Moreover, our automatic WSI analysis could not distinguish inflammatory cells from tumor cells. Therefore, in specimens with a marked tumor inflammatory infiltrate, our method may under-estimate nuclear size. A solution to this problem would involve using immunohistochemistry to specifically label inflammatory and/or cancer cells. Lastly, we have not yet compared our analysis results with the patients’ survival. Whether or not automatic WSI analysis of clear cell RCC can be used as an objective reference for prognostic evaluation requires further investigation.
ACKNOWLEDGMENT
Research reported in this study was supported by the National Institutes of Health (P41EB-001977).
Footnotes
Available FREE in open access from: http://www.jpathinformatics.org/text.asp?2014/5/1/23/137726
REFERENCES
- 1.Fallon MA, Wilbur DC, Prasad M. Ovarian frozen section diagnosis: Use of whole-slide imaging shows excellent correlation between virtual slide and original interpretations in a large series of cases. Arch Pathol Lab Med. 2010;134:1020–3. doi: 10.5858/2009-0320-OA.1. [DOI] [PubMed] [Google Scholar]
- 2.Feldman MD. Beyond morphology: Whole slide imaging, computer-aided detection, and other techniques. Arch Pathol Lab Med. 2008;132:758–63. doi: 10.5858/2008-132-758-BMWSIC. [DOI] [PubMed] [Google Scholar]
- 3.Gilbertson JR, Ho J, Anthony L, Jukic DM, Yagi Y, Parwani AV. Primary histologic diagnosis using automated whole slide imaging: A validation study. BMC Clin Pathol. 2006;6:4. doi: 10.1186/1472-6890-6-4. [DOI] [PMC free article] [PubMed] [Google Scholar]
- 4.Velez N, Jukic D, Ho J. Evaluation of 2 whole-slide imaging applications in dermatopathology. Hum Pathol. 2008;39:1341–9. doi: 10.1016/j.humpath.2008.01.006. [DOI] [PubMed] [Google Scholar]
- 5.Webster JD, Dunstan RW. Whole-slide imaging and automated image analysis: Considerations and opportunities in the practice of pathology. Vet Pathol. 2014;51:211–23. doi: 10.1177/0300985813503570. [DOI] [PubMed] [Google Scholar]
- 6.DiFranco MD, O’Hurley G, Kay EW, Watson RW, Cunningham P. Ensemble based system for whole-slide prostate cancer probability mapping using color texture features. Comput Med Imaging Graph. 2011;35:629–45. doi: 10.1016/j.compmedimag.2010.12.005. [DOI] [PubMed] [Google Scholar]
- 7.Samsi S, Krishnamurthy AK, Gurcan MN. An efficient computational framework for the analysis of whole slide images: Application to follicular lymphoma immunohistochemistry. J Comput Sci. 2012;3:269–79. doi: 10.1016/j.jocs.2012.01.009. [DOI] [PMC free article] [PubMed] [Google Scholar]
- 8.Sertel O, Kong J, Shimada H, Catalyurek UV, Saltz JH, Gurcan MN. Computer-aided prognosis of neuroblastoma on whole-slide images: Classification of stromal development. Pattern Recognit. 2009;42:1093–103. doi: 10.1016/j.patcog.2008.08.027. [DOI] [PMC free article] [PubMed] [Google Scholar]
- 9.Fuhrman SA, Lasky LC, Limas C. Prognostic significance of morphologic parameters in renal cell carcinoma. Am J Surg Pathol. 1982;6:655–63. doi: 10.1097/00000478-198210000-00007. [DOI] [PubMed] [Google Scholar]
- 10.Gudbjartsson T, Hardarson S, Petursdottir V, Thoroddsen A, Magnusson J, Einarsson GV. Histological subtyping and nuclear grading of renal cell carcinoma and their implications for survival: A retrospective nation-wide study of 629 patients. Eur Urol. 2005;48:593–600. doi: 10.1016/j.eururo.2005.04.016. [DOI] [PubMed] [Google Scholar]
- 11.Medeiros LJ, Gelb AB, Weiss LM. Renal cell carcinoma. Prognostic significance of morphologic parameters in 121 cases. Cancer. 1988;61:1639–51. doi: 10.1002/1097-0142(19880415)61:8<1639::aid-cncr2820610823>3.0.co;2-f. [DOI] [PubMed] [Google Scholar]
- 12.Bretheau D, Lechevallier E, de Fromont M, Sault MC, Rampal M, Coulange C. Prognostic value of nuclear grade of renal cell carcinoma. Cancer. 1995;76:2543–9. doi: 10.1002/1097-0142(19951215)76:12<2543::aid-cncr2820761221>3.0.co;2-s. [DOI] [PubMed] [Google Scholar]
- 13.Erdogan F, Demirel A, Polat O. Prognostic significance of morphologic parameters in renal cell carcinoma. Int J Clin Pract. 2004;58:333–6. doi: 10.1111/j.1368-5031.2004.00008.x. [DOI] [PubMed] [Google Scholar]
- 14.Ficarra V, Righetti R, Pilloni S, D’amico A, Maffei N, Novella G, et al. Prognostic factors in patients with renal cell carcinoma: Retrospective analysis of 675 cases. Eur Urol. 2002;41:190–8. doi: 10.1016/s0302-2838(01)00027-6. [DOI] [PubMed] [Google Scholar]
- 15.Tsui KH, Shvarts O, Smith RB, Figlin RA, deKernion JB, Belldegrun A. Prognostic indicators for renal cell carcinoma: A multivariate analysis of 643 patients using the revised 1997 TNM staging criteria. J Urol. 2000;163:1090–5. doi: 10.1016/s0022-5347(05)67699-9. [DOI] [PubMed] [Google Scholar]
- 16.Al-Aynati M, Chen V, Salama S, Shuhaibar H, Treleaven D, Vincic L. Interobserver and intraobserver variability using the Fuhrman grading system for renal cell carcinoma. Arch Pathol Lab Med. 2003;127:593–6. doi: 10.5858/2003-127-0593-IAIVUT. [DOI] [PubMed] [Google Scholar]
- 17.Bektas S, Bahadir B, Kandemir NO, Barut F, Gul AE, Ozdamar SO. Intraobserver and interobserver variability of Fuhrman and modified Fuhrman grading systems for conventional renal cell carcinoma. Kaohsiung J Med Sci. 2009;25:596–600. doi: 10.1016/S1607-551X(09)70562-5. [DOI] [PubMed] [Google Scholar]
- 18.Lang H, Lindner V, de Fromont M, Molinié V, Letourneux H, Meyer N, et al. Multicenter determination of optimal interobserver agreement using the Fuhrman grading system for renal cell carcinoma: Assessment of 241 patients with>15-year follow-up. Cancer. 2005;103:625–9. doi: 10.1002/cncr.20812. [DOI] [PubMed] [Google Scholar]
- 19.Lanigan D, Conroy R, Barry-Walsh C, Loftus B, Royston D, Leader M. A comparative analysis of grading systems in renal adenocarcinoma. Histopathology. 1994;24:473–6. doi: 10.1111/j.1365-2559.1994.tb00557.x. [DOI] [PubMed] [Google Scholar]
- 20.Ficarra V, Martignoni G, Maffei N, Brunelli M, Novara G, Zanolla L, et al. Original and reviewed nuclear grading according to the Fuhrman system: A multivariate analysis of 388 patients with conventional renal cell carcinoma. Cancer. 2005;103:68–75. doi: 10.1002/cncr.20749. [DOI] [PubMed] [Google Scholar]
- 21.Hong SK, Jeong CW, Park JH, Kim HS, Kwak C, Choe G, et al. Application of simplified Fuhrman grading system in clear-cell renal cell carcinoma. BJU Int. 2011;107:409–15. doi: 10.1111/j.1464-410X.2010.09561.x. [DOI] [PubMed] [Google Scholar]
- 22.Sun M, Lughezzani G, Jeldres C, Isbarn H, Shariat SF, Arjane P, et al. A proposal for reclassification of the Fuhrman grading system in patients with clear cell renal cell carcinoma. Eur Urol. 2009;56:775–81. doi: 10.1016/j.eururo.2009.06.008. [DOI] [PubMed] [Google Scholar]
- 23.Yeh FC, Ye Q, Hitchens TK, Wu YL, Parwani AV, Ho C. Mapping stain distribution in pathology slides using whole slide imaging. J Pathol Inform. 2014;5:1. doi: 10.4103/2153-3539.126140. [DOI] [PMC free article] [PubMed] [Google Scholar]
- 24.Cortes C, Vapnik V. Support-vector networks. Mach Learn. 1995;20:273–97. [Google Scholar]
- 25.Parzen E. On estimation of a probability density function and mode. Ann Math Stat. 1962;33:1065–76. [Google Scholar]
- 26.Terrell DG, Scott DW. Variable kernel density estimation. Ann Stat. 1992;20:1236–65. [Google Scholar]
- 27.Delahunt B, Cheville JC, Martignoni G, Humphrey PA, Magi-Galluzzi C, McKenney J, et al. The International Society of Urological Pathology (ISUP) grading system for renal cell carcinoma and other prognostic parameters. Am J Surg Pathol. 2013;37:1490–504. doi: 10.1097/PAS.0b013e318299f0fb. [DOI] [PubMed] [Google Scholar]
- 28.Delahunt B, Sika-Paotonu D, Bethwaite PB, William Jordan T, Magi-Galluzzi C, Zhou M, et al. Grading of clear cell renal cell carcinoma should be based on nucleolar prominence. Am J Surg Pathol. 2011;35:1134–9. doi: 10.1097/PAS.0b013e318220697f. [DOI] [PubMed] [Google Scholar]
- 29.Cooper LA, Kong J, Gutman DA, Wang F, Gao J, Appin C, et al. Integrated morphologic analysis for the identification and characterization of disease subtypes. J Am Med Inform Assoc. 2012;19:317–23. doi: 10.1136/amiajnl-2011-000700. [DOI] [PMC free article] [PubMed] [Google Scholar]
- 30.Gurcan MN, Boucheron LE, Can A, Madabhushi A, Rajpoot NM, Yener B. Histopathological image analysis: A review. IEEE Rev Biomed Eng. 2009;2:147–71. doi: 10.1109/RBME.2009.2034865. [DOI] [PMC free article] [PubMed] [Google Scholar]
- 31.Kothari S, Phan JH, Stokes TH, Wang MD. Pathology imaging informatics for quantitative analysis of whole-slide images. J Am Med Inform Assoc. 2013;20:1099–108. doi: 10.1136/amiajnl-2012-001540. [DOI] [PMC free article] [PubMed] [Google Scholar]
- 32.Lézoray O, Gurcan M, Can A, Olivo-Marin JC. Special issue on whole slide microscopic image processing. Comput Med Imaging Graph. 2011;35:493–5. doi: 10.1016/j.compmedimag.2011.06.008. [DOI] [PubMed] [Google Scholar]
- 33.Wang F, Kong J, Cooper L, Pan T, Kurc T, Chen W, et al. A data model and database for high-resolution pathology analytical image informatics. J Pathol Inform. 2011;2:32. doi: 10.4103/2153-3539.83192. [DOI] [PMC free article] [PubMed] [Google Scholar]
- 34.Kruk M, Osowski S, Kozłowski W, Koktysz R, Markiewicz T, Słodkowska J. Computer-assisted Fuhrman grading system for the analysis of clear-cell renal carcinoma: A pilot study. Przegl Elektrotechniczny R. 2013;89:268–270. [Google Scholar]
- 35.Pantanowitz L, Sinard JH, Henricks WH, Fatheree LA, Carter AB, Contis L, et al. Validating whole slide imaging for diagnostic purposes in pathology: Guideline from the College of American Pathologists Pathology and Laboratory Quality Center. Arch Pathol Lab Med. 2013;137:1710–22. doi: 10.5858/arpa.2013-0093-CP. [DOI] [PMC free article] [PubMed] [Google Scholar]
- 36.Novara G, Martignoni G, Artibani W, Ficarra V. Grading systems in renal cell carcinoma. J Urol. 2007;177:430–6. doi: 10.1016/j.juro.2006.09.034. [DOI] [PubMed] [Google Scholar]
- 37.Al-Kofahi Y, Lassoued W, Lee W, Roysam B. Improved automatic detection and segmentation of cell nuclei in histopathology images. IEEE Trans Biomed Eng. 2010;57:841–52. doi: 10.1109/TBME.2009.2035102. [DOI] [PubMed] [Google Scholar]
- 38.Irshad H, Veillard A, Roux L, Racoceanu D. Methods for nuclei detection, segmentation, and classification in digital histopathology: A review-current status and future potential. IEEE Rev Biomed Eng. 2014;7:97–114. doi: 10.1109/RBME.2013.2295804. [DOI] [PubMed] [Google Scholar]
- 39.Veta M, van Diest PJ, Kornegoor R, Huisman A, Viergever MA, Pluim JP. Automatic nuclei segmentation in H and E stained breast cancer histopathology images. PLoS One. 2013;8:e70221. doi: 10.1371/journal.pone.0070221. [DOI] [PMC free article] [PubMed] [Google Scholar]


