Abstract
Morphological studies of inner hair cell (IHC) synapses with cochlear nerve terminals have suggested that high- and low-threshold fibers differ in the sizes of their pre- and postsynaptic elements as well as the position of their synapses around the hair cell circumference. Here, using high-power confocal microscopy, we measured sizes and spatial positions of presynaptic ribbons, postsynaptic glutamate receptor (GluR) patches, and olivocochlear efferent terminals at eight locations along the cochlear spiral in normal and surgically de-efferented mice. Results confirm a prior report suggesting a modiolar > pillar gradient in ribbon size and a complementary pillar > modiolar gradient in GluR-patch size. We document a novel habenular < cuticular gradient in GluR patch size and a complementary cuticular < habenular gradient in olivocochlear innervation density. All spatial gradients in synaptic elements collapse after cochlear de-efferentation, suggesting a major role of olivocochlear efferents in maintaining functional heterogeneity among cochlear nerve fibers. Our spatial analysis also suggests that adjacent IHCs may contain a different synaptic mix, depending on whether their tilt in the radial plane places their synaptic pole closer to the pillar cells or to the modiolus.
Keywords: auditory nerve, inner ear, synaptic ribbon, glutamate receptor
INTRODUCTION
Each inner hair cell (IHC) in the mammalian inner ear sends information to the brain via 5–30 cochlear nerve fibers, depending on species and cochlear location (Bohne et al. 1982; Liberman et al. 1990; Kujawa and Liberman 2009; Meyer et al. 2009). This population of sensory neurons has been divided into functional subgroups based on spontaneous rate (SR): fibers with the lowest SR have the highest thresholds and vice versa (Liberman 1978). This functional subdivision is presumably key to the impressive dynamic range of the auditory periphery (Sachs and Abbas 1974; Winter et al. 1990).
Ultrastructural studies in cat have shown cochlear-nerve terminals synapsing on the pillar side of IHCs have smaller presynaptic ribbons, larger postsynaptic terminals with more mitochondria, and fewer olivocochlear (OC) efferent synapses than those on the opposite side closer to the modiolus (Liberman 1980a, 1980b; Liberman et al. 1990). Intracellular labeling in cat and guinea pig (Liberman 1982; Tsuji and Liberman 1997) confirmed that pillar-side fibers tend to have high SRs, while modiolar-side fibers tend to have low and/or medium SRs. In a recent confocal study in mouse (Liberman et al. 2011), we showed complementary size gradients for presynaptic ribbons and postsynaptic glutamate receptor (GluR) patches on opposite sides of the IHC, suggesting that the larger ribbons of low-SR fibers were paired with smaller GluR patches and that the reduced sensitivity of low-SR fibers might be explained, in part, by reduced expression of AMPA receptors at the active zone.
This spatial polarization of synaptic organization in the IHC area could be driven by signals internal or external to the hair cell. One obvious external influence is the OC innervation of IHCs and cochlear nerve dendrites (Liberman 1980b). The difference in OC density on modiolar- versus pillar-side terminals (Liberman 1980b) and the temporal coincidence, during development, of the arrival of OC terminals in the IHC area with the appearance of an SR-based dichotomization of cochlear-nerve responses (Pujol and Marty 1970; Walsh and McGee 1987), suggest an OC role in the development and/or maintenance of cochlear nerve heterogeneity.
To test this hypothesis, we compared spatial gradients in synaptic morphology before and after surgical de-efferentation of the adult cochlea. The sizes of thousands of synaptic puncta were extracted from high-power confocal z-stacks of whole-mounts triple-stained for presynaptic ribbons, postsynaptic GluR patches, and OC terminals. In normal ears, our results confirmed the complementary gradients of ribbon- and GluR-patch sizes on the modiolar versus pillar sides of the IHCs (Liberman et al. 2011). They also revealed a novel habenular < cuticular gradient in GluR-patch size, mirrored by a habenular > cuticular gradient in OC innervation density. All the synaptic spatial gradients collapsed after cochlear de-efferentation, consistent with a key role for the OC system in maintaining functional heterogeneity in the cochlear nerve.
The data from normal ears also suggested that adjacent IHCs can differ from each other in the low-SR/high-SR mix of cochlear nerve synapses. An alternation in hair-cell tilt often places the basolateral poles of adjacent IHCs at significantly different positions along a global modiolar-pillar axis. The analysis presented here suggests that the mix of synaptic morphologies present on an IHC is related to its tilt with respect to this axis. This, in turn, is consistent with the idea that the signals driving the differences among cochlear nerve peripheral synapses arise, at least in part, externally to the IHCs.
MATERIALS AND METHODS
Animals and Groups
CBA/CaJ mice, at 6–9 weeks of age, were used for all experiments. OC lesion groups underwent surgery, at 6 weeks, designed to sever the OC bundle in the brainstem, and then were allowed to survive for 3 weeks before harvesting brain and cochlear tissue for histological analysis. Group sizes are described in each of the figure captions. All procedures were approved by the institutional animal care and use committee of the Massachusetts Eye and Ear Infirmary.
Brainstem Lesions and Histological Verification
For brainstem surgery, mice were anesthetized with xylazine (20 mg/kg, i.p.) and ketamine (100 mg/kg, i.p.). For the OC lesion group, the OC bundle was cut stereotaxically through a small hole in the skull from a dorsal approach. After 3 weeks, brainstems were fixed in 4 % paraformaldehyde, cryoprotected (30 % sucrose) and cut on a freezing microtome at 40 μm in the transverse plane. Sections were treated histochemically to reveal the OC fibers with a stain for acetylcholinesterase activity (Osen and Roth 1969).
Cochlear Processing and Immunostaining
Mice were perfused intracardially with 4 % paraformaldehyde in phosphate buffer. Cochleas were decalcified, dissected into half-turns, and permeabilized by freeze/thawing. The half-turns were blocked in 5 % normal horse serum (NHS) with 1 % Triton X-100 (TX) in PBS for 1 h, followed by incubation for ~19 h at 37 °C in primary antibodies diluted in 1 % NHS with 1 % Triton X. For most cochleas in the present study, the primary antibodies were (1) mouse (IgG1) anti-CtBP2 (C-terminal binding protein) from BD Biosciences at 1:200, to quantify presynaptic ribbons; (2) mouse (IgG2a) anti-GluA2 (glutamate receptor subunit A2) from Millipore at 1:2,000, to quantify postsynaptic receptor patches; and (3) rabbit anti-VAT (vesicular acetylcholine transporter) from Sigma at 1:1,000, to quantify the OC terminals. In some ears, a rabbit anti-Myosin VIIa from Proteus Biosciences at 1:200 was substituted for the VAT to help visualize the inner hair cell cytoplasm. Primary incubations were followed by two sequential 60-min incubations at 37 °C in species-appropriate secondary antibodies with 1 % Triton X.
Cochlear Morphometry
All morphometric data was extracted from high-power confocal z-stacks obtained at half-octave intervals along the cochlear spiral from 5.6 to 64 kHz. To accurately identify regions of interest, cochlear lengths were obtained for each case by tracing the cochlear spiral in low-power images of the dissected epithelial whole mounts using a custom ImageJ plugin (http://www.masseyeandear.org/research/ent/eaton-peabody/epl-histology-resources/) that translates cochlear position into frequency according to the published map for the mouse (Muller et al. 2005; Taberner and Liberman 2005). Confocal z-stacks were obtained with a glycerol-immersion objective (63X, numerical aperture = 1.3) at ×3.17 digital zoom on a Leica TCS SP5. Image spacing in the z plane was set to 0.25 μm, and the z-span was carefully adjusted for each stack to include all synaptic elements in all of the 9–12 IHCs in the field of view, typically requiring 75–100 images per stack. Two adjacent stacks were always obtained in each cochlear region sampled.
For most image acquisition, we were interested only in the relative sizes of ribbons and GluR patches within each z-stack. Thus, laser power and photomultiplier-tube gains were adjusted for each stack to minimize the number of saturated pixels, while using the entire dynamic range of the 24-bit RGB image (see Supplementary Fig. 1 in (Liberman et al. 2011)). To measure absolute sizes of ribbons and GluR patches, one set of Control ears was fixed, immunostained, and imaged together, with laser powers and photomultiplier-tube gains held constant across all stacks (set to minimize pixel saturation in regions with the brightest signals).
FIG. 1.
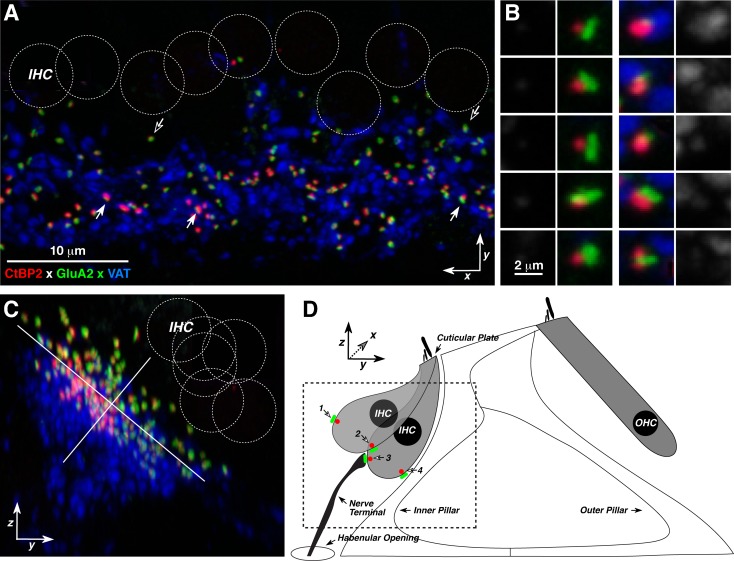
Confocal projections of an image stack from an immunostained cochlear whole-mount of the type used in the present analysis. A Maximal projection (xy plane) of the IHC area immunostained for presynaptic ribbons (CtBP2-red), postsynaptic glutamate receptors (GluA2-green), and efferent terminals (VAT-blue). IHC nuclei (dashed circles) are visible after increasing the red-channel gain in the image (not shown). Locations of five synapses are indicated by arrows. B Reprojections of ten of the synapses from the z-stack in A. For each synapse, the 4 × 4 × 4 μm voxel space centered on the ribbon is projected on the xy plane and then displayed twice: once as a three-channel image (inner columns) and once as a blue-channel-only image (outer columns). The average pixel value from the blue-channel is used as a metric of local efferent density. C Reprojection of the z-stack from A onto the zy plane. Orientation is the same as that schematized in D. Scale bar in A also applies to C. D Schematic of the IHC area showing the orientation of the untransformed x, y, z axes and the staggering of IHC basolateral poles that contributes to the modiolar-pillar elongation of the cloud of synaptic puncta seen in C. Dashed box indicates the rough outline of the region imaged in C. All images are from the 11.3 kHz region of a control mouse.
To count presynaptic ribbons and postsynaptic GluR patches, and to measure their volumes, in each z-stack, we used the connected components tool in Amira software (Visage Imaging). This tool finds and displays all the voxel spaces within a stack that contain exclusively pixel values greater than a criterion value (typically set to 45 out of 255). The results of the connected components analysis for each stack were stored as a spreadsheet containing the volume of each identified element and the x, y, z coordinates of its centroid. This analysis was performed separately for the ribbon and the GluR channels. To compensate for staining differences between cases, we computed the median volume of each structure (ribbon or GluR patch) from each z-stack and expressed each element’s size relative to the median value for that structure, in that z-stack.
To assess the pairing of pre- and postsynaptic elements, we used custom software that extracts the voxel space from the z-stack within a cube, 2 μm to a side, centered on each ribbon (or receptor patch), and produces a thumbnail array of these miniature projections. These thumbnails (e.g., Fig. 1B) can be scanned to differentiate synapses (i.e., ribbons with closely apposed receptor patches) from orphan ribbons or receptor patches. Having identified unpaired ribbons or GluR patches (both are rare occurrences in normal ears), the explicit pairing of remaining ribbons and GluR patches is accomplished by a nearest-neighbor computation between the ribbon and GluR connected-component spreadsheets extracted from the same z-stack. Hair cells in each stack were counted by increasing the image input–output gain (gamma adjust) to reveal the IHC nuclei, which stain faintly with the CtBP2 antibody.
To assess the density of efferent innervation near each afferent synapse, we used the same custom software that extracts the voxel space from the z-stack, but for this analysis, we looked within a cube 4 μm on each side, centered on each ribbon (or receptor patch). In addition to producing a set of thumbnail images, this software also computes the average pixel value in the VAT channel within the small cube centered on each identified synapse in the image stack.
To assess the degree of de-efferentation, we analyzed the maximum projections of each z-stack (in the xy plane; see Fig. 1A). We applied the autothresholding algorithm from ImageJ to the VAT channel of each projection, and then computed the total area encompassed by suprathreshold pixels.
RESULTS
Transforming Coordinate Systems to Analyze Synapses in the IHC Area
In the adult ear, each cochlear nerve fiber typically contacts a single inner hair cell (IHC) via a single unmyelinated terminal that forms a synapse, with a single presynaptic ribbon and a single postsynaptic active zone expressing AMPA-type glutamate receptors (Liberman 1980a; Matsubara et al. 1996; Liberman et al. 2011). In cochlear epithelial whole mounts, these afferent synapses can be identified as juxtaposed pairs of puncta (Fig. 1A, B) after immunostaining for a ribbon protein, CtBP2 (Schmitz et al. 2000; Khimich et al. 2005), and any of several AMPA-type glutamate receptor (GluR) subunits, GluA2, 3, or 4 (Matsubara et al. 1996). In such material, it is easy to count synapses as well as IHCs (Fig. 1A, B), and thus determine the innervation density. Each IHC in the juvenile (6–8 weeks) mouse is innervated by ~10–20 cochlear nerve synapses, depending on cochlear location (Stamataki et al. 2006; Kujawa and Liberman 2009; Meyer et al. 2009a, b; Sergeyenko et al. 2013).
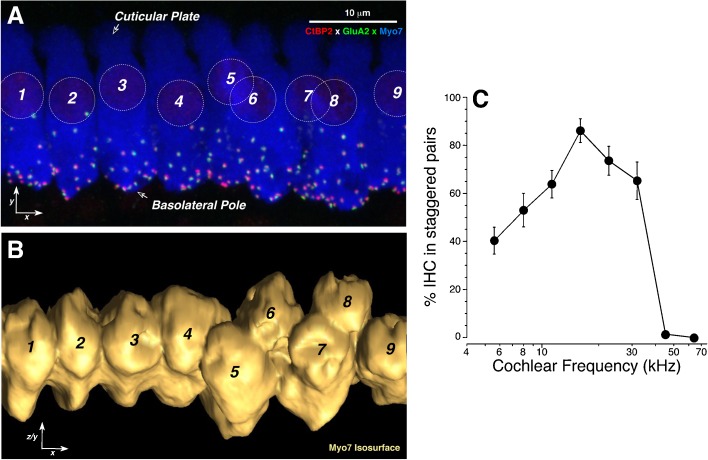
Prior work, in cat and guinea pig, showed that the physiological properties of cochlear nerve fibers differ depending on whether they innervate the side of the IHC closer to the modiolus or the side closer to the pillar cells (Liberman 1982; Tsuji and Liberman 1997). As shown in Figure 1C, when a confocal z-stack of the IHC area in mouse is projected onto the radial plane (the yz plane schematized in Fig. 1D), cochlear nerve synapses are found in a linear cluster that falls at roughly 45° to the plane of the basilar membrane, downsloping from the modiolar side towards the pillar side of the IHCs. As schematized in Figure 1D, this synaptic spread along the modiolar-pillar axis arises because the basolateral poles of adjacent IHCs (where the synapses are found) are often staggered in the yz plane, though their cuticular plates remain strictly aligned. This staggering of IHC basolateral poles can be seen using a cytoplasmic marker of IHCs (myosin VIIa; Fig. 2A) to allow derivation of the 3D surface of each IHC and rotation to view from underneath the basolateral poles of the IHCs. One such rotated image (Fig. 2B) shows a set of four well-aligned IHCs (#s 1–4) next to a set of IHCs with alternating pole positions (#s 5–9). Examination of z-stacks from six control cochleas reveals that staggered positioning is more the rule than the exception, especially in the middle regions of the cochlear spiral (Fig. 2C).
FIG. 2.
Immunostaining with a hair cell marker (myosin VIIa) illustrates the staggered orientation of IHC cell bodies. A Maximal projection (xy plane) of nine adjacent IHCs from the 11.3 kHz region of a cochlea triple-stained for pre- and postsynaptic markers (CtBP2 and GluA2) as well as for myosin VIIA. IHC nuclei are highlighted by dashed circles and numbered. B A 3D surface rendering of the IHCs’ cytoplasm was created in Amira, using the isosurface function in the blue channel, and then rotated around an axis through all the cuticular plates to show the basolateral poles of the same nine IHCs shown in A. IHCs 1–3 are roughly aligned, whereas IHCs 4–9 show staggered position of their basolateral poles. C Prevalence of the staggering of adjacent IHCs as a function of cochlear location. Data are means (±SEMs) from two z-stacks from each of six control ears, at each of eight cochlear locations. The prevalence metric (y-axis) can be described by referring to the images in A, B, where there are four pairs of IHCs (ignoring the unpaired 9th cell): two pairs are aligned and two pairs are staggered, for a measured value of 50 %.
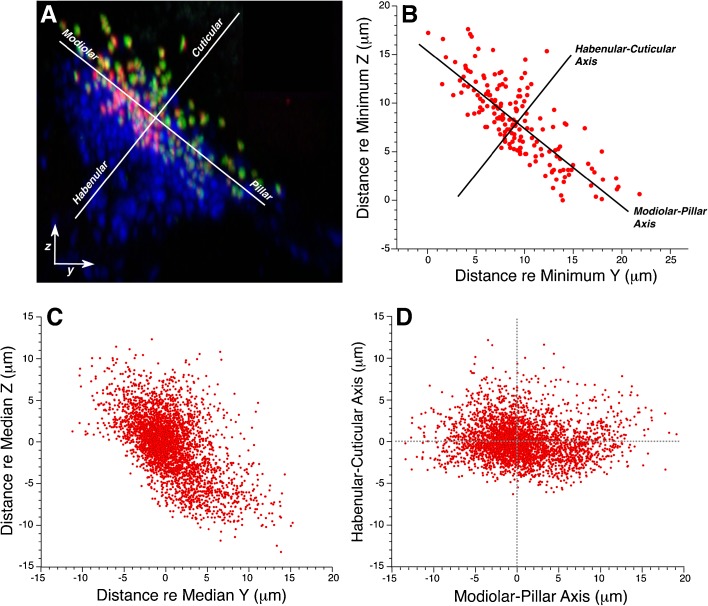
Qualitative examination of yz projections of synaptic puncta, such as in Figure 3A, suggest that the modiolar-pillar axis, as defined by the best-fit straight line to these elongate clusters of synaptic elements, and the orthogonal habenular-cuticular axis, are useful predictors of synaptic morphology. In Figure 3A, ribbon size appears greater in the modiolar half of the cluster than in the pillar half, and GluR-patch size appears greater on the cuticular side than the habenular side. To systematically analyze these trends, we transformed the axes in each z-stack by computing the best-fit straight line to the synaptic cluster in the yz plane, rotating the coordinates to make that line horizontal, and then placing the origin at the median cluster value along the new horizontal axis (Fig. 3D). The scatterplots in Figure 3C, D show superimposed data from 20 z-stacks from 10 control animals at the 11.3 kHz region, before and after axis rotation, respectively. The scatterplots suggest that the orientation of synaptic clusters is reasonably reproducible across cases, given sufficient care in trimming the tissue so that the basilar membrane lies parallel to the slide, and in imaging the tissue so that the line of IHC nuclei is parallel to x axis of the z-stack (e.g., Fig. 1A).
FIG. 3.
Transformation of the yz plane into a set of orthogonal axes defining a modiolar-pillar dimension and a habenular-cuticular dimension. A The original yz projection from Fig. 1A is reproduced here along with the transformed modiolar-pillar and habenular-cuticular axes for this z-stack. B To produce the new modiolar-pillar axis, the best-fit straight line is computed to the set of zy coordinates of the centroids of the ribbon component of each synapse. The habenular-cuticular axis is made orthogonal to the best-fit line. The origin is placed at the median value for the set of 172 ribbon positions from this stack, as expressed along each of the new axes. These data are for the 11.3 kHz z-stack illustrated in A. C Data for all the z-stacks obtained from control ears in the 11.3 kHz region: each case has been normalized to the median y and z values, but the axes have not been transformed. Data are extracted from 2 stacks from each of 10 ears (from 10 animals), for a total of 3,411 synapses. D Same data as in C, but now the axes have been transformed for each case and then superimposed.
Spatial Gradients in Normal Synaptic Morphology in the IHC Area
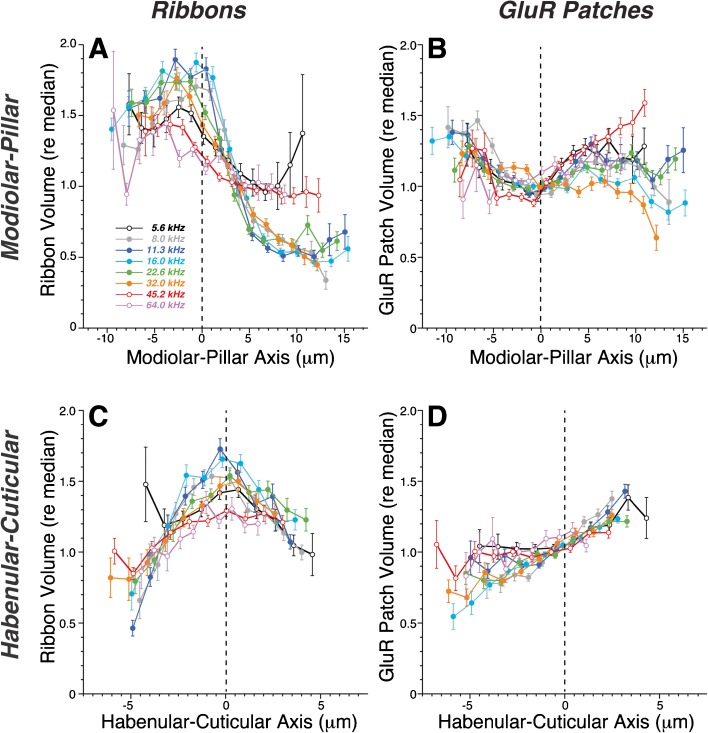
Quantitative analysis of the spatial gradients in synaptic morphology in Control cochleas bears out the qualitative impressions from images such as Figure 3A. Mean ribbon volume decreases abruptly as the synapse position moves past the origin on the modiolar-to-pillar axis (Fig. 4A), while mean GluR-patch size increases smoothly as the location of the synapse moves along the habenular-cuticular axis (Fig. 4D). These trends are present at all eight log-spaced cochlear frequency regions (key in Fig. 4A), spanning the entire cochlear spiral. The modiolar-pillar trends in GluR-patch volume (Fig. 4B) and the habenular-cuticular trends in ribbon size (Fig. 4C) are more complicated, with each showing non-monotonic behavior around an inflection point near the midpoint of each respective axis.
FIG. 4.
In control ears, strong spatial gradients are seen in the IHC synaptic zone in the volume of presynaptic ribbons (A, C) and the volume of the postsynaptic GluR patches (B, D) as a function of position along the transformed modiolar-pillar (A, B) or habenular-cuticular axes (C, D). Data from each of eight cochlear frequency regions (symbol key in A) are combined, aligned, and rotated as described in Fig. 3. For each frequency region, the range of values spanned along the transformed x-axis is divided into 20 bins, and the mean (±SEM) value of the dependent variable is computed for all the synapses in each bin (only bins with >10 points are shown). The dependent variable in each plot (ribbon volume or GluR-patch volume) is expressed as the size of the element re the median value in the same z-stack. See methods for further details. Data are from ten ears from ten animals. The total number of synapses analyzed in each cochlear region ranged from 1,384 (64-kHz region) to 3,876 (16-kHz region), for a total sample size of 22,399 synapses.
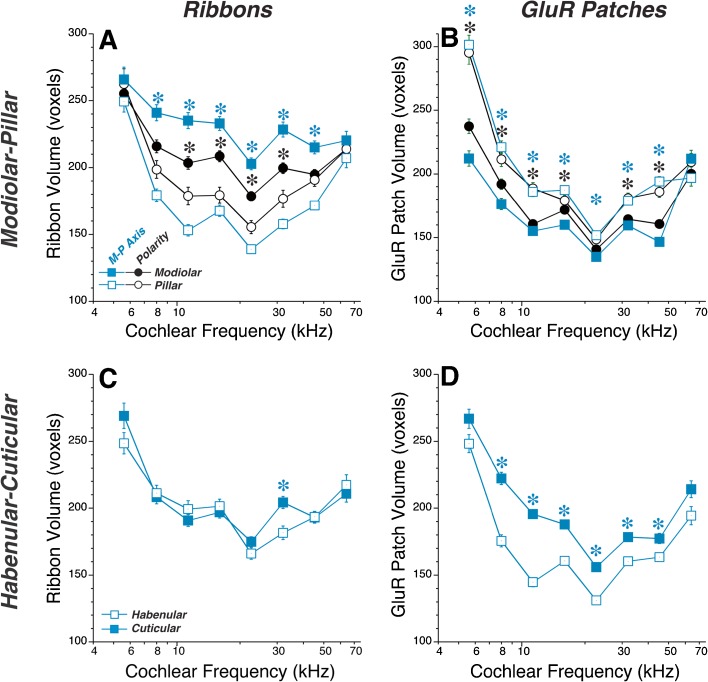
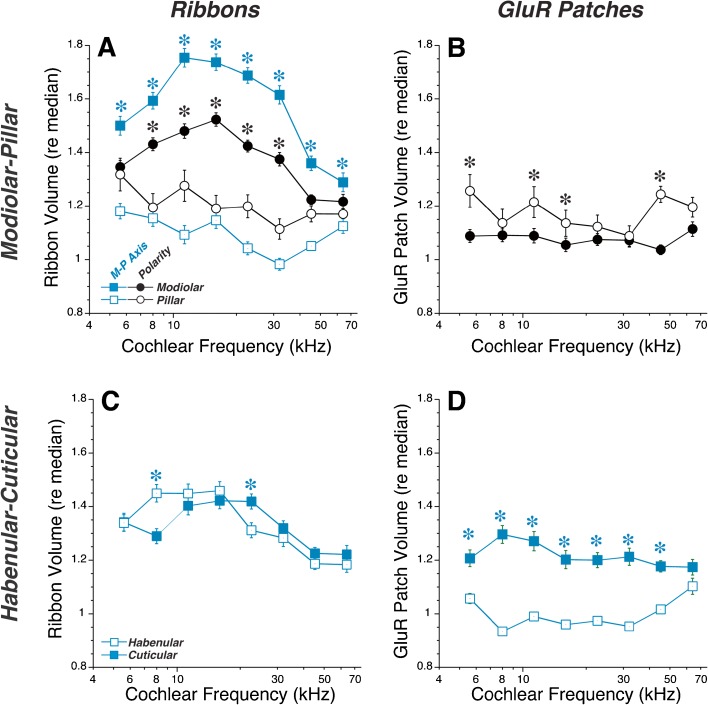
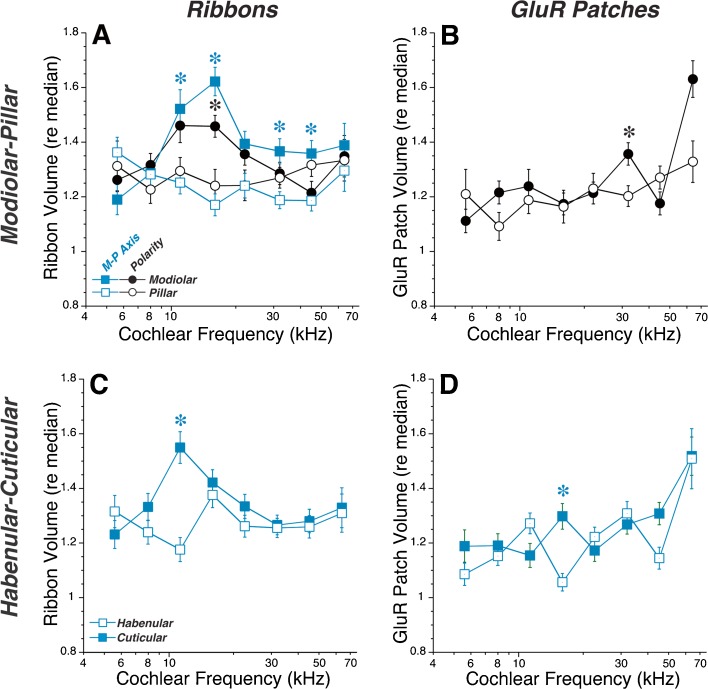
For the analysis in Figure 4, ribbon- and GluR-patch sizes were normalized to the median value in each z-stack. This normalization is useful to demonstrate the similarity of spatial gradients across the cochlear spiral, and is necessary when tissue was immunostained on different days and/or image stacks were acquired with different laser power and/or photomultiplier-tube gains (e.g., control data in Fig. 4). To assess synaptic gradients in absolute size, we generated an additional set of control ears, which were batch-processed to control staining intensity and batch-imaged with exactly the same confocal acquisition parameters. As shown in Figure 5, the sizes of both ribbons and GluR patches are at a maximum in the apex, and at a minimum in the upper basal turn (22-kHz region), a pattern roughly the inverse of the innervation density (synapses per IHC) as a function of cochlear position (Kujawa and Liberman 2009; Meyer et al. 2009). To assess the modiolar-pillar and habenular-cuticular gradients across frequency, we divided each axis at its origin and averaged the puncta volumes on either side. This computation revealed a robust modiolar > pillar difference in ribbon volume in all cochlear regions except the apical and basal extremes (Fig. 5A) and a complementary pillar > modiolar gradient in GluR patch volumes everywhere except the extreme base (Fig. 5B). A cuticular > habenular gradient for GluR patches is clear in all cochlear regions (Fig. 5D), but no systematic habenular-cuticular gradient appears in ribbon size (Fig. 5C). Similar spatial relationships are seen when the relative sizes of synaptic elements are analyzed in control ears with variable staining intensity (Fig. 6).
FIG. 5.
Control ears show complementary gradients in absolute ribbon size (A) and GluR-patch size (B) along the modiolar-pillar axis, while along the habenular-cuticular axis there is a gradient in GluR-patch size (D) but not ribbon size (C). The modiolar-pillar gradient is computed in two ways: (1) by defining all synapses with negative values on the transformed modiolar-pillar axis (Fig. 4) as “modiolar” and all positive values as “pillar” (blue symbols); or (2) by considering the “polarity” of each synapse, i.e., defining as “modiolar” those for which the modiolar-pillar axis value of the GluR patch is smaller than that of the associated ribbon, and vice versa (black symbols—see Fig. 1D). In C, D, “cuticular” versus “habenular” is defined as all synapses with positive versus negative values on the transformed habenular-cuticular axis, respectively (Fig. 4). Size is expressed in voxels (75 × 75 × 250 nm) from the confocal z-stacks: values are not corrected for the point-spread function of the confocal. Group means (±SEMs) are shown. This group is composed of 6 ears from 3 animals that were immunostained together and imaged with exactly the same confocal settings; the number of synapses analyzed ranged from 894 (5.6-kHz region) to 2,278 (16-kHz region), for a total sample size of 13,816. This group of controls is different from that analyzed in Figs. 4 and 6. Keys in A, C also apply to B, D, respectively. Asterisks indicate that group differences are significant at the P < 0.01 level by a two-tailed t test.
FIG. 6.
Complementary gradients are also seen in relative sizes of ribbon and GluR patches in control ears in which interspecimen differences in staining intensity required that sizes be normalized. The criteria for distinguishing modiolar versus pillar and habenular versus cuticular synapses are as described in Fig. 5. Techniques for normalizing ribbon and GluR-patch volumes are as described in Fig. 4, and the underlying database is the same as that used for Fig. 4. Group means (±SEMs) are shown in all panels. Keys in A, C also apply to B, D, respectively. Asterisks indicate that group differences are significant at the P < 0.01 level by a two-tailed t test.
Prior work considered synaptic position in reference to the IHCs themselves, rather than with respect to the global modiolar-pillar axis presented here. Because the basolateral poles of IHC are staggered (Fig. 2), synapses in the middle of the global modiolar-pillar axis include a mixture of pillar-side (#2 in Fig. 1D) and modiolar-side (#3 in Fig. 1D) synapses, when referenced to the IHC they contact. To clarify the position of each synapse re its target IHC, we analyzed the “polarity” of each pair of pre- and postsynaptic puncta. When viewed in the yz plane, synapses on the pillar side of an IHC have the presynaptic element closer to the modiolus than the postsynaptic element, and vice versa (see Fig. 1D). Using this simple algorithm to identify synapse locations re, the IHCs corroborates the presence of complementary gradients of ribbon and GluR-patch size (black symbols in Figs. 5 and 6) as first suggested in a prior confocal study (Liberman et al. 2011). When defined by synaptic polarity, modiolar synapses outnumbered pillar synapses by roughly 2:1 in most cochlear regions, as reported in a prior ultrastructural study (Liberman 1980a).
The ribbon-size spatial gradient is more robust when defined using the global modiolar-pillar axis than when using synapse polarity, i.e., position on the IHC (Figs. 5A and 6A). This suggests that, in addition to the differences in synaptic elements on the two sides of the IHCs, there is a different mix of synaptic morphologies on IHCs tilted towards the modiolus (synapses #1 and 2 in Fig. 1D) than on those tilted towards the pillars (synapses #3 and 4 in Fig. 1D).
Normal OC Innervation Gradients and Effects of De-efferentation on Synaptic Sizes
Qualitative analysis of the yz projections of synaptic clusters in the IHC area also suggested a relation between the size of synaptic puncta and the density of OC efferent innervation (Fig. 3A). Efferent density clearly varies with position along the habenular-cuticular axis, with a marked decrease in VAT-positive terminals near synapses closer to the IHC’s cuticular plate. Given the clear trends in GluR-patch size along the same axis (Fig. 4D), we wondered if the two were causally related.
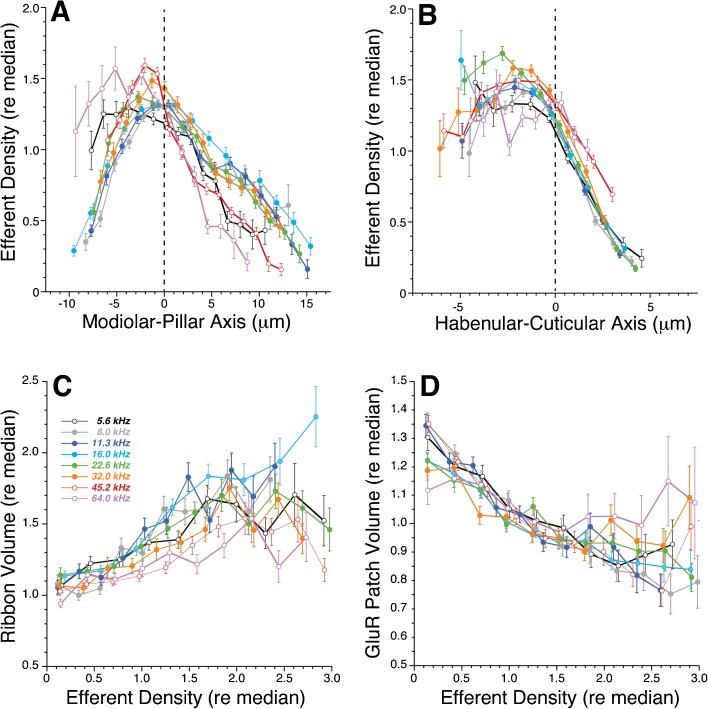
To quantitatively assess the density of efferent innervation, and its relation to the morphology of afferent synapses, we averaged the pixel intensity in the VAT channel within a 4-μm cube centered on each pair of pre- and postsynaptic puncta (Fig. 1B). The resultant quantitative analysis shows that efferent density peaks along the modiolar-pillar axis (Fig. 7A) at roughly the same position in the synaptic cluster as that where ribbon volume peaks (Fig. 4A). Along the habenular-cuticular axis (Fig. 7B), efferent density declines dramatically at roughly the midpoint of the synaptic cluster. As seen for the sizes of synaptic puncta, the spatial trends in efferent innervation density are remarkably consistent across the entire cochlear spiral.
FIG. 7.
The density of efferent innervation in Control ears varies along the modiolar-pillar (A) and habenular-cuticular (B) axes such that there are complementary gradients in ribbon- (C) and GluR-patch sizes (D) with increasing efferent density. The conventions for data analysis and display, and the underlying database, are the same as described for Fig. 4.
A direct comparison of synaptic morphology and local efferent density revealed complementary relations for ribbons versus GluR patches: as the efferent density increases, the presynaptic ribbons tend to get larger (Fig. 7C), while the postsynaptic GluR patches tend to get smaller (Fig. 7D), and the trends hold across all eight cochlear regions examined.
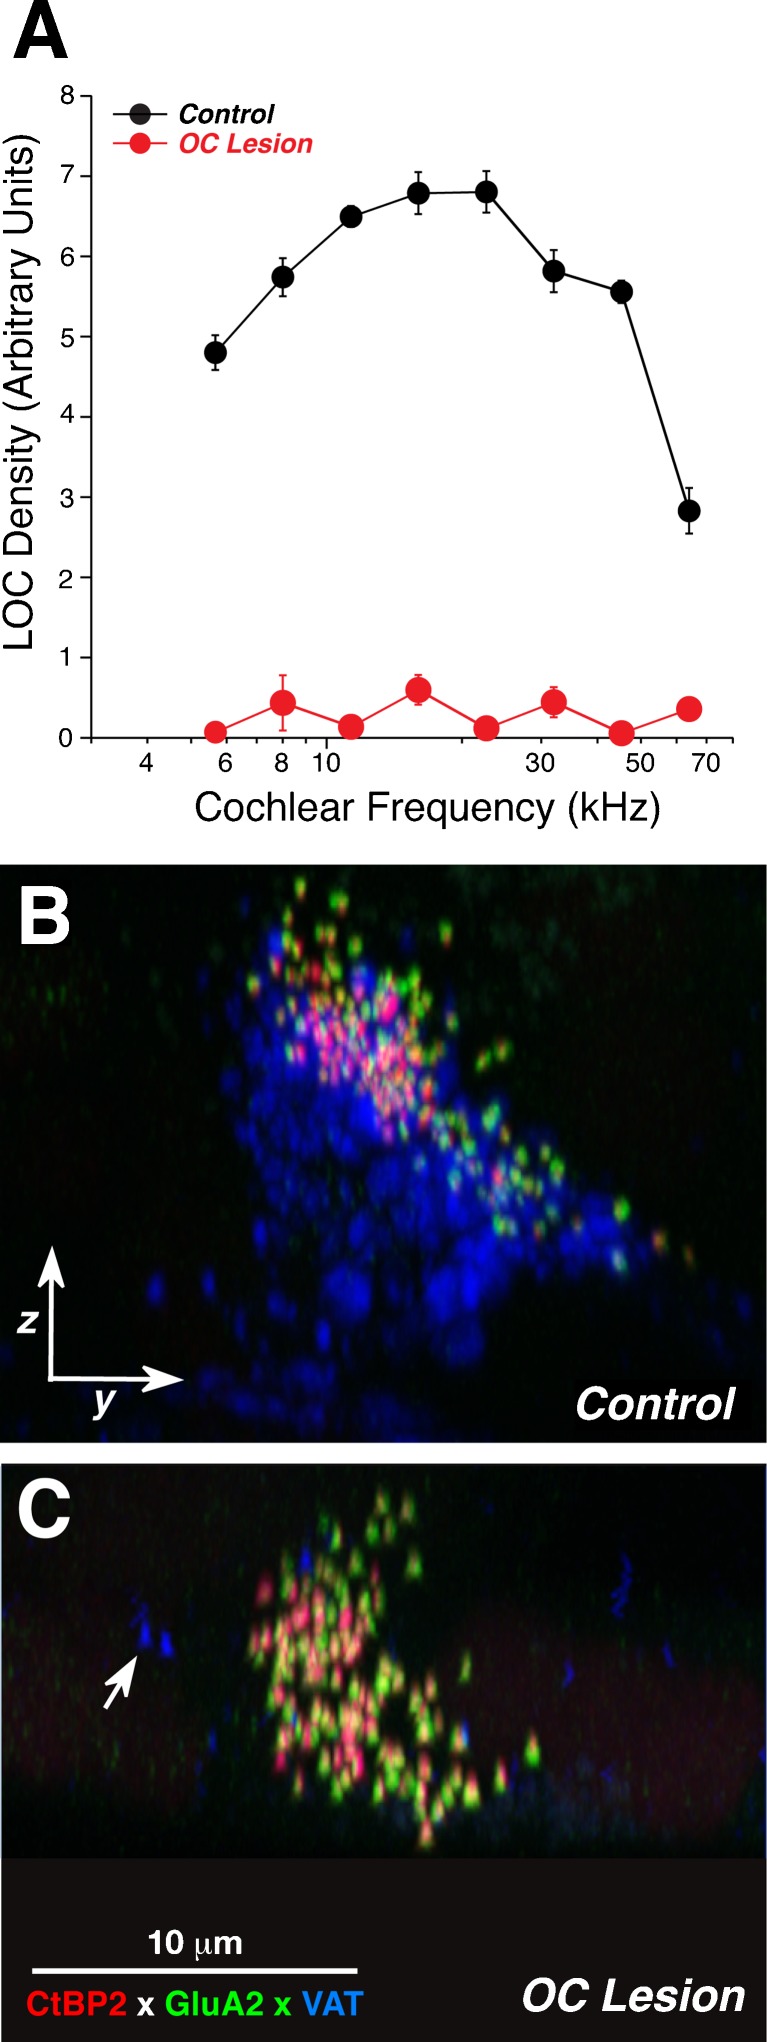
To test the hypothesis that the spatial gradients in synaptic morphology, and thus possibly the associated differences in SR and threshold, require interactions with OC efferent terminals in the IHC area, we surgically de-efferented mice, waited 3 weeks for the efferent terminals to degenerate, and then assessed the sizes of ribbons and GluR patches, as in the control ears. By placing stereotaxic knife cuts into the brainstem, we achieved an almost complete unilateral de-efferentation in five cases, as demonstrated by quantification of the VAT-positive puncta in the IHC area (Fig. 8). The quantification of afferent synaptic puncta revealed that the de-efferentation caused a collapse of both the modiolar-pillar and habenular-cuticular gradients in GluR patch size (compare Fig. 9B with Fig. 6B and compare Fig. 9D with Figs. 5D and 6D). The de-efferentation also caused partial collapse of the modiolar-pillar gradient in ribbon size: compare OC lesion data in Figure 9A, where modiolar ribbons were, on average, only 12 % bigger than pillar ribbons, to control data in Figure 6A, where the mean difference was 43 %.
FIG. 8.
Density of efferent innervation in the IHC area in control versus OC lesion groups. A Innervation density is extracted from confocal z-stacks like that in Fig. 1A, as further described in methods. Control data are from six ears from six animals. OC lesion data are for five ears from five animals. For each group, data are extracted from two adjacent z-stacks from each frequency region in each ear. Mean values (±SEM) are shown. B, C Illustrative confocal images from the 11.3-kHz region of a control (B) and an OC lesion (C) ear. Each image is the maximum projection of a z-stack, and each is oriented as shown in Fig. 1C, D. Arrow in C shows two of the scarce VAT-positive puncta remaining in this z-stack.
FIG. 9.
The spatial gradients in ribbon and GluR patch volumes tend to collapse after cochlear de-efferentation. The OC lesion group shown here is that same as that shown in Fig. 8: it is based on five ears from five animals, 3 weeks after OC lesion. The number of synapses analyzed ranged from 429 (64-kHz region) to 1,413 (16-kHz region), for a total sample size of 7,978. The criteria for distinguishing modiolar versus pillar and habenular versus cuticular synapses are as described in Fig. 5. Asterisks indicate that group differences are significant at the P < 0.01 level by a two-tailed t test.
DISCUSSION
Ribbon and GluR-Patch Size as Markers of SR Group
The dynamic range of the auditory periphery is enhanced by differences in threshold sensitivity among cochlear nerve fibers (Liberman 1978; Winter et al. 1990), and fibers with the lowest thresholds have the highest spontaneous rates (SRs). This correlation has been documented in cat (Liberman 1978), guinea pig (Winter et al. 1990; Tsuji and Liberman 1997), gerbil (Schmiedt 1989), rabbit (Borg et al. 1988), and mouse (Taberner and Liberman 2005), suggesting that an SR-based subdivision is a fundamental feature of the cochlear nerve.
Electron microscopy has shown that cochlear nerve terminals on the pillar side of the IHC tend to be larger and richer in mitochondria than those on the modiolar side (Liberman 1980a), suggesting a structural correlate for the differences in SR. Intracellular labeling in cat (Liberman 1982) and guinea pig (Tsuji and Liberman 1997) confirmed the basic spatial segregation around the IHC circumference: large terminals on the pillar side are high SR fibers, whereas low SR fibers are found on the modiolar side. However, both prior reports in cat (Liberman 1980a; Liberman et al. 1990) and the present study in mouse found roughly twice as many synapses on the modiolar face than on the pillar face. Since high-SR fibers outnumber low-SR by 60 versus 40 % (Liberman 1978), the spatial segregation of SR groups cannot be simply based on synapse location on pillar versus modiolar faces.
Intracellular labeling has also suggested a relation between SR and the size of the presynaptic ribbon: large ribbons were found at low SR synapses and small ribbons at high SR synapses (Merchan-Perez and Liberman 1996). In zebrafish lateral line hair cells, ribbon size is controlled by negative feedback from Ca++ entry through presynaptic, voltage-gated Ca++ channels (Sheets et al. 2012). If low SR synapses have fewer Ca++ channels, then presynaptic ribbons would be larger, if the same feedback system is present. Regardless of the underlying mechanism, a modiolar-pillar ribbon-size gradient is clear in confocal z-stacks from mouse cochleas immunostained for CtBP2 (e.g., Fig. 1C), a major component of the presynaptic ribbon (Schmitz et al. 2000). The same modiolar-pillar ribbon-size gradient is clear in confocal projections from guinea pig (Furman et al. 2013) and chinchilla cochleas (Liberman, unpublished). Although the actual size of an IHC ribbon, i.e., a tube ~100-nm wide and 400-nm long (Liberman 1980a; Liberman et al. 1990), is below the resolution of the light microscope, and thus greatly distorted by the point-spread function of the confocal imaging system, the relative ribbon sizes, as measured here, appear to reflect the underlying morphological differences observed by electron microscopy (Liberman et al. 1990).
With respect to GluR-patch size, the interpretation of the confocal gradients is not so straightforward. Ultrastructural data show that the area of the postsynaptic density does not differ on pillar versus modiolar terminals, at least in cat (Liberman 1980a; Merchan-Perez and Liberman 1996). The modiolar-pillar differences in GluR-patch size we observe in confocal images may actually reflect differences in density of receptor expression. The volume we compute for each synaptic element is based on counting the number of contiguous pixels exceeding an arbitrary pixel-intensity criterion. If two GluR patches have the same size, but a different receptor density, after the signal from each coupled fluorophore is convolved with the confocal’s point-spread function, and the composite image is segmented using a constant pixel intensity, the high-density patch will appear larger than the low-density patch. Thus, the “small,” i.e., low-density, GluR patches on the modiolar side of the IHC may contribute to the insensitivity of low SR fibers synapsing there.
In the present study, analysis of >36,000 synapses from 15 control ears confirms the modiolar > pillar ribbon-size gradient and the complementary pillar > modiolar GluR-patch size gradient reported in a prior study (Liberman et al. 2011). We also confirm that most of these gradients lose statistical significance in the apical and/or basal extremes of the cochlea (Figs. 5 and 6), which is interesting given that the correlations between SR and threshold also disappear at the highest and lowest frequencies (Liberman 1978). The attenuation of spatial gradients at the apical end of normal ears (Fig. 5A, D) also suggests that in vitro studies of synaptic physiology should avoid the apical 20 % of the cochlear spiral, i.e., frequencies <8.3 kHz (Taberner and Liberman 2005), if the data are to be representative of general cochlear function.
Modiolar-Pillar Gradients and Synaptic Differences Between Adjacent IHCs
Prior analyses of IHC afferent innervation assumed, for the sake of simplicity, that all IHCs are similar, i.e., that high-SR/low-SR ratios are similar on all cells from the same cochlear frequency region, and therefore that the only important morphological variable underlying cochlear nerve heterogeneity is the synapse position on the IHC. Such an assumption has never been directly demonstrated, and the present results suggest that it may not be true.
Prior studies noted the alternation of IHC position described here (Figs. 1D and 2). In the original ultrastructural study in cat, a difference in IHC “height” was noted (Liberman 1980a), but the serial sections were cut parallel to the basilar membrane and a difference in tilt (Fig. 1D) could be interpreted as an IHC height difference in the absence of a true 3D reconstruction. No clearcut differences were seen between “short” and “long” IHCs (Liberman 1980a), but the sample size included only two of each “type” of IHC. In prior confocal studies in mouse, the “problem” of alternating IHC synaptic poles (Fig. 3) was avoided either by cropping image stacks to include only well-aligned cells (Liberman et al. 2011), or by including an IHC cytoplasmic marker and painstakingly referring synapse position to a polar coordinate system centered on each IHC (Meyer et al. 2009).
Confocal projections such as that in Figure 1C inspired us, in the present study, to ask if ribbon and/or GluR-patch sizes differ not only according their position on an IHC, but also depending on the position of the IHC synaptic pole along a global modiolar-pillar axis. The fact that the gradient for ribbon-size (but not GluR-patch size) is more robust when defined based on the modiolar-pillar axis than when defined based on synaptic polarity (Figs. 5A and 6A) supports this idea. Furthermore, the observation that ribbon size peaks at the midpoint of the modiolar-pillar axis (Fig. 4A) suggests that, on average, the modiolar-side ribbons on IHCs closest to the pillars (e.g., synapse #3 in Fig. 1D) are larger than the modiolar-side ribbons on IHCs farthest from the pillars (e.g., synapse #1 in Fig. 1D).
Habenular-Cuticular Gradient and OC Modulation of Afferent Synaptic Components
Prior ultrastructural work noted that putative low SR terminals on the modiolar side of the IHC received more lateral (L)OC synapses than terminals on the pillar side (Liberman 1980b; Liberman et al. 1990). Since the ultrastructural data also showed that >75 % of these dendrodendritic contacts occurred within 4 μm of the afferent synapse (Liberman 1980b), and since the vast majority of LOC terminals are immunopositive for cholinergic immunomarkers (Maison et al. 2003), we defined a confocal estimate for the local density of LOC terminals as the average signal intensity in the VAT channel of our triple-stained images, within a 4-μm cube around each afferent synapse (Fig. 1B). Using that metric, we saw interesting spatial trends in LOC innervation density, i.e., (1) along the modiolar-pillar axis, efferent density (Fig. 7A) and synaptic-ribbon size (Fig. 4A) both peak near the midpoint (dashed lines); and (2) along the habenular-cuticular axis, efferent density decreases (Fig. 7B) as GluR-patch size increases (Fig. 4D). A direct comparison of efferent density and synaptic puncta size (Fig. 7C, D) suggested that low SR synapses (large ribbons and small GluR patches) receive more efferent innervation than high SR synapses (small ribbons and large GluR patches), as the earlier ultrastructural studies had suggested (Liberman 1980b).
The correlations between cochlear nerve synaptic morphology and efferent innervation density suggested a possible causal link. In a prior physiological study in cat, 1 year after nearly complete de-efferentation, the SRs of all cochlear nerve fibers appeared to be decreased to about 40 % of normal (Liberman 1990) compared to age-matched controls. In the present study, we revisited the question of an OC role in synaptic heterogeneity by evaluating the effect of de-efferentation on the spatial gradients in ribbon- and GluR-patch size. Only 3 weeks after de-efferentation, we saw a collapse of the habenular-cuticular gradient and the modiolar-pillar gradients in GluR-patch size (Fig. 9B, D) and an attenuation of the modiolar-pillar gradient in ribbon size (Fig. 9A), lending further credence to the idea that the OC system, specifically the dendrodendritic synapse of LOC terminals on cochlear nerve terminals, is a key factor in maintaining the heterogeneity in response properties of cochlear nerve fibers. It is natural to further hypothesize that, without the arrival of OC synapses during development, the cochlear nerve population would remain homogenous with respect to threshold and SR. This important question would best be addressed by creation of a mouse mutant with selective degeneration of LOC neurons, which should be achievable by linking expression of urocortin, one of several neuropeptide transmitters synthesized by LOC neurons (Vetter et al. 2002), to a cell-suicide expression system, of which several are now available (Fujioka et al. 2011).
Acknowledgments
Research supported by grants from the NIDCD: R01 DC 0188 and P30 DC 05209.
Conflict of Interest
The authors have no financial conflicts of interest to declare.
References
- Bohne BA, Kenworthy A, Carr CD. Density of myelinated nerve fibers in the chinchilla cochlea. J Acoust Soc Am. 1982;72:102–107. doi: 10.1121/1.387994. [DOI] [PubMed] [Google Scholar]
- Borg E, Engstrom B, Linde G, Marklund K. Eighth nerve fiber firing features in normal-hearing rabbits. Hear Res. 1988;36:191–201. doi: 10.1016/0378-5955(88)90061-5. [DOI] [PubMed] [Google Scholar]
- Fujioka M, Tokano H, Fujioka KS, Okano H, Edge AS. Generating mouse models of degenerative diseases using Cre/lox-mediated in vivo mosaic cell ablation. J Clin Investig. 2011;121:2462–2469. doi: 10.1172/JCI45081. [DOI] [PMC free article] [PubMed] [Google Scholar]
- Furman AC, Kujawa SG, Liberman MC. Noise-induced cochlear neuropathy is selective for fibers with low spontaneous rates. J Neurophysiol. 2013;110:577–586. doi: 10.1152/jn.00164.2013. [DOI] [PMC free article] [PubMed] [Google Scholar]
- Khimich D, Nouvian R, Pujol R, Tom Dieck S, Egner A, Gundelfinger ED, Moser T. Hair cell synaptic ribbons are essential for synchronous auditory signalling. Nature. 2005;434:889–894. doi: 10.1038/nature03418. [DOI] [PubMed] [Google Scholar]
- Kujawa SG, Liberman MC. Adding insult to injury: cochlear nerve degeneration after "temporary" noise-induced hearing loss. J Neurosci. 2009;29:14077–14085. doi: 10.1523/JNEUROSCI.2845-09.2009. [DOI] [PMC free article] [PubMed] [Google Scholar]
- Liberman MC. Auditory-nerve response from cats raised in a low-noise chamber. J Acoust Soc Am. 1978;63:442–455. doi: 10.1121/1.381736. [DOI] [PubMed] [Google Scholar]
- Liberman MC. Morphological differences among radial afferent fibers in the cat cochlea: an electron-microscopic study of serial sections. Hear Res. 1980;3:45–63. doi: 10.1016/0378-5955(80)90007-6. [DOI] [PubMed] [Google Scholar]
- Liberman MC. Efferent synapses in the inner hair cell area of the cat cochlea: an electron microscopic study of serial sections. Hear Res. 1980;3:189–204. doi: 10.1016/0378-5955(80)90046-5. [DOI] [PubMed] [Google Scholar]
- Liberman MC. Single-neuron labeling in the cat auditory nerve. Science. 1982;216:1239–1241. doi: 10.1126/science.7079757. [DOI] [PubMed] [Google Scholar]
- Liberman MC. Effects of chronic cochlear de-efferentation on auditory-nerve response. Hear Res. 1990;49:209–223. doi: 10.1016/0378-5955(90)90105-X. [DOI] [PubMed] [Google Scholar]
- Liberman MC, Dodds LW, Pierce S. Afferent and efferent innervation of the cat cochlea: quantitative analysis with light and electron microscopy. J Comp Neurol. 1990;301:443–460. doi: 10.1002/cne.903010309. [DOI] [PubMed] [Google Scholar]
- Liberman LD, Wang H, Liberman MC. Opposing gradients of ribbon size and AMPA receptor expression underlie sensitivity differences among cochlear-nerve/hair-cell synapses. J Neurosci Off J Soc Neurosci. 2011;31:801–808. doi: 10.1523/JNEUROSCI.3389-10.2011. [DOI] [PMC free article] [PubMed] [Google Scholar]
- Maison SF, Adams JC, Liberman MC. Olivocochlear innervation in the mouse: immunocytochemical maps, crossed versus uncrossed contributions, and transmitter colocalization. J Comp Neurol. 2003;455:406–416. doi: 10.1002/cne.10490. [DOI] [PMC free article] [PubMed] [Google Scholar]
- Matsubara A, Laake JH, Davanger S, Usami S, Ottersen OP. Organization of AMPA receptor subunits at a glutamate synapse: a quantitative immunogold analysis of hair cell synapses in the rat organ of Corti. J Neurosci Off J Soc Neurosci. 1996;16:4457–4467. doi: 10.1523/JNEUROSCI.16-14-04457.1996. [DOI] [PMC free article] [PubMed] [Google Scholar]
- Merchan-Perez A, Liberman MC. Ultrastructural differences among afferent synapses on cochlear hair cells: correlations with spontaneous discharge rate. J Comp Neurol. 1996;371:208–221. doi: 10.1002/(SICI)1096-9861(19960722)371:2<208::AID-CNE2>3.0.CO;2-6. [DOI] [PubMed] [Google Scholar]
- Meyer AC, Frank T, Khimich D, Hoch G, Riedel D, Chapochnikov NM, Yarin YM, Harke B, Hell SW, Egner A, Moser T. Tuning of synapse number, structure and function in the cochlea. Nat Neurosci. 2009;12:444–453. doi: 10.1038/nn.2293. [DOI] [PubMed] [Google Scholar]
- Muller M, von Hunerbein K, Hoidis S, Smolders JW. A physiological place-frequency map of the cochlea in the CBA/J mouse. Hear Res. 2005;202:63–73. doi: 10.1016/j.heares.2004.08.011. [DOI] [PubMed] [Google Scholar]
- Osen KK, Roth K (1969) Histochemical localization of cholinesterases in the cochlear nuclei of the cat, with notes on the origin of acetylcholinesterase positive afferents and the superior olive. Brain Res 16:165–185 [DOI] [PubMed]
- Pujol R, Marty R. Postnatal maturation in the cochlea of the cat. J Comp Neurol. 1970;139:115–118. doi: 10.1002/cne.901390108. [DOI] [PubMed] [Google Scholar]
- Sachs MB, Abbas PJ. Rate versus level functions for auditory-nerve fibers in cats: tone-burst stimuli. J Acous Soc Am. 1974;56:1835–1847. doi: 10.1121/1.1903521. [DOI] [PubMed] [Google Scholar]
- Schmiedt RA. Spontaneous rates, thresholds and tuning of auditory-nerve fibers in the gerbil: comparisons to cat data. Hear Res. 1989;42:23–36. doi: 10.1016/0378-5955(89)90115-9. [DOI] [PubMed] [Google Scholar]
- Schmitz F, Konigstorfer A, Sudhof TC. RIBEYE, a component of synaptic ribbons: a protein's journey through evolution provides insight into synaptic ribbon function. Neuron. 2000;28:857–872. doi: 10.1016/S0896-6273(00)00159-8. [DOI] [PubMed] [Google Scholar]
- Sergeyenko Y, Lall K, Liberman MC, Kujawa SG. Age-related cochlear synaptopathy: an early-onset contributor to auditory functional decline. J Neurosci Off J Soc Neurosci. 2013;33:13686–13694. doi: 10.1523/JNEUROSCI.1783-13.2013. [DOI] [PMC free article] [PubMed] [Google Scholar]
- Sheets L, Kindt KS, Nicolson T. Presynaptic CaV1.3 channels regulate synaptic ribbon size and are required for synaptic maintenance in sensory hair cells. J Neurosci. 2012;32:17273–17286. doi: 10.1523/JNEUROSCI.3005-12.2012. [DOI] [PMC free article] [PubMed] [Google Scholar]
- Stamataki S, Francis HW, Lehar M, May BJ, Ryugo DK. Synaptic alterations at inner hair cells precede spiral ganglion cell loss in aging C57BL/6J mice. Hear Res. 2006;221:104–118. doi: 10.1016/j.heares.2006.07.014. [DOI] [PubMed] [Google Scholar]
- Taberner AM, Liberman MC. Response properties of single auditory nerve fibers in the mouse. J Neurophysiol. 2005;93:557–569. doi: 10.1152/jn.00574.2004. [DOI] [PubMed] [Google Scholar]
- Tsuji J, Liberman MC. Intracellular labeling of auditory nerve fibers in guinea pig: central and peripheral projections. J Comp Neurol. 1997;381:188–202. doi: 10.1002/(SICI)1096-9861(19970505)381:2<188::AID-CNE6>3.0.CO;2-#. [DOI] [PubMed] [Google Scholar]
- Vetter DE, Li C, Zhao L, Contarino A, Liberman MC, Smith GW, Marchuk Y, Koob GF, Heinemann SF, Vale W, Lee KF. Urocortin-deficient mice show hearing impairment and increased anxiety-like behavior. Nat Genet. 2002;31:363–369. doi: 10.1038/ng914. [DOI] [PubMed] [Google Scholar]
- Walsh EJ, McGee J. Postnatal development of auditory nerve and cochlear nucleus neuronal responses in kittens. Hear Res. 1987;28:97–116. doi: 10.1016/0378-5955(87)90157-2. [DOI] [PubMed] [Google Scholar]
- Winter IM, Robertson D, Yates GK. Diversity of characteristic frequency rate-intensity functions in guinea pig auditory nerve fibres. Hear Res. 1990;45:191–202. doi: 10.1016/0378-5955(90)90120-E. [DOI] [PubMed] [Google Scholar]


