

Abstract
There is growing interest in understanding how emotion regulation affects adaptation. The present study examined expressive suppression (which involves inhibiting the overt expression of emotion) and how it affects one critical domain of adaptation, social functioning. This investigation focused on the transition to college, a time that presents a variety of emotional and social challenges. Analyses focused on two components of suppression: a stable component, representing individual differences expressed both before and after the transition; and a dynamic component, representing variance specific to the new college context. Both components of suppression predicted lower social support, less closeness to others, and lower social satisfaction. These findings were robustly corroborated across weekly experience reports, self-reports, and peer reports, and are consistent with a theoretical framework that defines emotion regulation as a dynamic process shaped by both stable person factors and environmental demands.
The hundreds of new faces that await freshmen as they begin their first year of college can be overwhelming. Without the comforts of home and the familiarity of high school, many students experience a mix of excitement and dread as they prepare to enter the unknown. During this emotionally intense and disorienting time, meeting new people, making new friends, and creating a new social support system are of paramount importance in having a successful first year in college (Christie & Dinham, 1991). What factors influence how students navigate the social challenges in this crucial transition?
Given the intense emotions that are part of this transition, one critical factor should be the way individuals regulate their emotions. Recent work has shown that one common way that individuals regulate emotions is through expressive suppression – that is, by attempting to inhibit their emotion-expressive behavior. Drawing from theory and research on emotions and their social functions, we hypothesized that expressive suppression should have substantial and important consequences for social functioning. The goal of the present research is to investigate those social consequences. The focal context of our study, the college transition, is one where we expected those consequences to be particularly pronounced and important.
Expressive Suppression: A Process Model and Individual Differences
According to contemporary theories of emotion, emotions begin with an evaluation of internal or external cues that have particular relevance to an individual. When attended to and evaluated in certain ways, these emotion cues give rise to a coordinated set of response tendencies that involve experiential, behavioral, and physiological systems (Mauss et al., 2005). The central construct in our investigation, expressive suppression, may be viewed through the lens of a process model of emotion regulation (Gross, 2001). Within this model, different forms of emotion regulation can be distinguished in terms of when they have their primary impact along the timeline of the unfolding emotional response. A broad distinction in the process model is between antecedent-focused and response-focused emotion regulation. Antecedent-focused regulation refers to things we do, either consciously or automatically, before emotion response tendencies have become fully activated. Response-focused regulation refers to things we do once an emotion is underway and response tendencies have already been generated.
One prominent form of response-focused emotion regulation is expressive suppression, which may be defined as a form of response modulation that involves inhibiting ongoing emotion-expressive behavior (Gross, 1998). For example, one might try to look composed while feeling devastated inside, or one might try to look calm while feeling angry or resentful. From a theoretical perspective, several things are noteworthy about suppression.1 First, it occurs relatively late in the emotion process, potentially after affective experience has already been generated. Second, it targets a component of emotion – expressive behavior – that is potentially visible to others and that serves a communicative function. Thus, the consequences of suppression may extend beyond internal experience and into the social world.
Laboratory manipulation of suppression
Experimental studies have demonstrated that people can successfully use suppression to reduce expressive behavior. In laboratory experiments, when participants have been instructed to use suppression to regulate emotion, they show decreased emotion-expressive behavior (e.g., Gross & Levenson, 1993, 1997). In addition to altering expressive behavior, suppression has some potential costs for affective experience. Several studies have found that suppression leaves intact the subjective experience of negative emotion but decreases the experience of positive emotions (Gross & Levenson, 1997; Stepper & Strack, 1993; Strack, Martin, & Stepper, 1988).
Individual differences in suppression
Research on individual differences in suppression has used the Emotion Regulation Questionnaire (ERQ; Gross & John, 2003). This scale includes items referring to suppression of both positive and negative emotions, as well as general-emotion items that do not reference valence; all of the items load on a common, general factor. Findings with the scale are consonant with the experimental research, and add further information about people who use suppression outside of the laboratory. Individuals who make frequent use of suppression deal with stressful situations by masking their inner feelings and clamping down on their outward displays of emotion. Their efforts at suppression leave them with less positive emotion and with more negative emotions, including feelings of inauthenticity, than individuals who use suppression less frequently. Such efforts are partially successful, in that individuals express less negative emotion than they actually experience; however, in absolute terms, they still express as much as individuals who suppress less frequently. Individual differences in suppression are distinct from other forms of emotion regulation and are not correlated with cognitive reappraisal, an antecedent-focused form of emotion regulation. In terms of the global Big Five traits (John & Srivastava, 1999), suppression is somewhat associated with low levels of extraversion but not at all with neuroticism or low agreeableness (Gross & John, 2003; John & Gross, 2007).
The Social Context of Suppression: New Research Questions
Suppression is a way of regulating emotions that targets expressive behavior – a component of emotion with a social-communicative function. An important topic for research, therefore, is how the use of suppression affects social functioning. In one of the few experimental studies of the interpersonal consequences of suppression, Butler and colleagues (2003) had unacquainted pairs of participants watch a Holocaust documentary together and then discuss their reactions. In some dyads, one partner was instructed (unbeknownst to the other) to suppress their emotional expressions during the discussion. Interacting with a partner who suppressed was more stressful than interacting with a partner who acted naturally, as indexed by increases in blood pressure. These findings suggest that by disrupting the give and take of emotional communication, suppression has the potential to undermine social functioning to a significant degree.
Although studies such as these are an important first step, they are limited in several ways: they involve an explicit and blunt experimental manipulation; they feature a single context in which emotionally expressive behavior was clearly normative and socially desirable; and they involve the random assignment of participants to a suppression group rather than naturally occurring within- or between-person variation in suppression. In the present study, we sought to overcome these limitations.
Stability and dynamics in suppression
Most prior research on emotion regulation has mirrored the “two disciplines” of correlational and experimental research identified by Cronbach (1957). Correlational designs typically compare stable attributes of individuals but do not emphasize how individuals adapt to their circumstances. Experimental designs focus on emotion regulation cued by an experimenter’s instructions, but they ignore both stable individual differences and spontaneously enacted emotion regulation. Cronbach argued that in order to understand all the forces that constitute the whole person, which he called “the organism at present,” one must consider both stable and dynamic influences. Individual differences and dynamic enactment of emotion regulation are part of the same larger picture (Bonanno, Papa, Lalande, Westphal, & Coifman, 2004; Carver & Scheier, 1998; Hoeksma, Oosterllan, & Schipper, 2004) but neither correlational nor experimental designs capture this totality very well. The present investigation was designed to incorporate stable and dynamic components of emotion regulation in a longitudinal design, allowing us to test simultaneously for both effects.
An ecologically meaningful context and outcomes
Does suppression have measurable and meaningful ramifications in important life contexts? Previous correlational studies have focused on global, decontextualized outcomes, whereas experimental studies have measured outcomes in controlled laboratory settings. In the present investigation, we studied an emotionally intense and personally meaningful time of life when emotion regulation resources are heavily demanded and have important consequences – namely, the transition to college.
The college transition is often a stressful and demanding period, during which many students confront new personal challenges and learn to cope with multiple demands (Cantor, Norem, Niedenthal, Langston, & Brower, 1987). Common sources of stress include changes in relations with friends and family members, new social activities, academic demands, financial responsibilities, and new temptations (Petruzzello & Motl, 2006). Social challenges are among the most prominent in this transition (Shaver, Furman, & Buhrmester, 1985), perhaps nearly twice as common as challenges in the academic domain (Arthur & Hiebert, 1996). The transition to college disrupts existing social support networks, separating individuals from high school friends and family and forcing them to form new relationships (Shaver et al., 1985). The largest impact of the transition to college is often experienced upon entry, during the first term, with reports of distress attenuating over time as students adjust to their new environment (Compas, Wagner, Slavin, & Vannatta, 1986; Gall, Evans, & Bellerose, 2000).
Multiple indicators of social functioning
Humans desire to maintain close and supportive relationships with others, and our psychological and physical well-being depends on how well we are able to do so (Baumeister & Leary, 1995). Functionalist theories of emotion indicate that emotionally expressive behavior is central to maintaining social bonds. Expressive behavior communicates information to others about an individual’s emotional state and associated needs and intentions. This communicative function of emotion is central to a number of adaptive interpersonal processes that rely on knowing others’ mental states (such as distress-sympathy cycles, social sharing, and mutual interest; Keltner & Haidt, 1999). Drawing from this functionalist perspective, we hypothesized that relatively greater use of suppression by individuals in their everyday lives will disrupt the normal flow of emotion-based communication and impede social functioning as a result.
Specifically, we examined three indicators of adaptive social functioning that we expected to be disrupted by suppression, as well as a fourth we did not expected to be disrupted. Social support is an important predictor of health and may be particularly critical during life transitions, such as the transition to college (Brissette, Scheier, & Carver, 2002). Individuals who suppress the expression of their emotions may fail to elicit social support (Eisenberg, Fabes, Schaller, & Miller, 1989; Labott, Martin, Eason, & Berkey, 1991). Closeness to others has important implications for general adaptation (for reviews, see Rholes & Simpson, 2004). Emotion-expressive behavior facilitates closeness by signaling approachability (Simpson, Gangestad, & Nations, 1996), the desire to affiliate (Harker & Keltner, 2001), the establishment of rapport (Tickle-Degnan & Rosenthal, 1990), and the willingness of the expresser to provide care and support (Lin, 1986). We thus expected that individuals who suppress will miss opportunities to establish close relationships with others. A subjective sense of social satisfaction is one of the dominant predictors of life satisfaction (Myers & Diener, 1995). We expected that individuals who suppress would have less satisfying social lives as a consequence. In contrast to these other outcomes, we did not expect that suppression would be strongly related to likability (Gross & John, 2003). Likability is an important dimension in sociometric research, where it serves as an indicator of how much others prefer to interact with an individual (Newcomb, Bukowski, & Pattee, 1993). Closeness and likability are distinct constructs: closeness often builds over time, but liking is a quick and automatic evaluation that can be made with no meaningful social interaction whatsoever (Albright, Kenny, & Malloy, 1988). Our hypotheses about suppression were based on its impact on interpersonal processes; since liking depends less on interpersonal interactions, we expected it to be less affected by suppression. Analyses of likability could thus help establish a boundary for the adverse social consequences of suppression. Because of concerns about the validity of self-reported likability, we only assessed it with peer reports.
The Present Study
The present study employed a prospective longitudinal design to test the real-life social consequences of suppression during the challenging transition to college (see Figure 1). We assessed suppression on two occasions: a pre-transition assessment during the summer while participants were still at home (approximately two months before the beginning of college), and an early-transition assessment on campus right at the beginning of the fall term. This enabled us to distinguish between two components of suppression: stable individual differences and dynamic changes across the transition to college. We measured social outcomes using a multi-method approach. First, we assessed on-going social experiences in weekly experience reports throughout the first term of college. Second, we assessed social functioning with global reports at the end of the term. Third, to gain a more objective assessment of individuals’ social functioning, we analyzed reports completed by knowledgeable peers at the end of the term.
Figure 1.
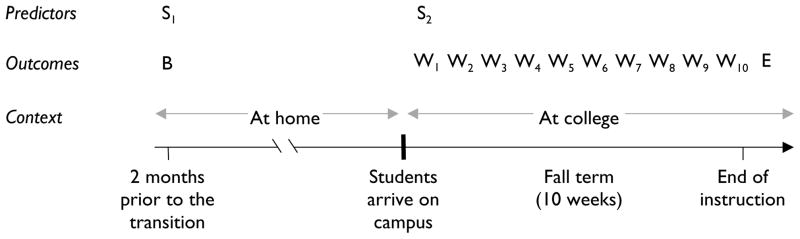
Study design timeline. Letters are positioned to indicate the timing of different assessments: S = suppression; B = baseline reports of social functioning; W = weekly experience reports of social functioning outcomes; E = end-of-term self and peer reports of social functioning outcomes.
We report the results in two parts. In Part 1, we report the mean-level changes in suppression across the transition. We then focus on the weekly experience reports, presenting descriptive analyses of the “typical” trajectory for a variety of social functioning indicators across the first ten weeks of college, as well as effects of suppression on these indicators. In Part 2, we focus on the end-of-term assessments, as reflected in self-reports and peer reports.
Part 1: Change in Suppression Across the Transition And Social Experiences During the First Term
In Part 1 we focus on the assessment of suppression before and after the transition to college and on the weekly experience reports during the first term. We address two questions. First, as individuals make the transition to a new college environment, in what ways – if any – do their levels of suppression change? Second, how do stable and dynamic components of suppression relate to social functioning during the first term at college?
Consistency and Change in Suppression
Individual differences in emotion regulation reflect well-established patterns of self-regulation (Gross & John, 2003; John & Gross, 2004). For this reason, we expected suppression to show moderate rank-order consistency even across a transition as significant as the one from high school to college. At the same time, we recognize that different situations call for different types and levels of emotion regulation. Individuals who suddenly find themselves in a new environment, surrounded by as-yet unfamiliar people, may well respond by being more guarded about expressing their emotions. Although previous research suggests that suppression generally decreases from early to middle adulthood (John & Gross, 2004), we expected mean levels of suppression to increase across the transition.
Prospective Analyses of Stable and Dynamic Suppression
We expected suppression to lead to adverse outcomes in three domains of social functioning: social support, closeness to others, and social satisfaction. For each outcome variable, we estimated three models that were constructed to narrow down the set of plausible explanatory models through carefully selected controls. Causation is established by satisfying three criteria: association between a proposed cause and effect, direction (i.e., the cause precedes the effect), and isolation from “third variables” (Bollen, 1989). Although this was not a randomized experiment and we could not control for all possible third variables, the models were designed to test for association and direction and to at least partially address isolation.
Model 1 tested for associations between the dependent variables and the stable and dynamic components of suppression, with no controls. In Model 2 we added variables representing baseline levels of the social functioning outcomes; these analyses help establish the direction of effects (i.e., from suppression to social functioning). Many of the outcome measures of social functioning referred specifically to the college context, and thus identical measures would not have made sense in the summer before college. However, wherever possible we employed conceptually relevant baseline variables as controls. In Model 3, we introduced social activity and positive and negative emotional experience into the models. Previous research has shown that individual differences in suppression are correlated with extraversion, so social activity (an index of extraversion expressed in the college environment) was included to isolate the effects of suppression from extraversion. Additionally, some previous experimental and correlational research has suggested that the use of suppression may lead to less positive or more negative emotional experience. In order to test whether the findings could be attributed centrally to suppression, and not just a side effect of its impact on emotional experience, we included positive and negative emotions in Model 3 as controls.
Our longitudinal design allowed us to address another important issue, unresolved in the previous experimental and correlational research: were the social outcomes of suppression merely transient, or did they persist throughout the first term? Our prediction for the stable suppression component was fairly straightforward: we expected it to consistently predict outcomes over time. The prediction for the dynamic component of suppression was less obvious, however: would it represent a brief disruption in social functioning, or would it set a longer-lasting precedent? Block (1982) proposed that an individual’s responses immediately after a major transition have an enduring impact: early responses set the tone for newly formed relationships and establish enduring patterns and precedents for social interactions. Thus, we tentatively hypothesized that the suppression effects would not diminish in magnitude throughout the term (i.e., the effects would persist and thus not interact with week).
Method
Participants
Data were available for 278 students (58% female; mean age = 18 years) who had completed a measure of suppression twice, once during the summer prior to their arrival on campus, and a second time within two weeks of the start of fall term. Participation in the summer survey was voluntary; subjects who completed further assessments were compensated for their time. The sample was ethnically diverse: 15% identified themselves as Hispanic, 31% as Asian, 7% as African-American, 60% as Caucasian, and 4% as Native-American (participants were allowed to mark more than one category). Various subsets of this sample participated in the two major parts of this longitudinal investigation, as described below.
Measures
To facilitate interpretation, scores of all other continuous measures were converted to Percent of Maximum Possible (POMP) scores (Cohen, Cohen, Aiken, & West, 1999). POMP scores are computed by a linear transformation that rescales a variable to have a theoretical range from 0 to 100. Transformations to POMP scoring put unstandardized statistics (like coefficients from regressions or multilevel models) into a more interpretable metric, since all measures have the same raw scale. POMP transformations do not affect inferential statistics like t or F tests. Means and standard deviations of the main variables are reported in Table 1.
Table 1.
Descriptive Statistics for Main Study Variables
| Variable | N | Mean | SD |
|---|---|---|---|
| Antecedent suppression (ERQ) | 278 | 35.73 | 17.24 |
| Summer before college | |||
| First 2 weeks of fall term | 278 | 40.30 | 19.73 |
| Weekly reports through first term | |||
| Support from parents | 233 | 59.21 | 26.67 |
| Support from new friends | 233 | 57.92 | 22.06 |
| Closeness | 233 | 66.36 | 17.17 |
| Social satisfaction | 233 | 60.76 | 17.40 |
| Academic satisfaction | 233 | 54.64 | 15.63 |
| End-of-term self-reports | |||
| Social support | 204 | 57.38 | 26.24 |
| Closeness | 204 | 66.75 | 28.36 |
| Social satisfaction | 204 | 63.43 | 23.26 |
| Academic satisfaction | 204 | 51.49 | 22.86 |
| End-of-term peer reports | |||
| Closeness | 143 | 74.57 | 17.89 |
| Social satisfaction | 143 | 68.82 | 16.67 |
| Academic satisfaction | 143 | 60.63 | 17.03 |
| Likability | 143 | 76.28 | 16.47 |
Note. ERQ = Emotion Regulation Questionnaire was completed during the summer before college and again during the first 2 weeks of the first college term. Standard deviations for weekly reports and peer reports are calculated to reflect between-subject variance.
Suppression
Suppression was measured using the suppression scale of the ERQ (Gross & John, 2003). The 4-item suppression scale was designed to be brief but has shown good reliability, consistent evidence of unifactorial structure, and convergent as well as discriminant validity, including substantial correlations with peer-reported suppression (Gross & John, 2003; John & Gross, 2004). The instructions made no reference to any time frame (i.e., participants were not constrained to interpret items as trait or state statements). Participants rated their agreement or disagreement with each item on a scale from 1 (strongly disagree) to 7 (strongly agree). The ERQ suppression items are: “I control my emotions by not expressing them,” “When I am feeling positive emotions (e.g., joy, amusement), I make sure not to express them,” “I keep my emotions to myself,” and “When I am feeling negative emotions (e.g., anxiety, sadness), I make sure not to express them.” In this sample, as in the previous studies, all four suppression items had substantial loadings (>.55) on a common factor, and this was true at both time-points.2 The first administration took place during the summer prior to participants’ freshman year of college; the second administration took place within the first two weeks of fall term (see Figure 1). Cronbach’s alpha reliability coefficients were similar to previous research, .71 in the pre-college assessment and .77 in the on-campus assessment.
Social support from parents and from friends
To assess how much social support participants received from others, participants rated social support on a scale from 1 (no support) to 7 (great support). Participants separately rated support from new college friends and from parents (or guardians). Averaged across weeks, support from these two sources correlated only .37, indicating that these two sources of support were distinct.
To control for baseline levels of support, we used the 12-item Interpersonal Support Evaluation List (ISEL; Cohen & Hoberman, 1983), which was administered in the summer assessment. This inventory measures the perceived availability of social support; it includes items like, “When I need suggestions on how to deal with a personal problem, I know someone I can turn to.” The scale had a mean of 77.7 (POMP scored) and an SD of 15.7, and it was internally consistent; alpha = .87. Its correlation with average weekly support from friends was r = .35, p < .05; with support from parents, r = .08, ns.
Closeness to others
Participants rated the closeness of their relationships from two perspectives, as agent and as recipient of closeness. One item asked about the degree to which participants felt “Affectionate, loving, caring/warm toward others” and the other item asked about the degree to which they felt “Cared about, loved, connected to others.” Ratings were made on a scale from 0 (not at all) to 4 (extremely). We combined these items into a closeness composite, alpha = .79.
To control for baseline levels of closeness, we used comparable items from the summer assessment. Participants were asked to rate the extent to which they typically experience affection and love on a scale from 1 (not at all) to 5 (extremely). These two ratings were POMP scored and combined to form a composite with a mean of 68.2, SD = 21.6, alpha = .68. The correlation with average weekly closeness was r = .39, p < .05.
Social and academic satisfaction
Social satisfaction was assessed with the item: “How satisfied did you feel with your social life?” Academic satisfaction was assessed using the item: “How satisfied did you feel with your academic life?” The items were rated from 1 (not at all) to 7 (extremely). Mean weekly ratings of academic and social support were correlated .41, indicating that subjects made meaningful distinctions between the two domains.
To control for baseline levels of social satisfaction, we used the item “I am satisfied with my social life,” which was administered in the summer assessment. Participants rated this item on a scale from 1 (strongly disagree) to 5 (strongly agree). The mean (after POMP transformation) was 61.4, SD = 30.2. The item correlated with average weekly social satisfaction r = .45, p < .05.
Additional control variables for Model 3
Social activity was assessed using the item, “Did you go to any parties or social events? If so, how many?” Each week, participants responded with one of four choices: 0, 1, 2, or 3+ (scored as 3). Positive and negative emotions experienced during the week were assessed with multi-item scales, with each emotion item rated on a scale from 0 (not at all) to 4 (extremely). The positive emotion scale consisted of 3 items: “Happy, pleased, contented,” “Proud, a sense of accomplishment, successful,” and “Interested, intellectually engaged/stimulated;” alpha = .61. The negative emotion scale consisted of 4 items: “Anxious, nervous,” “Sad, depressed, down,” “Tired, fatigued,” and “Angry, irritated, pissed off”; alpha = .68.
Participation and Attrition in the Weekly Experience Reports
Weekly assessments were available for 233 (84%) of the 278 students who had completed both emotion regulation measures. On average, they completed 6 of the weekly reports. We compared suppression scores in pre-college and initial on-campus assessments for the 233 who responded to at least one weekly assessment versus the 45 who did not and found no differences, all ps > .28. The number of responses per week ranged from 90 (the week that included Thanksgiving break when many students went home) to 183 (the last week of the term), and response rates did not systematically increase or decrease over the course of the term.
Analyses
Operationalizing stable and dynamic components of suppression
The cross-context design allowed us to model two components of suppression: a stable component representing variance shared between the pre-college and on-campus assessment, and a dynamic component representing variance unique to the on-campus arrival assessment. To estimate the effects of stable and dynamic components of emotion regulation, we entered baseline scores (assessed in the summer prior to the transition) and change scores (the difference of post-transition minus pre-transition) simultaneously.
This analysis is a hybrid of static-score and change-score models for panel data (Finkel, 1995). Its logic can be connected to Cronbach’s assertion about multiple influences on the “organism at present.” Suppression measured at a single occasion (SUPt) reflects two influences: variance shared across multiple time-points (STABLE) and variance that is specific to that time-point (DYNAMICt). Thus, two measurements reflect three sources of variance, STABLE, DYNAMIC1, and DYNAMIC2:
| (1) |
| (2) |
Because STABLE is the same at both time points, it is subtracted out in the change score:
| (3) |
| (4) |
| (5) |
This decomposition helps illustrate why entering baseline and difference scores allowed us to estimate stable and dynamic effects. In our analyses, we entered the baseline score (SUP1) and the difference score (ΔSUP) simultaneously into a regression equation as follows:
| (6) |
By substituting equations 1 and 4, this equation is the same as the following:
| (7) |
Because regression coefficients reflect the effect of each variable while holding the other constant, the variance that is shared across both terms in the regression – that is, DYNAMIC1, the variance specific to Time 1 – effectively “cancels out,” making b1 the estimate of the effect of STABLE on the dependent variable, and b2 the estimate of the effect of DYNAMIC2 on the dependent variable.
Multilevel regression models of weekly experience reports
The weekly experience reports formed a nested data structure, with up to 10 reports nested within each person. Therefore, we analyzed the weekly experience reports using multilevel regression analyses (also known as hierarchical linear models or linear mixed models) with maximum likelihood estimation. This approach allowed us to use all available data, even from participants who did not complete all 10 weekly reports. At Level 1 (within-person effects), the outcome measure was modeled as a function of an intercept and a linear slope of week. Week was centered in the middle of the fall term, so that the intercept would represent “average” social functioning during the fall term. The level-1 covariance structure included autoregressive effects – that is, error terms from adjacent weeks could be correlated with each other. In the level-2 equations (between-person effects), we entered baseline and change scores of suppression to estimate the effects of stable and dynamic suppression, as described above. Both level-2 random effects (for the intercept and the week slope) were estimated with an unrestricted covariance structure.
The tests of stable and dynamic suppression built on this basic model: Model 2 added level-2 effects of the baseline social functioning measures, and Model 3 further added effects of social activity, positive affect, and negative affect at level 1.
Results and Discussion
For descriptive purposes, means and standard deviations for core variables are presented in Table 1, and zero-order correlations among suppression and the outcome variables are presented in Table 2. We note two observations about these correlations. First, suppression measured at either of the antecedent time points was correlated with all of the subsequent social outcome variables, consistent with an effect of stable suppression. Second, for all but one expected outcome (support from parents; see also below), the correlation with the temporally closer fall assessment of suppression was stronger than the correlation with summer suppression, an observation that is consistent with an effect of dynamic suppression. More rigorous, model-based tests of these hypotheses are presented later in this section.
Table 2.
Zero-order Correlations Among Antecedent Suppression and Subsequent Weekly Experience
| Antecedent suppression (ERQ) | Weekly experience reports | |||||
|---|---|---|---|---|---|---|
|
|
||||||
| Variable | Summer before college | Early fall term | Support from parents | Support from friends | Closeness | Social satisfaction |
| Antecedent suppression (ERQ) | ||||||
| Summer before college | -- | |||||
| Early fall term | .63 | -- | ||||
| Weekly experience reports through first term | ||||||
| Support from parents | −.17 | −.07 | -- | |||
| Support from new friends | −.23 | −.33 | .39 | -- | ||
| Closeness | −.23 | −.46 | .25 | .60 | -- | |
| Social satisfaction | −.16 | −.39 | .17 | .51 | .69 | -- |
| Academic satisfaction | −.10 | −.19 | .21 | .29 | .29 | .29 |
Note. N = 123. ERQ = Emotion Regulation Questionnaire. To obtain reliable estimates, only subjects with greater than a 50% response rate on the weekly reports were used to calculate these correlations; cases with further missing data were deleted. In this subsample, absolute correlations greater than .18 are significant at p < 05. The primary analyses reported in the text used full-information methods on the fuller sample.
Consistency and Change in Suppression
Suppression showed moderate rank-order consistency between the home environment and college, r = .63 (p <.01). Although significant, this correlation is far from unity, leaving substantial room for individual-level changes across the initial transition period. Therefore, we expected to be able to distinguish both stable and dynamic components of suppression.
Did the participants, on average, increase in their use of suppression across the transition? A t-test indicated that mean levels of suppression increased significantly from the summer prior to college, M = 35.7, to the arrival on campus, M = 40.3; t(277) = 4.36, p < .01. In other words, as participants left their familiar social networks and began exploring a novel social environment in college, they increased the extent to which they regulated the overt behavioral expression of their emotions.
Suppression and Social Experiences During the First Term of College
Social support from parents
We begin with this social outcome variable because we predicted divergent effects for the stable and dynamic components of suppression, thus providing a direct and strong test of our operationalization of the stable-dynamic distinction. In the multilevel model, stable suppression significantly predicted lower levels of social support from parents (i.e., a lower level-1 intercept, centered in the middle of the term) during the first term in college, γ = −0.28, p < .05 (see first row in Figure 2). That is, new college students who were stable suppressors – whose high scores reflected consistently frequent use of suppression in both their home environment and their new college environment – elicited less subsequent support from their parents than did low scorers. All of the variables were POMP scored (that is, scaled from 0 to 100), so this coefficient indicated that an increase of 1 point of stable suppression corresponded to a reduction of just over one quarter of a point of parental support. We expected that this effect would not hold for the dynamic component of suppression, which reflects the student’s unique use of suppression in the new college environment. That was what we found: the dynamic suppression component was not related to parental support, a source of support that preexisted the new college environment: γ = −0.03, ns (Figure 2). This differential pattern of findings supports the validity of the stable-dynamic distinction and the interpretation of the dynamic component as variance that is time- and context-specific.
Figure 2.

Effects of antecedent stable and dynamic suppression on weekly experience report intercepts. Dependent variables are listed along the vertical axis. Dots represent the coefficient estimates and line segments represent 95% confidence intervals; coefficients whose intervals do not cross 0 are therefore significant at p < .05. Model 1 included the stable and dynamic suppression variables as well as the effect of week. Model 2 included all Model-1 effects plus a control for baseline social functioning. Model 3 included all Model-2 effects plus controls for social activity and positive and negative emotion. Graphing technique adapted from Kastellac and Leoni (2007). Numerical values available from the authors upon request.
Social support from new college friends
In contrast to parental support, both stable and dynamic suppression should predict less social support in the new relationships students form at college, and this was indeed the case. Figure 2 shows the regression coefficients for stable and dynamic suppression for the three models across the top row. In Model 1, both components of suppression had significant and negative associations with support from friends: γ = −0.32 for stable suppression and γ = −0.25 for dynamic suppression, both ps < .05. Because the effects of the stable and dynamic components were assessed simultaneously, this analysis indicates that each was a significant predictor independent of the other.
In Model 2, we added a control for baseline levels of social support prior to the transition. The effects of both stable and dynamic suppression remained significant and negative in Model 2; γ = −0.23 for stable suppression, and γ = −0.23 for dynamic suppression, both ps < .05. This finding was consistent with a directional interpretation that suppression was an antecedent of low social support (the baseline control was also significant in this analysis).
Finally, in Model 3 we added effects for social activity, positive emotions, and negative emotions. In this model, the effects of both suppression components remained significant: γ = −0.21 for stable suppression, and γ = −0.21 for dynamic suppression, both ps < .05. Thus, the effects of stable and dynamic suppression on social support from friends were independent from each other and could not be explained by differences in social activity or emotional experience.
In a final set of control analyses, we re-ran the analysis of emotional support from new friends controlling for support from parents. Again, the effects of both stable and dynamic suppression remained significant and largely unchanged in magnitude (see Figure 2). Like Model 2 (which controlled for pre-transition social support), this test further indicated that the findings for support from friends are specific to the emerging social network at college and cannot be attributed to global support patterns already in place prior to the arrival on campus.
Closeness to others
As shown in Figure 2, both the stable and the dynamic components of suppression were associated with less closeness to others over the entire first academic term. This was true even when controlling for baseline closeness, social activity, and positive and negative affect in Model 3, none of which confounded or mediated the effects of stable and dynamic suppression. The findings were consistent with previous experimental and correlational findings. Expanding on prior studies, the present findings demonstrate that both stable and dynamic suppression exert similar and independent influences on relationship closeness even when measured over an extended period of time.
Social and academic satisfaction
As shown in Figure 2, both stable and dynamic suppression predicted lower social satisfaction at college, even when controlling for baseline levels of social satisfaction, social activity, and positive and negative emotions (i.e., in Model 3).
Suppression has been associated with lower life satisfaction in general (see Gross & John, 2003). Indeed, in this investigation, the stable component of suppression was associated with lower academic satisfaction. To test the specificity of the social satisfaction findings, we conducted analyses of social satisfaction with academic satisfaction entered as a Level-1 control variable. The results, summarized in Figure 2, were clear: Both effects of suppression on social satisfaction remained significant and consistent in magnitude even after controlling for academic satisfaction, indicating that the effects were not merely a reflection of lower global satisfaction.
Transience or persistence of outcomes: Interactions with week in college
We expected the effects of stable suppression to be evident throughout the term; we tentatively hypothesized that dynamic suppression might show a similar pattern (as opposed to predicting only a transient disruption in social functioning at the start of the term). To examine these possibilities, we tested whether the effects of stable and dynamic suppression in the above analyses interacted with week. If the effects of suppression were transient, we would expect a suppression-by-week interaction such that high vs. low suppressors score quite differently on social functioning indices in early weeks but score similarly to one other in later weeks. However, none of the interactions were significant: the statistical effects of suppression on social functioning were of similar magnitude throughout academic term.
Part 2: Social Functioning at the End of Term As Assessed By Self- and Peer Reports
The experience-sampling approach employed in Part 1 asked participants to report their on-going experiences soon after they occurred. In Part 2, we expanded our approach in three ways. First, we asked participants at the end of their first term to provide global summary reports of their lives since beginning college. Such reports reflect the participants’ life assessments and evaluations integrated over time and they can therefore have important implications not captured by online reports, making them an important and complementary source of information (Wirtz, Kruger, Scollon, & Diener, 2003). Second, we supplemented self-reports with the reports of peers who knew the participants well. Self-reports provide a direct window into individuals’ perceptions of their social world. Well-acquainted peers who have observed the individual in a wide range of social settings provide an important additional perspective on the individual’s social adjustment. Self- and peer-reports each provide valid but complementary information (Vazire & Mehl, in press). Third, the collection of peer reports allowed us to assess another domain of social functioning, likability, which is difficult to assess with self-reports.
Given that Part 1 showed suppression to be associated with less social support, less closeness to others, and lower social satisfaction, we expected to reproduce those patterns using summary reports at the end of the term. We expected such patterns to be evident in both self- and peer reports. In addition, we examined likability, as rated by peers. Whereas social support, closeness to others, and social satisfaction reflect direct relationship outcomes, the extent to which a person is liked by others reflects the individual’s effect on others. Individuals can elicit positive reactions from others without necessarily forming close interpersonal bonds. Prior research suggests that suppression is not related to evaluative impressions (Gross & John, 2003), and although we expected suppression to impair relationship outcomes, we did not necessarily expect suppressors to be disliked by others.
Method
Participants and Attrition in the End-Quarter Assessments
The 278 participants from Part 1 were invited to complete an end-quarter assessment. Because we anticipated competing time demands on participants from final exams and other obligations, we designed a very brief assessment with the goal of achieving a respectable response rate. 204 (73%) of the original Part 1 participants agreed to participate and completed the self-report section of the end-quarter assessment. To examine attrition effects, we compared these end-quarter participants with the non-participants on suppression at each of the two earlier assessments and found no differences; the correlations with participation (vs. nonparticipation) were both below |.05| and neither was even close to significance, ps > .23.
In order to gain additional insight and corroboration of social consequences, the participants who completed the end-of-term self-reports also nominated up to three people who knew them well and provided names and addresses where we could contact these peers. We then mailed paper questionnaires with a postage-paid return envelope to the peers. Peer nominations could be solicited only from the participants who agreed to participate in the end-quarter self-report assessment; at least one peer report was obtained for 143 of those participants (70%).
Measures
Means and standard deviations of core variables are reported in Table 1.
Social support
Participants rated how often they went to others to talk about personal problems, and how often friends came to them to talk about personal problems. We focused on self-reports here because perceived support differs from actual support received. The former is generally more strongly related to positive outcomes (Wethington & Kessler, 1986), perhaps because received support confounds the availability of a support network with the adverse events that require its use. Ratings ranged from 1 (never) to 4 (often). We collapsed these items into a single composite measure of (mutual) social support, alpha = .73.
Closeness to others
Participants and their peers rated their agreement with the statement, “I had close relationships with others” (self) or “X has close relationships with others” (peer). Ratings ranged from 1 (disagree) to 7 (agree).
Two aspects of life satisfaction in college: Social and academic
Participants and peers rated “How satisfied were you with social life at college?” (self-report) or “How satisfied does X seem with his/her social life at college?” (peer report). Participants and peers also rated academic satisfaction: “How satisfied were you with your own academic performance at college? (self) or “How satisfied does X seem with his/her academic performance?” (peer). As in the weekly reports, social and academic satisfaction were moderately correlated: in self-reports, r = .22, p < .001; in peer reports, r = .38, p < .001.
Likability
Peers rated the extent to which they agreed with two statements concerning the target: “X is the kind of person almost everyone likes” and “X is someone people really enjoy spending time with.” These items required peers to evaluate the participants’ social interactions more broadly, rather than reporting solely on their own relationship with the participant. Both items were rated from 1 (strongly disagree) to 7 (strongly agree). We averaged the two items to create a single index of likability, alpha = .78.
Other controls
We used the same control variables as in Part 1. The weekly reports of social activity, positive emotion, and negative emotion we had obtained earlier were each averaged over the 10 weeks to create overall person-level variables for these analyses.
Analyses
When self and peer reports were available for the same constructs, we treated the data as having a nested structure (one to four reports nested within each participant). Therefore, when peer reports were available, we ran multilevel models with multiple reports (self plus 0 to 3 peers) nested within each subject and with the stable and dynamic suppression terms as Level-2 predictors. We entered a contrast code for source (self vs. peer) as a Level-1 predictor to control for main effects of data source, and we included terms for cross-level interactions between source and the suppression variables to test whether the observed effects were significantly different for the two data sources. Such combined analyses benefit from aggregation, but are only appropriate if there is measurement equivalence across data sources (i.e., self-reports must be psychometrically comparable to peer reports). With single items, measurement equivalence cannot be tested and must be assumed. Therefore, we also report separate analyses using regressions for the self-reports and multi-level models for the peer reports. As in the previous section, all analyses included the stable and dynamic terms entered simultaneously to test for their independent contribution in predicting the outcomes.
Results and Discussion
Zero-order correlations among suppression and the self and peer outcome variables are reported in Table 3. We again note that suppression from both timepoints was correlated with outcome variables, consistent with a stable suppression effect; and that correlations of outcomes with fall suppression were stronger than correlations with summer suppression, consistent with a dynamic suppression effect. More rigorous tests of these hypotheses follow in this section.
Table 3.
Zero-order Correlations Among Suppression and the End-of-term Self and Peer Reports
| Antecedent suppression (ERQ) |
End-of-term self-reports | End-of-term peer reports | |||||||
|---|---|---|---|---|---|---|---|---|---|
|
|
|||||||||
| Variable | Summer before college |
Early fall term |
Social support |
Closeness | Social satisfaction |
Academic satisfaction |
Closeness | Social satisfaction |
Academic satisfaction |
| Antecedent suppression (ERQ) | |||||||||
| Summer before college | -- | ||||||||
| Early fall term | .57 | -- | |||||||
| End-of-term self-reports | |||||||||
| Social support | −.10 | −.21 | -- | ||||||
| Closeness | −.17 | −.32 | .44 | -- | |||||
| Social satisfaction | −.13 | −.22 | .30 | .56 | -- | ||||
| Academic satisfaction | −.06 | −.20 | −.04 | .16 | .13 | -- | |||
| End-of-term peer reports | |||||||||
| Closeness | −.21 | −.29 | .36 | .36 | .24 | .08 | -- | ||
| Social satisfaction | −.17 | −.24 | .04 | .36 | .41 | .12 | .48 | -- | |
| Academic satisfaction | −.05 | −.17 | −.05 | .13 | .10 | .54 | .11 | .33 | -- |
| Likability | −.06 | −.06 | .25 | .29 | .19 | −.10 | .64 | .42 | .00 |
Note. N = 112. ERQ = Emotion Regulation Questionnaire. To obtain reliable estimates, only subjects with at least 2 peer respondents were used to calculate these correlations; cases with further missing data were deleted. In this subsample, absolute correlations greater than .19 are significant at p < 05. The primary analyses reported in the text used full-information methods on the fuller sample.
Social Support
As shown in the top row of Figure 3, both stable suppression and dynamic suppression were significantly associated with lower levels of self-reported social support in Model 1; γs = −0.35 and −0.33, respectively. The effect of stable suppression was reduced after a control for baseline social support was introduced in Model 2 (stable suppression γ = −0.21, p = .07). After controls for social activity and positive and negative emotions were introduced in Model 3, the effect of stable suppression was not significant (though the coefficient remained negative). However, the effect of dynamic suppression was significant even in Model 3 with all controls.
Figure 3.

Effects of antecedent stable and dynamic suppression on end-of-term self- and peer-reports. Dependent variables and data sources are listed along the vertical axis. Dots represent the coefficient estimates and line segments represent 95% confidence intervals; coefficients whose intervals do not cross 0 are therefore significant at p < .05. Model 1 included the stable and dynamic suppression variables. Model 2 included all Model-1 effects plus a control for baseline social functioning. Model 3 included all Model-2 effects plus controls for social activity and positive and negative emotion. Graphing technique adapted from Kastellac and Leoni (2007). Numerical values available from the authors upon request.
Closeness to Others
Consistent with the findings in Part 1, both stable suppression and dynamic suppression had a negative impact on close relationships at the end of the term. These effects remained significant in Model 3 with all controls introduced (see second row of Figure 3). There was a significant interaction with data source, indicating that the effects of suppression were somewhat stronger in self-, as compared with peer-reports. When we examined the effects for each data source separately, stable and dynamic suppression had negative consequences for close relationships in both self- and peer-reports. Stable and dynamic suppression were both significantly related to self-reported closeness even in Model 3. Dynamic suppression was marginally related to peer-rated closeness after controls were introduced (p=.09 in Model 3).
Social Satisfaction
Consistent with the findings in Part 1, both stable and dynamic suppression predicted lower social satisfaction at the end of the term. In the combined analysis, stable and dynamic suppression both had significant effects in Model 3 with all controls. Data source did not interact with these effects, suggesting that overall the effects for self-reports and peer reports were similar in magnitude. Indeed, when examining data sources separately, the same basic pattern emerged in both self-reported and peer-reported social satisfaction, although some effects were no longer significant in these lower-power analyses. When we included self-reported academic satisfaction at the end of the term as an additional control, the effects of both stable and dynamic suppression on self-reported social satisfaction remained virtually unchanged.
Likability
In prior research, suppression was not related to peer-rated likability (Gross & John, 2003). Similarly, in the present study, neither the stable nor the dynamic components of suppression were related to peer-rated likability at the end of the first academic term. In other words, although selves and peers both indicated that suppressors had less social support and were less satisfied with their social lives, suppressors were not necessarily disliked by others. Indeed, likability may engage an overall evaluation of the person as a social stimulus, rather than a specific judgment of the person as an interaction partner. Suppression, in this respect, may influence outcomes involving interpersonal relationships, but may be less directly relevant to the overall impression an individual makes on others.
General Discussion
In this longitudinal investigation, suppression was predictive of multiple adverse social outcomes following the transition to college. These findings held across three different domains of social functioning (social support, closeness to others, and social satisfaction) and three different assessment methods (weekly diaries, end-of-term self-reports, and peer reports). Importantly, these effects were of similar direction and magnitude both for stable individual differences in suppression and for recent, dynamically invoked changes in suppression.
Suppression: A Socially Important Emotion Regulation Process
Suppression predicted several different indicators of social functioning: social support, closeness and social satisfaction. Although this was not a randomized experiment, control analyses supported a directional interpretation as well as isolation from several plausible confounding variables, consistent with the conclusion that suppression is an antecedent of poor social functioning in these domains. Poorer social functioning was observed in self-reports and peer reports 10 weeks after the transition to college, suggesting that these outcomes may be relatively enduring. Consistent with previous research (Gross & John, 2003) suppression was not associated with likability: although suppressors miss opportunities to form close and meaningful relationships, they do not evoke negative evaluations from others. The findings were corroborated by peers, indicating that suppression alters behavior in ways that are observable by others. In other words, suppression extends beyond the individual into the social field.
Why was suppression associated with these adverse outcomes? At the outset, we started with the general proposition that because suppression targets a social-communicative channel of emotion, its consequences ought to be prominent in the social domain. Our measure reflected suppression of emotions in general, rather than suppression of just positive or just negative emotions. Different emotions can serve different social functions, but emotions also have shared social functions, such as calling attention to what is personally important and meaningful, communicating internal states, etc. (Keltner & Haidt, 1999). Because the findings reported here depend on a general suppression factor, they are probably based on such shared mechanisms.
The present results are consistent with the proposition that suppression has meaningful, diverse, and persistent social consequences in an important real-world context. Drawing on these results, we offer three possible mechanisms by which suppression may disrupt social functioning. First, to the extent that suppression is successful, it will dissociate an individual’s internal emotional experience from the information available to that individual’s social partners. A number of important social processes rely on others knowing about an individual’s internal emotional states: for example, displays of distress elicit sympathy from others (Eisenberg et al., 1989; Labott et al., 1991), and shared positive and negative experiences can facilitate social bonding (Collins & Miller, 1994; Kowalski, 1996). A second possibility, consistent with the concept of emotional “leakage” (Ekman & Friesen, 1969), is that individuals who attempt to suppress their expressive behavior are only partially successful. If social partners correctly infer that an individual is suppressing, they may perceive a suppressor as being uninterested in intimacy or even inauthentic in a social interaction. A third possibility involves the cognitive consequences of suppression. Experimental studies have shown that suppression imposes a cognitive load (Richards, Butler, & Gross, 2003; Richards & Gross, 2000). To the extent that certain relationship processes demand cognitive resources like attention (Tickle-Degnan & Rosenthal, 1990), individuals who are preoccupied with regulating their emotions might have difficulty fully engaging and responding to others in social interactions. The findings from this study encourage the future exploration of these possible mechanisms through designs that allow for more micro-analysis of behavior, such as lab studies of interactions or experience sampling.
Stable and Dynamic Suppression: Implications for Understanding Regulatory Processes
In this study, suppression reflected both stable personal factors and dynamic responses to the current situational context. These findings suggest that neither a trait like nor a situationist conception of suppression is sufficient on its own. As a practical matter for researchers, the fact that we were able to meaningfully divide variance in a questionnaire measure into stable and dynamic components echoes warnings against too easily categorizing measures and constructs as exclusively trait or state (Allen & Potkay, 1981; Fleeson, 2004). When a researcher assesses emotion regulation at a single point in time, it is likely that the observation reflects both stable and dynamic factors, and this consideration must factor into both research design and theorizing.
We have used the “dynamic” label in the accurate but somewhat narrow sense of something characterized by change. Yet it is suggestive of a broader set of ideas about regulatory processes, and in particular dynamic systems, that can guide our interpretation of the findings and provide additional theoretical context for the findings of this study (Carver & Scheier, 1998). Theoretically, we see emotion regulation as interacting dynamically with the environment as the individual anticipates and responds to events (cf. Hoeksma, Oosterllan, & Schipper, 2004). Temperament and early learning form the basis of stable tendencies, but not in a reflexive or deterministic way; responses to a given situation will depend on the individual’s perception and interpretation of the social context and the demands that it brings.
The average long-term trend in adulthood is for suppression to decrease (John & Gross, 2004); by contrast, we found that mean levels of suppression increased across the transition. This likely reflects the challenges of being in a new place, separated from loved ones and surrounded by strangers. Variance in the dynamic component of suppression may reflect differences how the transition was construed – as a traumatic separation by some, as an exciting social opportunity by others. Because emotion regulation processes can be primed by subtle associations and cues (Mauss, Cook, & Gross, 2007), such differences might be explained by individuals’ encoding systems that respond differently to different contexts (Cervone, 1997; Fleeson, 2004; Funder, 2006; Mischel & Shoda, 1998). An important topic for future studies will be to further examine factors that lead to changes in suppression, both features of the environment that may affect all individuals similarly and construal processes that may vary from one individual to the next.
Did changes in suppression occasioned by the transition to college endure? Although we did not re-assess suppression at the end of the fall term, indirect evidence suggests that changes in suppression may have endured. Both the stable and dynamic components of suppression had effects on social functioning that were evident throughout the 10-week term and at the end-of-term assessment, a pattern that suggests that dynamic changes in suppression endured after the transition. When people go through major transitions, they restructure their environments through selective and evocative transactions which, in turn, reinforce the individual differences that guided the restructuring (Block, 1982; Caspi & Moffitt, 1993). This echoes a broader theme in dynamic systems, that disruptions can shift a system to a new, enduring state (Carver & Scheier, 1998). An individual who responds to the college transition by becoming emotionally guarded in the first few days at college will miss opportunities to make close friendships; conversely, having fewer close friendships might afford fewer opportunities to share feelings, which could create an environmental feedback loop that serves to solidify and maintain the individual’s initial tendency to suppress. In future studies, this mutually reinforcing effect on suppression in social environments could be more directly examined by tracking both suppression and indicators of social functioning across many points in time.
Limitations and Future Directions
The present study represents our effort to integrate stable and dynamic effects in the context of a major real-world life transition, and with a temporal scope covering several months. This design had a number of advantages; but like any approach it had limitations as well.
One limitation was the temporal resolution and scope of the design, especially with respect to suppression dynamics. Dynamics can occur on many different timescales, often requiring different designs to optimally study them. By analogy, a geologist interested in the earth’s movement might take measurements on the order of milliseconds (using a seismograph) to study earthquakes, and on the order of centuries (using the fossil record) to study continental drift. In this study, suppression was measured two months apart in order to capture change associated with a major life transition. However, it is important to recognize that the underlying mechanisms and consequences might have been different had we focused on a scope of years (to investigate long-term development), hours (to study mood-related fluctuations), or milliseconds (to study immediate responses to specific stimuli). Major life transitions are a worthy focus, but not the only worthy focus. Relatedly, we note that our interest in a major life transition led us to create a before-and-after design with two measurements of suppression. A design with more measurement occasions would have allowed for more complex data-analytic approaches like trait-state models or difference models, which would have enabled us to test whether the stable and dynamic components of suppression are correlated or interact with each other; or growth mixture models, which would have allowed is to search for subgroups of growth patterns (such as stable-high suppressors, increasers, decreasers, and the like).
Another limitation is that we focused on just one kind of transition (to college) at just one university. The ways that we believe suppression alters interpersonal interactions are quite general; however, we acknowledge that other transitions might provide quite a different picture of the link between emotion regulation and social functioning. The college transition is culturally valued, it is encountered with a peer group, and it occurs for most people at a developmental stage when social identity is still malleable. Not all transitions share these features. In view of these limitations, one important direction for future research is to apply the present approach in other places and in the context of other important life transitions, to help determine how suppression affects social functioning across a variety of life domains. Additionally, it will be important to examine periods of life that are not marked by major transitions, to explore how the social consequences of expressive suppression are manifested in everyday life.
Acknowledgments
This research was supported by a grant from the National Institutes of Health (R01 MH58147) awarded to James J. Gross.
Footnotes
From this point forward we use the more concise term “suppression” to refer to the central construct of this investigation, suppression of expressive behavior.
Psychometric analyses in the current data and previous studies (e.g., Gross & John, 2003; John & Gross, 2004) indicate that the ERQ measures a general suppression factor. However, to check against the possibility that the findings might be driven by suppression of just positive or just negative emotions, we re-ran the analyses in this paper using the single items referring explicitly to positive or negative emotions. The pattern of effects with these more specific indicators was quite consistent with the reported results, further supporting our interpretation of the present results as attributable to a general suppression factor.
Even though the conceptual decomposition revolves around three components (STABLE, DYNAMIC1, and DYNAMIC2), the analysis only estimates effects of 2 of these components because of the cancellation. When we ran the analyses using SUP2 (instead of SUP1) and ΔSUP as predictors, the coefficients for SUP2 (which, according to the decomposition reflect the stable effect) were identical to the coefficients on SUP1 in the analyses reported. The coefficients for ΔSUP now represented the variance in suppression that was unique to time 1 (i.e., DYNAMIC1). As one would expect, these effects were not significant and near zero.
Contributor Information
Sanjay Srivastava, University of Oregon.
Maya Tamir, Boston College.
Kelly M. McGonigal, Stanford University
Oliver P. John, University of California, Berkeley
James J. Gross, Stanford University
References
- Albright L, Kenny DA, Malloy TE. Consensus in personality judgments at zero acquaintance. Journal of Personality and Social Psychology. 1988;55:387–395. doi: 10.1037//0022-3514.55.3.387. [DOI] [PubMed] [Google Scholar]
- Allen BP, Potkay CR. On the arbitrary distinction between states and traits. Journal of Personality and Social Psychology. 1981;41:916–928. [Google Scholar]
- Arthur N, Hiebert B. Coping with the transition to post-secondary education. Canadian Journal of Counselling. 1996;30:93–103. [Google Scholar]
- Baumeister RF, Leary MR. The need to belong: Desire for interpersonal attachments as a fundamental human motivation. Psychological Bulletin. 1995;117:497–529. [PubMed] [Google Scholar]
- Block J. Assimilation, accommodation, and the dynamics of personality development. Child Development. 1982;53:281–295. [Google Scholar]
- Bollen KA. Structural equations with latent variables. New York: John Wiley & Sons; 1989. [Google Scholar]
- Bonanno GA, Papa A, Lalande K, Westphal M, Coifman K. The importance of being flexible: The ability to enhance and suppress emotional expression predicts long-term adjustment. Psychological Science. 2004;157:482–487. doi: 10.1111/j.0956-7976.2004.00705.x. [DOI] [PubMed] [Google Scholar]
- Brissette I, Scheier MF, Carver CS. The role of optimism in social network development, coping, and psychological adjustment during a life transition. Journal of Personality and Social Psychology. 2002;82:102–111. doi: 10.1037//0022-3514.82.1.102. [DOI] [PubMed] [Google Scholar]
- Butler EA, Egloff B, Wilhelm FH, Smith NC, Erickson EA, Gross JJ. The social consequences of expressive suppression. Emotion. 2003;3:48–67. doi: 10.1037/1528-3542.3.1.48. [DOI] [PubMed] [Google Scholar]
- Cantor N, Norem JK, Niedenthal PM, Langston CA, Brower AM. Life tasks and cognitive strategies in a life transition. Journal of Personality and Social Psychology. 1987;53:1178–1191. [Google Scholar]
- Carver CS, Scheier MF. On the self-regulation of behavior. New York: Cambridge; 1998. [Google Scholar]
- Caspi A, Moffitt TE. When do individual differences matter? A paradoxical theory of personality coherence. Psychological Inquiry. 1993;4:247–271. [Google Scholar]
- Cervone D. Social-cognitive mechanisms and personality coherence: Self-knowledge, situational beliefs, and cross-situational coherence in perceived self-efficacy. Psychological Science. 1997;8:43–50. [Google Scholar]
- Christie NG, Dinham SM. Institutional and external influences on social integration in the freshman year. Journal of Higher Education. 1991;62:412–436. [Google Scholar]
- Cohen P, Cohen J, Aiken LS, West SG. The problem of units and the circumstance for POMP. Multivariate Behavioral Research. 1999;34:315–346. [Google Scholar]
- Cohen S, Hoberman H. Positive events and social supports as buffers of life change stress. Journal of Applied Social Psychology. 1983;13:99–125. [Google Scholar]
- Collins NL, Miller LC. Self-disclosure and liking: A meta-analytic review. Psychological Bulletin. 1994;116:457–475. doi: 10.1037/0033-2909.116.3.457. [DOI] [PubMed] [Google Scholar]
- Compas BE, Wagner BM, Slavin LA, Vannatta K. A prospective study of life events, social support, and psychological symptomatology during the transition from high school to college. American Journal of Community Psychology. 1986;14:241–257. doi: 10.1007/BF00911173. [DOI] [PubMed] [Google Scholar]
- Cronbach LJ. The two disciplines of scientific psychology. American Psychologist. 1957;12:671–684. [Google Scholar]
- Eisenberg N, Fabes RA, Schaller M, Miller PA. Sympathy and personal distress: Development, gender differences, and interrelations of indexes. New Directions for Child Development. 1989;44:107–126. doi: 10.1002/cd.23219894408. [DOI] [PubMed] [Google Scholar]
- Ekman P, Friesen WV. Nonverbal leakage and clues to deception. Psychiatry. 1969;32:88–105. doi: 10.1080/00332747.1969.11023575. [DOI] [PubMed] [Google Scholar]
- Finkel SE. Causal analysis with panel data. Thousand Oaks, CA: Sage; 1995. [Google Scholar]
- Fleeson W. Moving personality beyond the person-situation debate: The challenge and the opportunity of within-person variability. Current Directions in Psychological Science. 2004;13:83–87. [Google Scholar]
- Funder DC. Towards a resolution of the personality triad: Persons, situations, and behaviors. Journal of Research in Personality. 2006;40:21–34. [Google Scholar]
- Gall TL, Evans DR, Bellerose S. Transition to first-year university: Patterns of change in adjustment across life domains. Journal of Social and Clinical Psychology. 2000;19:544–567. [Google Scholar]
- Gross JJ. The emerging field of emotion regulation: An integrative review. Review of General Psychology. 1998;2:271–299. [Google Scholar]
- Gross JJ. Emotion regulation in adulthood: Timing is everything. Current Directions in Psychological Science. 2001;10:214–219. [Google Scholar]
- Gross JJ, John OP. Individual differences in two emotion regulation processes: Implications for affect, relationships, and well-being. Journal of Personality and Social Psychology. 2003;85:348–362. doi: 10.1037/0022-3514.85.2.348. [DOI] [PubMed] [Google Scholar]
- Gross JJ, Levenson RW. Emotional suppression: Physiology, self-report, and expressive behavior. Journal of Personality and Social Psychology. 1993;64:970–986. doi: 10.1037//0022-3514.64.6.970. [DOI] [PubMed] [Google Scholar]
- Gross JJ, Levenson RW. Hiding feelings: The acute effects of inhibiting negative and positive emotion. Journal of Abnormal Psychology. 1997;106:95–103. doi: 10.1037//0021-843x.106.1.95. [DOI] [PubMed] [Google Scholar]
- Harker LA, Keltner D. Expressions of positive emotion in women’s college yearbook pictures and their relationship to personality and life outcomes across adulthood. Journal of Personality and Social Psychology. 2001;80:112–124. [PubMed] [Google Scholar]
- Hoeksma JB, Oosterlaan J, Schipper EM. Emotion Regulation and the dynamics of feelings: A conceptual and methodological framework. Child Development. 2004;75:354–360. doi: 10.1111/j.1467-8624.2004.00677.x. [DOI] [PubMed] [Google Scholar]
- John OP, Gross JJ. Healthy and unhealthy emotion regulation: Personality processes, individual differences, and lifespan development. Journal of Personality. 2004;72:1301–1334. doi: 10.1111/j.1467-6494.2004.00298.x. [DOI] [PubMed] [Google Scholar]
- John OP, Gross JJ. Individual differences in emotion regulation. In: Gross JJ, editor. Handbook of emotion regulation. New York: Guilford; 2007. pp. 351–372. [Google Scholar]
- John OP, Srivastava S. The Big Five trait taxonomy: History, measurement, and theoretical perspectives. In: Pervin LA, John OP, editors. Handbook of personality: Theory and research. 2. New York: Guilford; 1999. pp. 102–138. [Google Scholar]
- Kastellac JP, Leoni EL. Using graphs instead of tables in political science. Perspectives on Politics. 2007;5:755–771. [Google Scholar]
- Keltner D, Haidt J. Social functions of emotions at multiple levels of analysis. Cognition and Emotion. 1999;13:505–522. [Google Scholar]
- Kowalski RM. Complaints and complaining: Functions, antecedents, and consequences. Psychological Bulletin. 1996;119:179–196. doi: 10.1037/0033-2909.119.2.179. [DOI] [PubMed] [Google Scholar]
- Labott SM, Martin RB, Eason PS, Berkey EY. Social reactions to the expression of emotion. Cognition and Emotion. 1991;5:397–417. [Google Scholar]
- Mauss IB, Cook CL, Gross JJ. Automatic emotion regulation during anger provocation. Journal of Experimental Social Psychology. 2007;43:698–711. [Google Scholar]
- Mauss IB, Levenson RW, McCarter L, Wilhelm FH, Gross JJ. The tie that binds? Coherence among emotion experience, behavior, and physiology. Emotion. 2005;5:175–190. doi: 10.1037/1528-3542.5.2.175. [DOI] [PubMed] [Google Scholar]
- Mischel W, Shoda Y. Reconciling processing dynamics and personality dispositions. Annual Review of Psychology. 1998;49:229–258. doi: 10.1146/annurev.psych.49.1.229. [DOI] [PubMed] [Google Scholar]
- Myers DG, Diener E. Who is happy? Psychological Science. 1995;6:10–19. [Google Scholar]
- Newcomb AF, Bukowski WM, Pattee L. Children’s peer relations: A meta-analytic review of popular, rejected, neglected, controversial, and average sociometric status. Psychological Bulletin. 1993;113:99–128. doi: 10.1037/0033-2909.113.1.99. [DOI] [PubMed] [Google Scholar]
- Petruzzello SJ, Motl RW. Physical activity and mental health in college students. In: Landow MV, editor. College students: Mental health and coping strategies. Hauppauge, NY: Nova Science; 2006. pp. 41–57. [Google Scholar]
- Rholes WS, Simpson JA. Attachment theory and close relationships. New York: Guilford; 2004. [Google Scholar]
- Richards JM, Butler EA, Gross JJ. Emotion regulation in romantic couples: The cognitive consequences of concealing feelings. Journal of Social and Personal Relationships. 2003;20:599–620. [Google Scholar]
- Richards JM, Gross JJ. Emotion regulation and memory: The cognitive costs of keeping one’s cool. Journal of Personality and Social Psychology. 2000;79:410–424. doi: 10.1037//0022-3514.79.3.410. [DOI] [PubMed] [Google Scholar]
- Shaver P, Furman W, Buhrmester D. Aspects of a life transition: Network changes, social skills and loneliness. In: Duck S, Perlman D, editors. The Sage series in personal relationships. Vol. 1. London: Sage; 1985. pp. 193–220. [Google Scholar]
- Simpson JA, Gangestad SW, Nations C. Sociosexuality and relationship initiation: Am ethological perspective of nonverbal behavior. In: Fletcher GO, Fitness J, editors. Knowledge structures in close relationships. Mahwah, NJ: Lawrence Erlbaum; 1996. pp. 121–146. [Google Scholar]
- Strack F, Martin LL, Stepper S. Inhibiting and facilitating conditions of the human smile: A nonobtrusive test of the facial feedback hypothesis. Journal of Personality and Social Psychology. 1988;54:768–777. doi: 10.1037//0022-3514.54.5.768. [DOI] [PubMed] [Google Scholar]
- Stepper S, Strack F. Proprioceptive determinants of emotional and nonemotional feelings. Journal of Personality and Social Psychology. 1993;64:211–220. [Google Scholar]
- Tickle-Degnan L, Rosenthal R. The nature of rapport and its nonverbal correlates. Psychological Inquiry. 1990;1:285–293. [Google Scholar]
- Vazire S, Mehl MR. Knowing me, knowing you: The accuracy and unique predictive validity of self and other ratings of daily behavior. Journal of Personality and Social Psychology. doi: 10.1037/a0013314. in press. [DOI] [PubMed] [Google Scholar]
- Wethington E, Kessler RC. Perceived support, received support, and adjustment to stressful life events. Journal of Health and Social Behavior. 1986;27:78–89. [PubMed] [Google Scholar]
- Wirtz D, Kruger J, Scollon CN, Diener E. What to do on spring break? The role of predicted, on-line, and remembered experience in future choice. Psychological Science. 2003;14:520–524. doi: 10.1111/1467-9280.03455. [DOI] [PubMed] [Google Scholar]