

Abstract
Robust quantification is an essential component of comparative –omic strategies. In this regard, glycomics lags behind proteomics. Although various isotope-tagging and direct quantification methods have recently enhanced comparative glycan analysis, a cell culture labeling strategy, that could provide for glycomics the advantages that SILAC provides for proteomics, has not been described. Here we report the development of IDAWG, Isotopic Detection of Aminosugars With Glutamine, for the incorporation of differential mass tags into the glycans of cultured cells. In this method, culture media containing amide-15N-Gln is used to metabolically label cellular aminosugars with heavy nitrogen. Because the amide side chain of Gln is the sole source of nitrogen for the biosynthesis of GlcNAc, GalNAc, and sialic acid, we demonstrate that culturing mouse embryonic stems cells for 72 hours in the presence of amide-15N-Gln media results in nearly complete incorporation of 15N into N-linked and O-linked glycans. The isotopically heavy monosaccharide residues provide additional information for interpreting glycan fragmentation and also allow quantification in both full MS and MS/MS modes. Thus, IDAWG is a simple to implement, yet powerful quantitative tool for the glycomics toolbox.
INTRODUCTION
A range of strategies have been developed for the high throughput quantitative/comparative analysis of large scale systems to enable the expression levels of various molecules to be compared between different biological states. In the –omics fields, the techniques used in the field of proteomics are probably the most developed, and can be broadly subdivided into two general schemes – those that involve the use of labels and those methods that are label free. In the label free approaches, various aspects of the peptides/proteins such as normalized ion intensities, spectral counts, mass, scan number and signal intensity, and accurate mass plus retention time have been successfully used to assign protein expression levels for comparative investigations 1–4. However, the ionization efficiency of each analyte depends on numerous factors, such as molecular mass, proton/cation affinity, surface activity, the presence of other compounds which compete with or interfere with the ionization of the analyte, etc., and thus ion intensities do not directly correlate with concentration. In addition, instrument response can vary over time, so that the direct comparison of data from two or more analyses can yield dramatically different results. Using relative quantification as an alternative strategy overcomes these issues by simultaneously analyzing pairs of isotopically labeled populations. The heavy and light labeled peptide pairs are analyzed under exactly the same conditions, allowing a direct comparison of relative abundances for that peptide. Relative quantification between the isotopically labeled populations is performed by taking a ratio of the area or the intensity of the light and heavy monoisotopic peaks.
Numerous strategies have been developed for introduction of a stable isotope into populations of proteins 5–12. For example, isotope-coded affinity tags (ICAT) chemically target specific amino acids, typically cysteine, in the peptide sequence for differential labeling 5. Other chemical approaches target other functional groups of the polypeptides 6, 8–12. Stable isotopes can also be introduced into biological systems through metabolic labeling. For instance, stable isotope labeling with amino acids in cell culture (SILAC) provides a simple and straightforward method for the incorporation of an isotopic label into proteins prior to MS based proteomics 7. In a SILAC experiment, two cell populations are grown in culture media that are identical except that one of them contains a “light” and the other a “heavy” form of particular amino acids (12C and 13C labeled lysine and arginine for example). The labeled analogs of amino acids are supplied to cells in culture instead of the natural amino acids, and it becomes incorporated into all newly synthesized proteins. After a number of cell divisions, each instance of the particular amino acids is replaced by its isotope labeled analog. An advantage of this approach, over the chemical tagging approaches, is that the cells are mixed together immediately after cell lysis. Thus, proteins from both cell types are subjected to the exact same experimental conditions during sample handling, digestion, purification, etc., eliminating the differential losses that can occur when the samples are treated separately in a parallel manner. For this reason, SILAC is often considered the “gold standard” for quantitative proteomic analyses 13.
The field of comparative glycomics is not as mature as proteomics; however several of the quantitative proteomic tools have been adapted for glycomic analysis. For instance, total ion mapping (TIM) is a label free method that determines the prevalence, percent of an individual glycan to the total of all glycans in the sample, based upon the sum of the fragment ion intensities, and is in some ways similar to the label free methods used in proteomics 14. Isotopic labeling by chemical modification has also been developed by a number of groups. For N-linked glycans and free oligosaccharides, several isotope containing tags have been derived to label the reducing terminus 15–18. O-linked glycans are usually released from the protein backbone via reductive β-elimination, and thus are not amenable to these approaches. However, a quantitative method relying on β-elimination to introduce a mass label into the glycan has been developed 19. Another proposed method for comparative isotopic labeling of oligosaccharides relies on heavy methyl iodide (13CH3, 12CDH2, 12CHD2, and/or 12CD3) vs. light methyl iodide (12CH3) labeling during standard permethylation, which is a commonly used derivatization procedure prior to MS analysis of both N-linked and O-linked glycans 14, 20, 21. In addition, an isobaric labeling strategy using permethylation with 13CH3 and 12CDH2 has been developed for both N- and O-linked glycans, and is particularly useful for the quantification of individual glycans present in isomeric mixtures 22, 23. All of these in vitro approaches are useful tools for glycomics.
Here, we describe an in vivo labeling strategy for glycomic studies. This methodology termed IDAWG, Isotopic Detection of Aminosugars With Glutamine, relies on the hexosamine biosynthetic pathway that uses the side-chain of glutamine as its sole donor source of nitrogen for aminosugars in the production of sugar nucleotides. Thus, introduction of glutamine with a 15N labeled side-chain (amide-15N-Gln) into Gln-free media allows for all aminosugars, including GlcNAc, GalNAc, and sialic acids, to become labeled with 15N. Hence, the mass of N- and O-linked glycans, glycolipids, and extracellular matrix polysaccharides, should all be increased by +1 Dalton per aminosugar. We demonstrate the utility of this approach by the analysis of both N-linked and O-linked glycans released from proteins of murine embryonic stem cells grown in both the light and amide-15N-Gln. The success of these experiments leads us to predict that the IDAWG technology will be useful for a variety of future comparative glycomic studies in cell culture.
EXPERIMENTAL PROCEDURES
Cell culture
The R1 line of murine embryonic stem cells (mESCs) were cultured essentially as previously described 24. The mESC culture media was composed of Dulbecco's modified Eagle's medium (DMEM) supplemented with 10% fetal calf serum (FCS, Commonwealth Serum Laboratories), 2 mM L-glutamine (either 14N or amide-15N), 0.1 mM 2-mercaptoethanol, and 1000U/ml recombinant murine leukemia inhibitory factor (LIF) (ESGRO, Chemicon International). Amide-15N-Gln (98% purity) was purchased from Cambridge Isotopes Inc (Andover, MA). The mESCs were cultured at 37°C under 10% CO2. The media was changed daily for 3 days allowing for approximately 6 doublings from the originally plated 2 × 10⁵ cells, after which the ESCs (~1 × 10⁷) were collected by dissociation buffer and scraping, placed into a 15 ml conical tube, and pelleted at 1,000 × G. The cells were washed 3 times in ice cold phosphate buffered saline (PBS) followed by centrifugation at 1000 × G after each wash. All supernatant was removed from the tube and the cell pellets were stored at − 80 °C until analysis.
ES cell lysis, delipidation, glycan release, and permethylation
The isolation of permethylated N- and O-linked permethylated glycans was essentially as previously described 14, 22, 23, 25. Briefly, cells were resuspended in water and lysed by sonication. Delipidation was carried out using organic extraction in chloroform:methanol:water. The resulting proteins were subjected to trypsin digestion and glycans were released by PNGaseF treatment and β-elimination for N- and O-linked glycans, respectively. Glycans enriched by their inability to tightly bind a reverse-phase solid support were permethylated with methyl iodide and cleaned up by reverse-phase enrichment and dried down.
MS analysis of the permethylated glycans
The glycans were analyzed as previously described 14, 22, 23, 25 on either a linear ion trap mass spectrometer (LTQ, ThermoFisher) or on a hybrid linear ion trap Fourier transform ion cyclotron resonance mass spectrometer (LTQ-FT, ThermoFisher) or on a hybrid linear ion tap Fourier transform orbitrap mass spectrometer (LTQ-Orbitrap, ThermoFisher). Briefly, permethylated glycans were dissolved in a total of 50 µL of sample solution: 15 µL of 100% methanol followed by the addition of 35 µL of 1 mM NaOH in 50% methanol and infused directly into the mass spectrometer using a nanospray ion source with a fused-silica emitter (360 × 75 × 30 µm, SilicaTip™, New Objective) at 2.0 kV capillary voltage, 200 °C capillary temperature, and a syringe flow rate of 0.4 µL/min. Full ITMS (Ion trap mass spectrometry) spectra in positive ion and profile mode were collected at 400–2000 m/z for 30 sec with 5 microscans and 150 maximum injection time (ms). The centroid MS/MS spectra following collision-induced dissociation (CID) were obtained from 400 to 2000 m/z at 34% and 28% normalized collision energy for N- and O-linked glycans respectively, 0.25 activation Q, and 30.0 ms activation time by total ion mapping (TIM). Parent mass step size and isolation width were set at 2.0 m/z and 2.8 m/z respectively for automated MS/MS spectra with TIM scans. MSn experiments were manually carried out in profile mode. Glycan precursor ions were isolated for MSn using an isolation width of 2.5 m/z. For FTICR and Orbitrap analysis, an isolation width of 10 or 8–9 m/z at 100,000 resolution was used respectively. For the quantification experiment, a 1:1 mixture of heavy and light permethylated samples was initially generated based off equal starting proteins amount and slightly adjusted (less than 20% addition of light) to normalize quantification of the disialyated Tn antigen to the theoretical 1:1 ratio. Manual interpretation of all glycan structures was carried out relying on in-house fragmentation rules and glycoworkbench (http://www.dkfz-heidelberg.de/spec/ EUROCarbDB/GlycoWorkbench/). Essentials of Glycobiology symbolic drawing conventions are used for all glycan structures 26. Underincorporation and ratios are calculated as described in the supplemental and are similar to those used for other stable isotope labeling in cell culture approaches.
RESULTS
Mechanism for Isotope Incorporation into Glycoconjugates
The hexosamine biosynthetic pathway converts the glycolysis intermediate fructose-6-phosphate into UDP-GlcNAc (27, Fig. 1A). The first and rate-limiting step in this pathway converts fructose-6-phosphate to glucosamine-6-phosphate with the concomitant conversion of Gln to Glu 28. Thus, the side-chain amide of Gln is the source of nitrogen in the production of UDP-GlcNAc. The other major aminosugar-containing sugar nucleotides, UDP-GalNAc and CMP-sialic acid, are biosynthesized from UDP-GlcNAc29, 30. Thus, all GlcNAc, GalNAc, and sialic acid containing molecules are targets for isotopic labeling by supplementation of cell culture media with amide-15N-Gln (Fig. 1).
Figure 1. IDAWG Labeling Theory and Strategy.

A. A schematic of the hexosamine biosynthetic pathway that converts the glycolysis intermediate fructose-6-phosphate (Fru-6-P) to UDP-GlcNAc showing the addition of nitrogen into the pathway from the amide side-chain of Gln. UDP-GlcNAc goes on to generate UDP-GalNAc and CMP-Neu5Ac so that the aminosugars GlcNAc (blue square), GalNAc (yellow square), or Neu5Ac (purple diamond) in glycoconjugates will have an additional +1 dalton to their mass if amide-15N-Gln is used as the nitrogen donor. Glc, glucose; GlcN, glucosamine. B. Schematic of the IDAWG in vivo cell culture labeling strategy for comparative glycomics. Amide-15N-Gln or Gln is added to the media to label cultured cells. Upon harvesting cells can be combined, then N-linked and O-linked glycans isolated from digested proteins for permethylation and tandem mass spectrometry analysis.
Initial experiments were performed to evaluate the possibility of using metabolic labeling as a method to incorporate a stable isotope into the glycans of cells grown in culture. In these experiments, R1 murine embryonic stem cells (mESCs) were grown using standard conditions. Cell culture media is typically supplied without glutamine, as this amino acid decomposes to glutamic acid and ammonia under aqueous conditions. This forumulation simplifies the IDAWG labeling approach, because there is no need to specifically deplete the media of Gln. Either amide-15N-Gln or the 14N-version was used to supplement the media at the standard concentration (2mM). This straightforward substitution is the only alteration to the normal cell culturing procedure needed for IDAWG. Thus, we labeled murine ES cells for three days with heavy or with light Gln and then isolated both N- and O-linked glycans from proteins for mass spectrometry-based analysis (Fig. 1B). Labeling for four days did not improve labeling efficiency, however IDAWG analysis of certain differentiated cell types has shown the need for prolonged labeling up to one week for efficient incorporation (data not shown).
15N Incorporation into N-linked Glycans
The incorporation of 15N into the N-linked glycans of mESCs was investigated by comparing the full spectra of permethylated N-linked glycans, following release from cells grown in either amide-14N-Gln or amide-15N-Gln (Fig. 2). Both samples were subjected to total ion mapping analysis and MSn to confirm structural assignments as necessary. The abundant ions observed in these spectra are predominantly high mannose glycans (Man5–9 GlcNAc2) that are either singly or doubly charged (structures 1–3, 6, 12–13, and 15 from Fig. 2). Comparison of these two spectra reveals that the high mannose glycan ions obtained from the cells grown in the amide-15N-Gln containing media are increased by 1 m/z unit for the doubly charged ions and 2 m/z units for the singly charged ions, within the mass tolerance of the linear ion trap,. This is the expected result provided that 15N has been incorporated into the two core GlcNAcs, which are the only nitrogens present in high mannose glycans. Also contained within the full spectra are ions representing complex glycans containing additional GlcNAc (structures 4, 5, 7, 8, 10, 11, and 14 from Fig. 2) as well as sialic acid as Neu5Ac (structure 11 from Fig. 2) residues. These glycans are all shifted in the amide-15N-Gln samples by the appropriate mass for 15N-incorporation into GlcNAc and Neu5Ac.
Figure 2. Isotopically Labeled N-linked Glycans.

Full spectra from 850–2000 m/z of the permethylated N-linked glycans released from cells grown in either 14N-Gln or amide-15N-Gln analyzed on a linear ion trap (LTQ). Major glycans identified by total ion mapping and MSn are shown along with charge state (Z), number of nitrogens, and observed shift in mass between the samples.
For calculation of labeling efficiencies, the samples were analyzed on a hybrid LTQ-FT instrument. Closer inspection of the doubly charged molecular ion, [M+2Na]2+, resulting from the GlcNAc2Man7 glycan (structure 2 of Fig. 2), which appears at 1005.5 and 1006.5 m/z units from glycans grown in the 14N and amide-15N Gln media, respectively, is shown in Fig. 3. In these spectra, the most intense ion appears at the monoisotopic mass calculated with either 14N for light media or at two 15N for heavy media, demonstrating that this glycan has 15N incorporated into both possible sites. Ions are present that correspond to under labeling, i.e., the incorporation of zero and one 15N, however the dominant species is fully labeled. Zoom scans were performed on several structures containing theoretically 2–5 15N-residues. The ratios of the intensities of the different isotopes in the 15N spectrum indicate an average 95.8% incorporation of 15N into N-linked glycans (Table 1), which is very similar to the extent of 15N in the glutamine used for this experiment (98%). Thus, 15N from amide-15N-Gln becomes efficiently and extensively incorporated into amino sugars of N-linked glycans.
Figure 3. Isotope Pattern of Light and Heavy Man7GlcNAc2.

Zoom scans from a FTICR (LTQ-FT) show the expected mass shift of 2 daltons for the core GlcNAc residues that are outlined with bold with an asterisk in the amide-15N-Gln labeled sample (bottom spectrum). Note the under incorporation in the heavy spectrum which allowed us to calculate the labeling efficiency in Table 1.
Table 1.
IDAWG labeling efficiencies
| No | N-linked glycan composition | Structure | Number of nitrogens |
Z | [M+2Na]2+ |
Labeling efficiency (%) |
|
|---|---|---|---|---|---|---|---|
| m/z (mono) | ΔM (m/z) | ||||||
| 1 | (Man)4+(Man)3(GlcNAc)2 |  |
2 | 2 | 1005.48 | 1.0 | 95 |
| 2 | (Man)5+(Man)3(GlcNAc)2 |  |
2 | 2 | 1107.53 | 1.0 | 96 |
| 3 | (Gal)2(GlcNAc)2(Fuc)1+(Man)3(GlcNAc)2 |  |
4 | 2 | 1133.55 | 2.0 | 96 |
| 4 | (Gal)2(GlcNAc)2(Fuc)2+(Man)3(GlcNAc)2 |  |
4 | 2 | 1220.60 | 2.0 | 95 |
| 5 | (Gal)1(GlcNAc)3(Fuc)1+(Man)3(GlcNAc)2 |  |
5 | 2 | 1154.07 | 2.5 | 97 |
MS/MS spectra resulting from the fragmentation of N-linked glycans display patterns consistent with aminosugar labeling. For example, fragmentation profiles for a heavy- and a light-labeled, core fucosylated, fully sialyated, biantennary N-linked glycan are consistent with 15N-incorporation into Neu5Ac as well as core and antennary GlcNAc residues (Fig. 4). Therefore, IDAWG labeling can aid in the assignment of structures based on the identification of fragments that include isotopically tagged monosaccharide residues.
Figure 4. Fragmentation of a Light and Heavy Labeled Complex N-linked Glycan.

A. MS/MS fragmentation spectrum of a permethylated, core fucosylated, fully sialyated biantenneary N-linked glycan from mouse embryonic stem cells. B. MS/MS fragmentation spectrum of the same structure as in A. from the amide-15N-Gln labeled sample. Note the m/z shift of ~3 Da on the LTQ spectrum for the [M+2Na}2+ parent ion and the appropriate shift in m/z for the fragments corresponding to labeling of all 4 GlcNAc residues as well as the 2 Neu5Ac monosaccharides. Theoretical fragmentation is shown for all structures. Theoretical internal fragmentation, such as the internal Gal-GlcNAc at ~472/473 m/z, are not illustrated on the cartoon for clarity.
15N Incorporation into and Quantification of O-linked Glycans
To study the incorporation of 15N into the O-linked glycans of mESCs, the full spectra of the permethylated O-linked glycans were compared, following release from cells grown in either 14N-Gln or amide-15N-Gln. Both samples were subjected to total ion mapping analysis and MSn when necessary to confirm the structures. To demonstrate the incorporation of 15N into all 3 aminosugars contained in O-glycans, MS/MS spectra from heavy- and light-labeled samples are shown for three different O-linked glycan types (Fig. 5): an O-Man initiated tetrasaccharide containing GlcNAc and Neu5Ac, an O-GalNAc initiated structure containing a branching GlcNAc (core 2), and an O-GalNAc initiated structure containing two Neu5Ac residues (disialyl core 1). The isolation m/z (parent ion mass) and fragmentation profiles of all 3 O-linked structures are consistent with efficient 15N-incorporation into all GlcNAc, GalNAc, and Neu5Ac monosaccharides. As can be seen from the fragmentation patterns, the reducing end GalNAc is isotopically labeled in the heavy samples as are the GlcNAc and NeuAc in the extended chains.
Figure 5. Light and Heavy Labeling of O-linked Glycans.

A. and B. display spectra of the MS/MS fragmentation of an O-Man initiated structure from light and heavy, respectively, labeled cells showing incorporation of 15N into both the GlcNAc and NeuAc residue. Note that B. also trapped another glycan structure not shown. C. and D. display spectra of the MS/MS fragmentation of a core 2 O-GalNAc initiated structure from light and heavy, respectively, labeled cells showing incorporation of 15N into both the GalNAc and GlcNAc residue. E. and F. display spectra of the MS/MS fragmentation of the disiayl T-antigen from light and heavy, respectively, labeled cells showing incorporation of 15N into GalNAc and both NeuAc residues. Theoretical fragments are shown for all structures that were acquired on the LTQ.
Furthermore, we mixed equal amounts of a heavy and light labeled pools of O-glycans from mESCs based off generating a 1:1 ratio for the disialyated Tn antigen and then quantified the eight other most abundant O-glycans (Fig.6, Table 2). We observed an average ratio of 0.94:1 (1:1 theoretical) with a standard deviation of 0.08. The results of figures 5 and 6 highlight that 15N is incorporated into all 3 aminosugars of O-Glycans and that simultaneous analysis and fragmentation of light and heavy structures should aid greatly in glycan assignment and quantification. Furthermore, as shown in table 2 and illustrated for two structures in figure 6, robust quantification is achievable.
Figure 6. Quantitative Analysis of O-linked Glycans.

A mixture of O-linked glycans from a 1:1 mixture of light/heavy labeled mESCs were mixed together and analyzed on an LTQ-Orbitrap. A. Quantification of the monosialyated T-antigen in a 8 m/z window (2 nitrogens). B. Quantification of a disialyated core 2 structure in a 9 m/z window (4 nitrogens).
Table 2.
Quantifying O-linked Glycans
| No. | Glycan Structure | [M+Na]+ (mono) |
Ratio | |
|---|---|---|---|---|
| Amide-14N-Gln | Amide-15N-GLN | |||
| 1 |  |
534.29 | 535.29 | 0.88 |
| 2 |  |
895.46 | 897.47 | 0.84 |
| 3 |  |
1157.6 | 1159.61 | 0.93 |
| 4 | 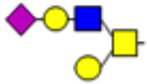 |
1344.69 | 1347.7 | 0.97 |
| 5 |  |
1432.74 | 1435.75 | 1.03 |
| 6 | 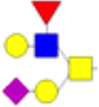 |
1518.78 | 1521.78 | 0.85 |
| 7 |  |
1705.86 | 1709.87 | 0.93 |
| 8 | 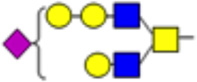 |
1793.91 | 1797.93 | 1.08 |
DISCUSSION
Herein we have described a simple to implement but powerful isotopic labeling strategy for glycans in cell culture systems. The IDAWG methodology relies on the fact that the amide side chain of Gln is the sole nitrogen donor for UDP-GlcNAc via the hexosamine biosynthetic pathway and that UDP-GlcNAc is the substrate for the biosynthesis of UDP-GalNAc and CMP-Neu5Ac (or its glycolylated counterpart, CMP-Neu5Gc). Using mESCs we demonstrate that replacement of the normal Gln supplement with amide-15N-Gln allows for nearly complete isotope labeling of GlcNAc, GalNAc, and Neu5Ac residues of N-linked and O-linked glycans within a 72 hour labeling period. This technique should provide for robust quantification of glycan expression differences following their release from proteins and lipids isolated from differentially labeled samples.
A significant advantage of the IDAWG labeling strategy, similar to SILAC for proteomics, is that differentially labeled cells can be mixed together at the beginning of the analytic procedure, minimizing the contribution of handling and work-up to overall variability. Furthermore, the expected mass differences between the heavy- and lightlabeled forms of even the most complex glycans is under 10 mass units for their singly charged ions. For most glycan structures this difference is below 5 mass units. Therefore, fragmentation of heavy- and light-labeled glycans can be monitored and quantified simultaneously within the same isolation window, further reducing another source of analytic variablity. Such relative quanitification of glycan prevalence using MS/MS or perhaps MSn, in which signal-to-noise is greatly increased, also provides a significant gain in sensitivity for characterizing alterations in minor glycans. In our quantitative experiment for O-glycans, we observed no more than 20% deviation from expected, so that induced reproducible changes of less than 2-fold should be readily quantifiable.
The IDAWG technique provides a labeling strategy that should also be amenable for characterizing glycopeptides directly and we are currently exploring this possibility by examining the dynamic O-GlcNAc modification 31 on proteins isolated from light and heavy Gln-labeled cell culture systems. While shotgun proteomic experiments performed on peptides obtained from the 15N labeled samples identified peptides that incorporated amide-15N-Gln, no other heavy amino acids were observed (data not shown). This observation that 15N-Gln also is incorporated into proteins, without migration of the heavy nitrogen label into other amino acids, provides a SILAC-like labeling strategy that could be used alone or in combination with heavy Arg/Lys SILAC 7 to quantify glycans, proteins, and glycoproteins/glycopeptides all from the same set of samples.
Finally, the metabolic labeling of glycans using IDAWG provides new opportunities for assessing the dynamics of glycan turnover during the course of any cellular behavior that can be induced or sustained in culture. By completely labeling cells with heavy Gln and then replacing the media supplement with light Gln, the synthesis and degration of any aminosugar-containing glycans can be evaluated. Previously, glycan turnover studies required incorporation of radioactive monosaccharide and extensive subsequent fractionation to identify specific changes in glycan expression. Generally, the radiotracer techniques allowed for very sensitive detection of glycan classes, but lacked the resolution to follow individual glycan structures or subsets of biosynthetically-related species. The stable isotope incorporation method reported here weds the analytic advantages of high-resolution mass spectrometry to the biological necessity of understanding the dynamics of glycan turnover. Sharp focus on individual glycans or on glycan subsets may reveal that turnover reports cellular differentiation or metabolic state in a more informative manner than is possible when simple glycan prevalence is sampled at a biological endpoint. Thus, we believe that IDAWG is a powerful new quantitative tool for exploring the biological role of glycans, glycoproteins, and glycolipids in cell culture systems.
Supplementary Material
Acknowledgements
We would like to thank all members of the Wells, Orlando, Tiemeyer, Moremen, York, Dalton, and Pierce laboratories for helpful discussions. This work is supported in part by grants from NIH/NCRR 5P41RR018502 (M.P. PI; R.O., K.W.M., W.S.Y., M.T., S.D., and L.W. senior investigators), and NIH/NIDDK 1R01DK075069 (L.W.).
Footnotes
Supporting Information: The mathematical calculations used to calculate underincorporation and relative ratios of light/heavy species is available as supporting information. This information is available free of charge via the Internet at http://pubs.acs.org.
REFERENCES
- 1.Liu H, Sadygov RG, Yates JR., 3rd A model for random sampling and estimation of relative protein abundance in shotgun proteomics. Anal Chem. 2004;76(14):4193–4201. doi: 10.1021/ac0498563. [DOI] [PubMed] [Google Scholar]
- 2.Radulovic D, Jelveh S, Ryu S, Hamilton TG, Foss E, Mao Y, Emili A. Informatics platform for global proteomic profiling and biomarker discovery using liquid chromatography-tandem mass spectrometry. Mol Cell Proteomics. 2004;3(10):984–997. doi: 10.1074/mcp.M400061-MCP200. [DOI] [PubMed] [Google Scholar]
- 3.Silva JC, Denny R, Dorschel CA, Gorenstein M, Kass IJ, Li GZ, McKenna T, Nold MJ, Richardson K, Young P, Geromanos S. Quantitative proteomic analysis by accurate mass retention time pairs. Anal Chem. 2005;77(7):2187–2200. doi: 10.1021/ac048455k. [DOI] [PubMed] [Google Scholar]
- 4.Wang W, Zhou H, Lin H, Roy S, Shaler TA, Hill LR, Norton S, Kumar P, Anderle M, Becker CH. Quantification of proteins and metabolites by mass spectrometry without isotopic labeling or spiked standards. Anal Chem. 2003;75(18):4818–4826. doi: 10.1021/ac026468x. [DOI] [PubMed] [Google Scholar]
- 5.Gygi SP, Rist B, Gerber SA, Turecek F, Gelb MH, Aebersold R. Quantitative analysis of complex protein mixtures using isotope-coded affinity tags. Nat Biotechnol. 1999;17(10):994–999. doi: 10.1038/13690. [DOI] [PubMed] [Google Scholar]
- 6.Liu P, Regnier FE. An isotope coding strategy for proteomics involving both amine and carboxyl group labeling. J Proteome Res. 2002;1(5):443–450. doi: 10.1021/pr0255304. [DOI] [PubMed] [Google Scholar]
- 7.Ong SE, Blagoev B, Kratchmarova I, Kristensen DB, Steen H, Pandey A, Mann M. Stable isotope labeling by amino acids in cell culture, SILAC, as a simple and accurate approach to expression proteomics. Mol Cell Proteomics. 2002;1(5):376–386. doi: 10.1074/mcp.m200025-mcp200. [DOI] [PubMed] [Google Scholar]
- 8.Rao KC, Carruth RT, Miyagi M. Proteolytic 18O labeling by peptidyl-Lys metalloendopeptidase for comparative proteomics. J Proteome Res. 2005;4(2):507–514. doi: 10.1021/pr049792c. [DOI] [PubMed] [Google Scholar]
- 9.Schnolzer M, Jedrzejewski P, Lehmann WD. Protease-catalyzed incorporation of 18O into peptide fragments and its application for protein sequencing by electrospray and matrix-assisted laser desorption/ionization mass spectrometry. Electrophoresis. 1996;17(5):945–953. doi: 10.1002/elps.1150170517. [DOI] [PubMed] [Google Scholar]
- 10.Vosseller K, Hansen KC, Chalkley RJ, Trinidad JC, Wells L, Hart GW, Burlingame AL. Quantitative analysis of both protein expression and serine / threonine post-translational modifications through stable isotope labeling with dithiothreitol. Proteomics. 2005;5(2):388–398. doi: 10.1002/pmic.200401066. [DOI] [PubMed] [Google Scholar]
- 11.Wells L, Vosseller K, Cole RN, Cronshaw JM, Matunis MJ, Hart GW. Mapping sites of O-GlcNAc modification using affinity tags for serine and threonine post-translational modifications. Mol Cell Proteomics. 2002;1(10):791–804. doi: 10.1074/mcp.m200048-mcp200. [DOI] [PubMed] [Google Scholar]
- 12.Yao X, Freas A, Ramirez J, Demirev PA, Fenselau C. Proteolytic 18O labeling for comparative proteomics: model studies with two serotypes of adenovirus. Anal Chem. 2001;73(13):2836–2842. doi: 10.1021/ac001404c. [DOI] [PubMed] [Google Scholar]
- 13.Ong SE, Foster LJ, Mann M. Mass spectrometric-based approaches in quantitative proteomics. Methods. 2003;29(2):124–130. doi: 10.1016/s1046-2023(02)00303-1. [DOI] [PubMed] [Google Scholar]
- 14.Aoki K, Perlman M, Lim JM, Cantu R, Wells L, Tiemeyer M. Dynamic developmental elaboration of N-linked glycan complexity in the Drosophila melanogaster embryo. J Biol Chem. 2007;282(12):9127–9142. doi: 10.1074/jbc.M606711200. [DOI] [PubMed] [Google Scholar]
- 15.Bowman MJ, Zaia J. Tags for the stable isotopic labeling of carbohydrates and quantitative analysis by mass spectrometry. Anal Chem. 2007;79(15):5777–5784. doi: 10.1021/ac070581b. [DOI] [PMC free article] [PubMed] [Google Scholar]
- 16.Hitchcock AM, Costello CE, Zaia J. Glycoform quantification of chondroitin/dermatan sulfate using a liquid chromatography-tandem mass spectrometry platform. Biochemistry. 2006;45(7):2350–2361. doi: 10.1021/bi052100t. [DOI] [PMC free article] [PubMed] [Google Scholar]
- 17.Xia B, Kawar ZS, Ju T, Alvarez RA, Sachdev GP, Cummings RD. Versatile fluorescent derivatization of glycans for glycomic analysis. Nat Methods. 2005;2(11):845–850. doi: 10.1038/nmeth808. [DOI] [PubMed] [Google Scholar]
- 18.Yuan J, Hashii N, Kawasaki N, Itoh S, Kawanishi T, Hayakawa T. Isotope tag method for quantitative analysis of carbohydrates by liquid chromatography-mass spectrometry. J Chromatogr A. 2005;1067(1–2):145–152. doi: 10.1016/j.chroma.2004.11.070. [DOI] [PubMed] [Google Scholar]
- 19.Xie Y, Liu J, Zhang J, Hedrick JL, Lebrilla CB. Method for the comparative glycomic analyses of O-linked, mucin-type oligosaccharides. Anal Chem. 2004;76(17):5186–5197. doi: 10.1021/ac0496953. [DOI] [PubMed] [Google Scholar]
- 20.Alvarez-Manilla G, Warren NL, Abney T, Atwood J, 3rd, Azadi P, York WS, Pierce M, Orlando R. Tools for glycomics: relative quantitation of glycans by isotopic permethylation using 13CH3I. Glycobiology. 2007;17(7):677–687. doi: 10.1093/glycob/cwm033. [DOI] [PubMed] [Google Scholar]
- 21.Kang P, Mechref Y, Kyselova Z, Goetz JA, Novotny MV. Comparative glycomic mapping through quantitative permethylation and stable-isotope labeling. Anal Chem. 2007;79(16):6064–6073. doi: 10.1021/ac062098r. [DOI] [PubMed] [Google Scholar]
- 22.Atwood JA, 3rd, Cheng L, Alvarez-Manilla G, Warren NL, York WS, Orlando R. Quantitation by isobaric labeling: applications to glycomics. J Proteome Res. 2008;7(1):367–374. doi: 10.1021/pr070476i. [DOI] [PubMed] [Google Scholar]
- 23.Bothelo JC, Atwood JA, 3rd, Cheng L, Alvarez-Manilla G, York WS, Orlando R. QUIBL for the Comparative Glycomic Study of O-linked Glycans. International Journal of Mass Spectrometry. 2008 IN PRESS. [Google Scholar]
- 24.Stead E, White J, Faast R, Conn S, Goldstone S, Rathjen J, Dhingra U, Rathjen P, Walker D, Dalton S. Pluripotent cell division cycles are driven by ectopic Cdk2, cyclin A/E and E2F activities. Oncogene. 2002;21(54):8320–8333. doi: 10.1038/sj.onc.1206015. [DOI] [PubMed] [Google Scholar]
- 25.Aoki K, Porterfield M, Lee SS, Dong B, Nguyen K, McGlamry KH, Tiemeyer M. The diversity of O-linked glycans expressed during Drosophila melanogaster development reflects stage- and tissue-specific requirements for cell signaling. J Biol Chem. 2008 doi: 10.1074/jbc.M804925200. [DOI] [PMC free article] [PubMed] [Google Scholar]
- 26.Varki A, Cummings RD, Esko JD, Freeze HH, Stanley P, Bertozzi CR, Hart GW, Etzler ME. Essentials of Glycobiology. second edition. New York: Cold Spring Harbor Laboratory Press; 2008. [PubMed] [Google Scholar]
- 27.McClain DA. Hexosamines as mediators of nutrient sensing and regulation in diabetes. J Diabetes Complications. 2002;16(1):72–80. doi: 10.1016/s1056-8727(01)00188-x. [DOI] [PubMed] [Google Scholar]
- 28.Yki-Jarvinen H, Vogt C, Iozzo P, Pipek R, Daniels MC, Virkamaki A, Makimattila S, Mandarino L, DeFronzo RA, McClain D, Gottschalk WK. UDP-N-acetylglucosamine transferase and glutamine: fructose 6-phosphate amidotransferase activities in insulin-sensitive tissues. Diabetologia. 1997;40(1):76–81. doi: 10.1007/s001250050645. [DOI] [PubMed] [Google Scholar]
- 29.Kean EL, Munster-Kuhnel AK, Gerardy-Schahn R. CMP-sialic acid synthetase of the nucleus. Biochim Biophys Acta. 2004;1673(1–2):56–65. doi: 10.1016/j.bbagen.2004.04.006. [DOI] [PubMed] [Google Scholar]
- 30.Thoden JB, Wohlers TM, Fridovich-Keil JL, Holden HM. Human UDP-galactose 4-epimerase. Accommodation of UDP-N-acetylglucosamine within the active site. J Biol Chem. 2001;276(18):15131–15136. doi: 10.1074/jbc.M100220200. [DOI] [PubMed] [Google Scholar]
- 31.Wells L, Vosseller K, Hart GW. Glycosylation of nucleocytoplasmic proteins: signal transduction and O-GlcNAc. Science. 2001;291(5512):2376–2378. doi: 10.1126/science.1058714. [DOI] [PubMed] [Google Scholar]
Associated Data
This section collects any data citations, data availability statements, or supplementary materials included in this article.