Abstract
Melanoma is highly resistant to conventional chemotherapeutic agents and novel therapeutic approaches are needed. Current animal models of melanoma in animals are sub-optimal. The most commonly used homograft model is the B16 mouse melanoma. Evaluation of potential melanoma therapies with this model is limited by the inaccuracy of caliper measurement of subcutaneous tumors, of counting lung nodules in metastasis models, and the indirect nature of “survival” curves when studying brain metastases. We have developed and characterized an accurate, sensitive, and reproducible bioluminescent B16 melanoma model that allows for serial, real-time analyses of tumor burden in live mice. We demonstrate that this model is applicable to subcutaneous tumors, lung metastases, and intracranial tumors and offers a solution to many of the limitations of previous models. As proof of principle, we use this model to show the efficacy of a live, Listeria monocytogenes vaccine expressing the melanoma antigen tyrosinase-related protein-2 to protect mice against intravenous B16 melanoma challenge. Additionally, we extend our approach to include the human A375 melanoma model and are able to show in vivo differences between sub-lines with varying metastatic potential. These models represent an accurate and reproducible means for in vivo melanoma monitoring in preclinical studies.
Keywords: B16 melanoma, cancer vaccines, imaging techniques, Listeria monocytogenes, luciferase
Animal models of melanoma are in short supply. Yet pre-clinical studies of potential therapies for melanoma depend on these models. Several models, including the B16 melanoma model, the M3 DBA/2 melanoma model (Palamara et al, 2004), and the H-rasV12G tetracycline-inducible model (Chin et al, 1999) have been developed in immunocompetent mice. Additionally, in immunocompromised animals, human xenograft melanoma models have been developed—including the well-studied A375 human melanoma model in severe combined immunodeficiency mice (SCID) mice. These models vary in their utility for evaluating genetic influences on melanoma, potential direct tumor therapies, or potential immunotherapies. Models involving immunocompromised animals are not applicable to study immune-based therapies. All of these models are, however, limited in the ability to monitor tumor burden in animals, especially for small tumors. Quantification of tumor progression in live animals is limited by several factors including the lower limits of detection, the lack of precision when measuring subcutaneous tumors with calipers, difficulty in identifying metastatic foci in the lungs, and the obvious challenges of evaluating brain metastases and intracranial tumors.
Specifically, for subcutaneous tumors, the lower limits of detection using caliper measurement are problematic. Although difficult to know exactly, a palpable subcutaneous tumor may first be detectable only when well over 106 cells are present. Complete clearance of tumors is, however, an important endpoint that cannot be determined at this level of sensitivity. Another issue relevant to serial monitoring of subcutaneous tumors is that central necrosis, ulceration, or therapy-induced apoptosis may not be fully accounted for by gross tumor measurements. For these reasons, a tumor monitoring system that is more sensitive and quantifies only live cells would be a valuable tool.
One of the current models for metastasis of melanoma and other tumors is lung tumor formation after intravenous tail vein injection of tumor cells. Although this model does not incorporate all the naturally occurring steps involved in metastasis, it has historically been used to evaluate changes in metastatic potential of melanoma cells or therapies affecting metastasis (Collisson et al, 2003a, b). In this model, B16 melanoma tumors are usually quantified by counting black tumors on the outside of excised lungs. This methodology suffers from the following deficiencies: that the lung tumors are of varying sizes and this is not incorporated into the “metastatic foci number”; that tumors on the interior aspects of the lungs and in mediastinal lymph nodes are not quantified; and most importantly, each measurement of tumor burden requires sacrifice of the animal, precluding analysis of responsiveness to therapeutic endeavors. This results in experiments that require unnecessarily large numbers of animals in order to monitor tumor load at different time points. The ability to monitor the number and anatomic location of living tumor cells sequentially in a live animal can address all of these deficiencies.
Lastly, melanoma commonly metastasizes to the brain in humans. Patients with brain metastases are typically considered for palliative care only because of the high risk of complications during interventional therapies, as well as a perceived risk for inducing CNS autoimmunity. Therefore, significant research efforts are targeted at developing therapies for melanoma metastases to the brain. Monitoring of brain tumor development in animals is complicated by some of the same challenges outlined for lung metastases above. Brain tumor burden is, however, usually monitored indirectly through morbidity and survival curves. This methodology requires increased numbers of experimental animals and does not directly quantify tumor burden in the brain. Nor does it account for other causes of mortality (i.e., inflammatory responses that induce increased intracranial pressure). Post-mortem dissection is the most commonly used means to quantify intracranial tumors. The ability to monitor intracranial tumor growth in live animals would aid in the assessment of potential therapies for intracranial melanoma metastases.
Currently available technologies to study tumors in live rodents include MRI (magnetic resonance imaging), micro-CT (computed tomography) micro-PET (positron emission topography), and bioluminescent imaging (BLI). MRI, CT, and PET all offer the advantage of more accurate three-dimensional structural imaging of tumor mass and all can be used on tumors of endogenous origin. Additionally micro-PET offers the ability to image biological processes with molecular, enzymatic, or metabolic endpoints. MRI, CT, and PET are all quite expensive to perform, require significant image collection time, and can only image one animal at a time. BLI offers the advantage of being relatively inexpensive, has a very short image collection time, many animals can be imaged simultaneously, is quite sensitive, and the equipment is readily available (Xenogen, Alameda, California) The disadvantage of the BLI system is that it currently does not have as high of a resolution as the above techniques, and the system collects tumor signal in a two-dimensional plane. Additionally, BLI depends on the expression of a foreign gene in the tumors being evaluated thus limiting its use in endogenous tumors. (Reviewed in Contag and Ross (2002) and Hollingshead et al (2004).)
The advantages of BLI outweigh the advantages of other tumor assessment modalities in this system. Thus, we sought to develop and characterize a mouse melanoma model using BLI where serial monitoring allows for accurate, real time, in vivo, quantification of tumor burden. The A375 melanoma cell line has been previously used to study imaging techniques (Ray et al, 2004). In this report, we characterize a novel murine model using the B16 tumor line expressing firefly luciferase (Fluc) and green fluorescent protein (GFP) demonstrating its accuracy and utility for subcutaneous tumors, lung metastases, and intracranial tumor monitoring and show examples of each. We show this technology is not limited to the B16 line by extending our studies to the A375 human melanoma line in SCID mice. The B16-Fluc model has been successfully used recently by our group to study vaccine therapy, (Bruhn et al, 2005) and vaccine adjuvants.2 Additionally, we have also used the A375-Fluc model to study direct tumor therapies targeting cell signaling cascades in melanoma (Collisson et al, 2003a, b). Because these models offer many advantages over traditional models of tumor monitoring and limit the number of animals required for preclinical studies of potential therapies, these BLI models should be considered in future studies of melanoma and may be extended to other melanoma models and other tumor models in general when possible.
Results and Discussion
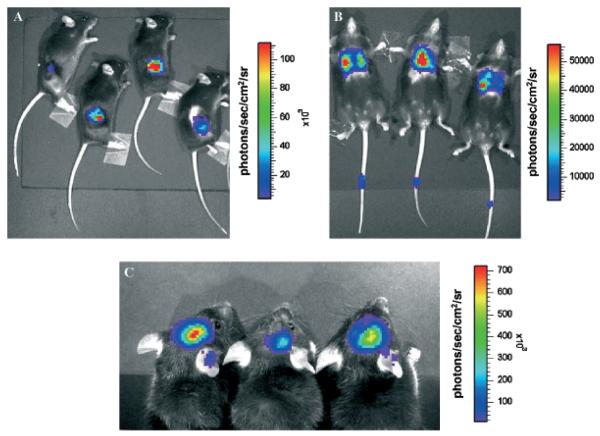
Quantification of metastatic tumors by lung examination offers only a gross estimate of tumor burden, as individual lung nodules tend to vary widely in size, density, and location. This methodology also requires euthanasia and allows analysis at only a single time point. To circumvent these limitations, we used optical imaging of bioluminescent tumor cells as an alternative approach to assess levels of systemic immunoprotection. B16 melanoma cells were stably transduced with a lentiviral construct expressing the Fluc and GFP coding sequences (Ray et al, 2004). These cells were introduced back into C57BL/6 mice, either by subcutaneous injection, by intravenous injection, or by intracranial implantation. To visualize B16-Fluc cells in the animals, we injected the luciferase substrate d-luciferin into the peritoneum of anesthetized animals and detected bioluminescence with a cooled charge-coupled device (CCD) camera (Wu et al, 2001). Examples of mice with subcutaneous tumors (Fig 1A), lung tumors (Fig 1B), and intracranial tumors (Fig 1C) are shown. The colors overlying the animals represent the rate of photons being emitted where red is the highest density of photons and violet is the lowest detectable emission rate.
Figure 1. Three distinct models of B16-Fluc (firefly luciferase) murine melanoma analyzed with bioluminescent imaging.
Note signal scale differences and magnification differences between panels. (A) 1 × 10⁴ cells were implanted subcutaneously in 100 μL with 50% Matrigel and imaged for 5 s 3 wk after implantation. (B) 1 × 10⁴ cells were injected intravenously in 200 μL PBS and imaged for 60 s 3 wk later to show metastases in the lungs. Note signal from needle track in tails where injection was made 3 wk prior, detecting a very small number of viable cells in the tail. (C) 1 × 10³ cells in 2 μL were implanted intracranially with a Hamilton syringe and imaged 2 wk later for 60 s (signal observed on ears is reflective light).
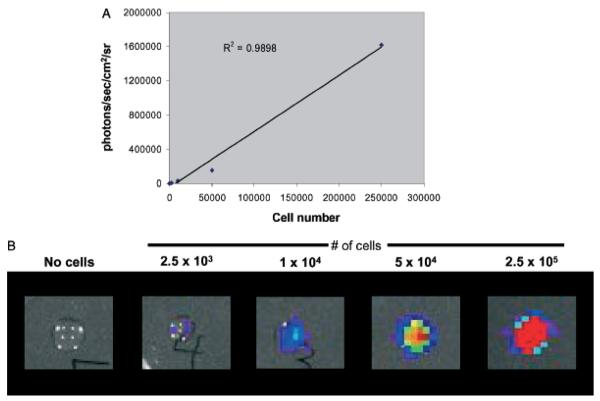
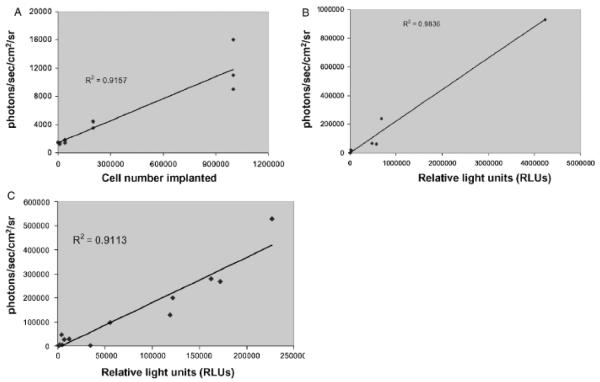
To characterize the imaging system with B16 tumors and validate our results, we correlated rates of photon emission with tumor burden. As shown in Fig 2A, light emission as detected by the imaging system correlates well with number of B16-Fluc cells in a 50 μL droplet in vitro. The correlation is linear at very low and at high levels (r2 = 0.99) of luminescence (Fig 2). Notably, the limits of detection ex vivo are not fully tested here since several parameters including distance to the detector and substrate concentration were not varied. When serial dilutions of cells were imaged 30 min following intravenous injection, photon emission correlated well (r2 = 0.92) with number of cells injected (Fig 3A). Although the number of cells retained in the lungs immediately after injection cannot be determined, these results indicate that the lower limit for detection of B16-Fluc lung metastases may be approximately 1 × 10⁴ B16 Fluc cells. This limit of detection is dependent on several factors including cell line, expression construct, concentration of luciferin injected, the light collecting efficiency of the imaging system, and distance from the animal to the detector. This example is shown to illustrate the linear nature of the system and the lower limits of detection using typical settings with this particular B16-Fluc model. After 11 d, these animals were euthanized and their lungs were excised. BLI measurements also correlated with the numbers of surface metastases on excised lungs upon ex vivo visual examination of the lungs (Fig 4). This example illustrates why visual inspection of lung metastases is a very crude assessment of metastatic tumor volume and that BLI assessment of lung metastases is more accurate at very low and very high tumor burdens.
Figure 2. Bioluminescence correlates with in vitro cell number.
B16-Fluc (firefly luciferase) cells were counted, serially diluted, and then mixed with d-luciferin substrate in a 50 μL droplet. Droplets were imaged immediately afterwards for 60 s. (A) Bioluminescent signal (photons per s per cm2 per steridian) correlates linearly with cell number. (B) Representative images from droplets of the serial dilution.
Figure 3. Bioluminescence correlates with tumor volume in vivo.
(A) Varying numbers of B16-Fluc (firefly luciferase) cells were injected intravenously into the tail vein and the mice were imaged 30 min later to detect tumor cells in the lungs. Bioluminescent signal (photons per s per cm2 per steradian) correlates with cell number implanted. These mice were kept for 11 d and then imaged again on day 11. Lungs were then excised, homogenized, and total luciferase activity was determined with a standard ex vivo luciferase assay. (B) Total ex vivo luciferase activity correlates with day 11 bioluminescence in vivo. (C) After immunization with a live Listeria vaccine (see Fig 5), mice were challenged with 1 × 10⁴ B16-Fluc cells intravenously and then imaged 3 wks later to detect lung metastases. These lungs were then excised and ex vivo luciferase activity determined. Total ex vivo luciferase activity correlates with day 21 bioluminescence in vivo after immunization against the tumor.
Figure 4. Bioluminescence correlates with ex vivo visual assessment of tumor volume.
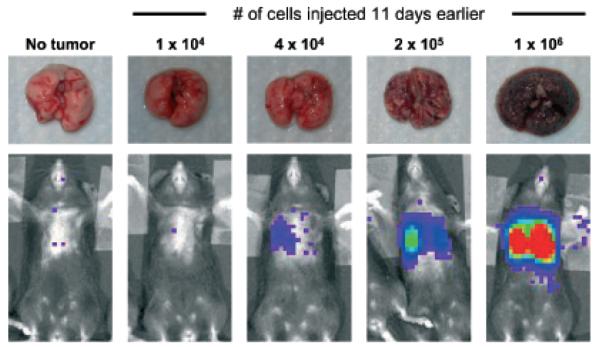
Mice were challenged with varying numbers of B16-Fluc (firefly luciferase) cells intravenously and imaged 11 d later to detect lung metastases. Example comparisons of bioluminescent signals with ex vivo visualization is demonstrated.
To determine the total tumor burden in the lungs, the lungs were homogenized and total luciferase activity was determined with luminometry of the cell lysate. The in vivo BLI measurements correlated well with the ex vivo total luciferase activity (Fig 3B, r2 = 0.98). Photon emission is attenuated exponentially through animal tissue making detection from the lungs more challenging. In similar pilot studies, we were able to detect as few as 500 B16-Fluc cells subcutaneously by BLI (not shown). Notably, this system is sensitive enough to detect growth of the B16-Fluc cells left in the needle track after intravenous injection into the tail vein for lung metastases three weeks earlier (Fig 1B). There were no palpable tumors in the area of tail involved (not shown).
As proof of principal, we utilized BLI methodology to measure systemic protection against melanoma tumor growth over time following immunotherapy with a live recombinant Listeria monocytogenes (rLM) vaccine expressing the melanoma antigen tyrosinase-related protein (TRP-2). Protection by this rLM vaccine against subcutaneous B16 tumor challenge with tumor burden assessed by standard caliper measurements is reported by our group elsewhere.2 After primary immunization and boost with either LM-NP (control listeria expressing only the viral epitope NP) or LM-TRP2-NP (active vaccine expressing both viral NP and TRP-2), mice were intravenously challenged with B16-Fluc cells 2 wk later. Mice were then imaged at various times post challenge. Day 15 measurements revealed relatively low bioluminescent signals in both groups (Fig 5A). By day 21, however, control LM-NP-immunized mice displayed a 10-fold higher luciferase signal in their lungs than LM-TRP2-NP-immunized mice (Fig 5A, B) (p<0.005). Similar results have been observed for subcutaneous tumor growth of B16-Fluc (not shown). Additionally, similar results are seen using B16 cells not expressing Fluc.2 These results demonstrate the ability of a live Listeria vaccine expressing the melanoma-associated antigen TRP-2 to protect mice from systemic challenge with the B16-Fluc melanoma cell line. Additionally, this study demonstrates that serial BLI provides a valuable tool for evaluating immunotherapeutic efficacy in mice repeatedly and quantitatively over time. As this technology becomes more widely available and the results are validated by others, BLI may offer a more sensitive and reproducible alternative to visual inspection as an assessment of lung tumor volume and therapies targeting melanoma metastasis in the B16 model.
Figure 5. Live Listeria vaccine expressing tyrosinase related protein-2 protects mice from systemic B16 melanoma challenge, as quantified by bioluminescent imaging.
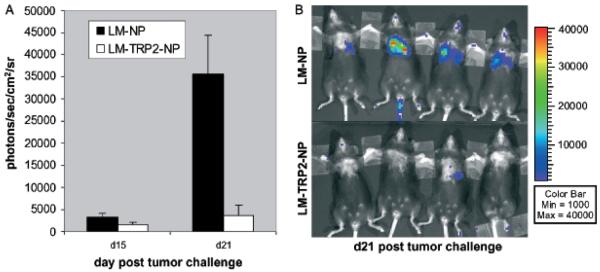
C57BL/6 mice were immunized and boosted with recombinant Listeria monocytogenes (rLM) expressing the LCMV NP396–404 epitope (LM-NP) or the NP396–404 epitope and the melanoma antigen TRP2180–188 epitope (LM-TRP2-NP) and challenged intravenously with 1 × 10⁴ B16-Fluc (firefly luciferase) cells 2 wk later. Tumor fluorescence from B16-Fluc tumors was quantified as described in methods at various time points. (A) Graph represents the mean of seven mice per group each compared to control growth on day 15 and day 21 (mean + SEM). On day 15, there was low signal from most mice and no significant difference between the groups. By day 21, however, large differences between the experimental and control groups can be seen. (p<0.005) (B) Representative images of mice are shown on day 21.
Since GFP and luciferase may represent neoantigens in the mouse (Gambotto et al, 2000; Murakami et al, 2003), it is possible that introduction of these reporter genes may lead to natural immunogenicity and rejection of B16-Fluc tumors. Other BLI tumor models, however, have not found a difference in tumor formation between parental lines and those expressing the reporter genes (Smakman et al, 2004). Based on several findings, it is unlikely that immunogenicity to these reporter genes is occurring to a significant degree in our model: (1) subcutaneous implantation of the B16-Fluc cell line leads to tumor formation at an equal or slightly faster rate than the parental cell line in prior experiments; (2) mice implanted with both cell lines became moribund at equal rates when the cells were implanted intracranially; and (3) in the absence of immunotherapy, no significant inflammatory infiltrate has been detected in B16-Fluc tumors histologically.
To further characterize the relationship between tumor burden and photon emission, we measured photon emission rates from 3-wk-old tumors that had been established in the lungs after mice were immunized with the live Listerial vaccine or control vaccine (see above). Although, there was slightly more variability, measuring rates of photon emission detected B16-Fluc cells in the lungs in vivo, we observed a high correlation (r2 = 0.89) with the amounts of total luciferase activity measured by traditional in vitro luminometer assays on homogenized tumor-bearing lungs (Fig 3C). These findings suggest that tumor therapies, whereas affecting the total tumor burden, do not affect the correlation of BLI measurements in this model with total tumor burden. Additionally, since the reaction that produces photons requires oxygen, ATP, luciferase, and the substrate d-luciferin, BLI detects only vascularized, viable tumor cells and thus accounts for necrotic or dying tumor regardless of the cause. As quickly growing tumors may, however, have areas of hypoxia where the tumor cells are still viable, BLI measurements could be influenced by the degree of tumor perfusion and oxygenation. Additionally, the sharp dependence of signal strength on tumor depth makes imaging in larger animals more challenging.
Intracranial tumor growth is particularly challenging to monitor in live animals given the confines of the skull. Thus, we extended our studies to the intracranial B16 model. B16-Fluc cells were implanted as described in methods and live mice were serially monitored with BLI over 3 wk. An example of intracranial tumor enlargement in a group of five mice over the 3 wk is shown (Fig 6). When mice are examined over the last week it is clear that animals with larger tumors, as measured by BLI, become moribund earlier than mice with smaller tumors. This was also reflected in their survival (data not shown). BLI has been used to study intracranial viral infections (Luker et al, 2002), and other intracranial tumors (Rehemtulla et al, 2000) but, this is an example of the ability to use BLI to monitor intracranial B16 murine melanoma tumors in live animals. Animal “survival” may represent multiple factors including tumor size, intracerebral inflammation, location of tumor, or confounding infections. Thus, BLI assessment of intracranial tumors may offer significant advantages for pure evaluation of intracranial tumor size when compared to animal survival.
Figure 6. Bioluminescent imaging to monitor intracranial tumor volume.

Mice were implanted into the striatum with 1 × 10³ B16 firefly luciferase (Fluc) cells in 2 μL PBS with a Hamilton syringe and imaged serially for 3 wk. Representative images are shown on days 8, 14, and 20. Note one mouse was euthanized from this group due to the development of neurological deficits prior to the day 20 image.
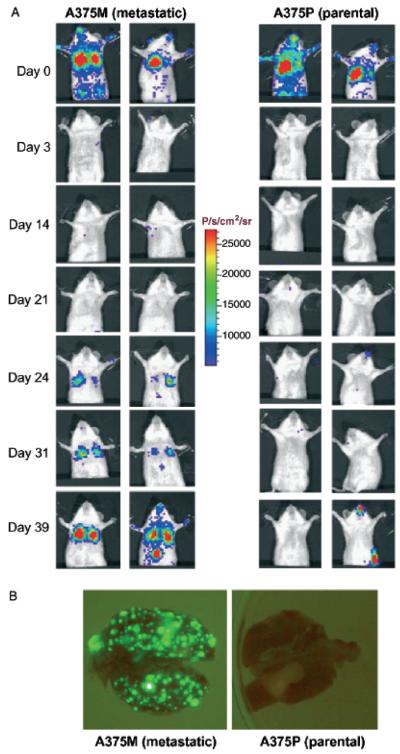
To extend these studies to another melanoma model, we transduced two clones of the human A375 melanoma cell line with a lentiviral construct expressing hRL in place of Fluc. A375, being a heterologous human tumor cell line must be grown in immunocompromised mice. Two sub-lines of A375 represent the parental cell line (A375P) and a highly metastatic sub-line (A375M) derived by serial passage of the tumor through tail vein injections and isolation of pulmonary metastases (Clark et al, 2000). Transduced cells were selected for high GFP expression by fluorescence activated cell sorting. High GFP-expressing populations were injected into the tail vein of SCID mice and serially imaged using BLI. Two representative mice are shown for each sub-line (Fig 7A). On day 0, 30 min after injection, most injected cells are trapped within the pulmonary capillaries and similar signals can be seen from the two sub-lines. On day 1, detectable signal is lost from the lungs showing clearance of almost all of the tumor cells injected. By day 24, it is clear that the metastatic variant of this cell line has formed more tumors in the lungs of these SCID mice. By day 31, a focus of tumor in the liver can be clearly identified in one mouse injected with the metastatic sub-line. In these A375 cell lines, the expression of GFP from the integrated lentiviral construct (hRL-IRES-GFP) is greater than in the B16 model (Fluc-IRES-GFP) (not shown). Because of the increased signal intensity, it is possible to visualize the tumor nodules on the lungs of these mice ex vivo using blue light illumination, GFP appropriate emission filters, and detection with a standard digital CCD camera. Increased metastatic foci are seen in the lungs excised from representative mice (from panel A) challenged with the metastatic sub-line, A375M compared with the parental line A375P (Fig 7B). The increased signal intensity on the flank of the A375P mouse on day 39, likely represents contamination with phosphorescent material. This is also seen on the snouts and forepaws of several animals. This signal may also represent an occult visceral or lymph node metastasis, but this could not be confirmed visually at necropsy. These signals however, do not affect the tumor evaluation in the lungs since flux calculations are limited to a region of interest drawn over the lungs using the imaging software.
Figure 7. Bioluminescent imaging of metastatic differences in clones of human melanoma in severe combined immunodeficiency mice (SCID) mice.
SCID mice were challenged with 1.2 × 10⁶ A375 parental (A375P) or A375 metastatic clone (A375M) cells intravenously and serially imaged. (A) Representative examples of these mice are shown throughout the experiment. Minutes after tumor challenge, similar numbers of cells are seen in the lungs and circulatory systems of these mice. By day 3, both lines are undetectable. In the highly metastatic line, detectable tumors arise in the lungs after 3 weeks. (B) This difference is corroberrated at necropsy by visualization of the green fluorescent protein expressing tumor nodules in the lungs, where the highly metastatic line A375M has formed a far greater number of lung metastases than the parental line A375P.
One area of potential application is to use hRL and Fluc in the same cells. This would overcome the barriers of having to use other colors for monitoring with shorter wavelengths, which are more easily absorbed by tissue. Renilla has a shorter wavelength than Fluc, so is better to use if the object of interest is on the surface of the animal. Additionally, the renilla substrate has a shorter half-life. Thus, one can measure both renilla and Fluc in the same animal in the same tumor at times very close to one another.
These results suggest that BLI technology may be useful in multiple human and murine tumor models. Although the existing models of B16 metastasis do not reflect all of the naturally occurring steps of true metastasis, they provide useful methods to assess effects of therapies on systemic melanoma burden and intracranial tumors. The addition of BLI to these models will be useful for studies that are immunologically based, therapies targeting tumors directly, or studies investigating metastatic mechanisms of melanoma cells in immunocompromised mice with human tumors. Although this technology requires a sophisticated imaging system, the overall advantages of BLI combined with the benefits of decreased animal and husbandry costs may outweigh the initial financial setback of purchase.
Materials and Methods
Bacterial and mouse strains
Female C57Bl/6 (H-2b MHC) mice were purchased from Jackson Laboratories (Bar Harbor, Maine) and were between 6 and 10 wk and age-matched before initiation of experiments. Beige SCID were used for studies involving the A375 human melanoma line. Listeria monocytogenes 10403S (LM) (Baldridge et al, 1988) (serotype 1/2a, obtained from David Hinrichs, Veterans Affairs Medical Center, Portland, Oregon, via Daniel Portnoy) was the virulent parental bacterial strain used for all recombinant constructs, and was grown and maintained in brain–heart infusion (BHI) broth or on agar plates with streptomycin (200 μg per mL) selection. Recombinant LM strains LM-NP and LM-TRP2-NP expressing the LCMV NP396–404 epitope (both strains) and TRP2180–188 (only LM-TRP2-NP) under control of the LM hly listeria promoter and containing the hly signal sequence were created as previously described.2
Immunization of mice
C57Bl/6 mice (6–10 wk old) were inoculated in the tail vein with 0.1 LD50 of each rLM strain (see Fig 1) in 200 μL of phosphate-buffered saline (PBS), using 28 gauge needles. Boosting immunizations were given 2–3 wk later, at a dose of 1.0 LD50. All studies were carried out with the approval of the UCLA Animal Research Committee (ARC).
Cell lines
The B16 murine melanoma cell line was obtained from the ATCC (Rockville, Maryland) and maintained in Dulbecco's modified Eagle's medium (DMEM) with 10% fetal calf serum (FCS), Pen/Strep and l-glutamine. Prior to tumor challenge, B16 cells were grown in supplemented DMEM, harvested, washed three times, and resuspended in PBS. The A375 parental cell (A375P) line was maintained in DMEM with 10% FCS, Pen/Strep and l-glutamine. The A375 metastatic cell line (A375M) was derived by three serial passages consisting of mouse tail vein injection and isolation of pulmonary metastases as described (Clark et al, 2000).
Statistical analysis
All error bars represent standard error of the mean unless otherwise designated. Significant differences of tumor growth were assessed by Student's t test. The difference between groups was considered statistically significant when the p value was lower than 0.05.
Optical imaging of bioluminescent tumors and in vitro luciferase assay
B16 tumor cells were transduced with a lentiviral construct containing the Fluc gene and the GFP gene, separated by an encephalomyocarditis virus internal ribosomal entry site, and driven by an internal CMV promoter. Stable cell lines were selected by flow cytometry sorting for cells with high levels of GFP expression. We refer to the stable luciferase-expressing cell line used as B16-Fluc. Growth rates of B16-Fluc both in vitro and in vivo were similar to those of parental B16 cells.
The A375P and A375M cell lines were transduced with a lentiviral construct containing the hRL gene and the GFP gene, separated by an encephalomyocarditis virus internal ribosomal entry site, and driven by an internal CMV promoter. Stable cell lines were selected by flow cytometry sorting for cells with high levels of GFP expression.
For intravenous challenges, cells were washed and resuspended in PBS at various concentrations and 200 μL were injected via the tail vein. The standard B16-Fluc tumor challenge dose for immunotherapy experiments is 1–2 × 10⁴ cells. 1.2 × 10⁶ A375P or A375M cells were injected for comparison metastasis studies. For subcutaneous tumors, cells were resuspended at various concentrations in PBS and diluted 1:1 with Matrigel (BD Biosciences, Bedford, Massachusetts). After anesthesia, mice were injected subcutaneously into the shaved flank with 100 μL of this mixture using a 28 guage needle. The standard tumor challenge dose is 1 × 10⁴ cells. For intracranial implantation, mice were anesthetized with ketamine:xylazine and 1 × 10³ cells in a volume of 2 μL PBS were implanted into the striatum as previously described (Prins et al, 2004) using a Hamilton syringe.
Prior to imaging, mice were anesthetized with a cocktail of ketamine:xylazine (4:1) in PBS. For B16 cells expressing Fluc, mice were injected intraperitoneally with 100 μL of 30 mg per mL of the luciferase substrate, d-luciferin (Xenogen) in PBS, and shaved over the tumor site to minimize the amount of light absorbed by black fur and imaged after 10–15 min. For A375 cells expressing hRL, mice were injected via the tail vein with 10 μL (2 μg per μL dissolved in methanol) of coelenterazine (Biotium, Hayward, California) diluted with 90 μL PBS (pH 7). The mice were then placed in a light tight chamber and a cooled CCD camera apparatus (IVIS, Xenogen) was used to detect photon emission from tumor-bearing mice with acquisition times ranging from 1 s to 2 min. Analyses of the images were performed as described previously (Wu et al, 2001; De et al, 2003) using Living Image software (Xenogen) and Igor Image analysis software (Wave Metrics, Lake Oswego, Oregon) by drawing regions of interest over the tumor region and obtaining maximum values in photons per second per cm2 per steradian or total flux as photons per second.
Ex vivo GFP expressing lung tumors were visualized within 30 min using blue light excitation and GFP appropriate emission filters. Photographs were taken with a standard CCD camera (Nikon Coolpix 4500, Nikon, Melville, New York).
In vitro luciferase activity was determined by homogenization of the lung tissue through nylon mesh and freeze–thaw lysis in buffer provided with the luciferase kit (Promega, Madison, Wisconsin). Samples were combined with d-luciferin substrate as directed in the product instructions and relative light units determined in a bench top luminometer.
Acknowledgments
Supported in part by NIH grant RO1 CA84008-01 (J. F. M.), USPHS National Research Service Award GM07104 (K. W. B.), Dermatology Foundation, Dermatologist Investigator Research Fellowship and Clinical and Fundamental Immunology Training Grant NIH/NIAID 5 T32 A1007126-27 (N. C.), SAIRP R24 CA92865 (S. S. G.), and Department of Energy Contract DE-FC03-87ER60615 (S. S. G.).
Abbreviations
- BLI
bioluminescent imaging
- CCD
charge-coupled device
- Fluc
firefly luciferase
- GFP
green fluorescence protein
- hRL
renilla luciferase
- LM
Listeria monocytogenes
- TRP-2
tyrosinase-related protein-2
Footnotes
N. Craft et al, The toll-like receptor 7 agonist imiquimod enhances the anti-melanoma effects of a recombinant Listeria manocytogenes vaccine. Manuscript submitted.
References
- Baldridge JR, Thomashow MF, Hinrichs DJ. Induction of immunity with avirulent Listeria monocytogenes 19113 depends on bacterial replication. Infect Immun. 1988;56:2109–2113. doi: 10.1128/iai.56.8.2109-2113.1988. [DOI] [PMC free article] [PubMed] [Google Scholar]
- Bruhn KW, Craft N, Nguyen BD, Yip J, Bouwer A, Miller JF. Vaccine. Characterization of anti-self CD8 T cell responses stimulated by recombinant listeria monocytogenes expressing the melanoma antigen TRP-2. in press. [DOI] [PubMed] [Google Scholar]
- Chin L, Tam A, Pomerantz J, et al. Essential role for oncogenic Ras in tumour maintenance. Nature. 1999;400:468–472. doi: 10.1038/22788. [DOI] [PubMed] [Google Scholar]
- Clark EA, Golub TR, Lander ES, Hynes RO. Genomic analysis of metastasis reveals an essential role for RhoC. Nature. 2000;406:532–535. doi: 10.1038/35020106. [DOI] [PubMed] [Google Scholar]
- Collisson EA, De A, Suzuki H, Gambhir SS, Kolodney MS. Treatment of meta-static melanoma with an orally available inhibitor of the Ras–Raf–MAPK cascade. Cancer Res. 2003a;63:5669–5673. [PubMed] [Google Scholar]
- Collisson EA, Kleer C, Wu M, De A, Gambhir SS, Merajver SD, Kolodney MS. Atorvastatin prevents RhoC isoprenylation, invasion, and metastasis in human melanoma cells. Mol Cancer Ther. 2003b;2:941–948. [PMC free article] [PubMed] [Google Scholar]
- Contag CH, Ross BD. It's not just about anatomy: In vivo bioluminescence imaging as an eyepiece into biology. J Magn Reson Imaging. 2002;16:378–387. doi: 10.1002/jmri.10178. [DOI] [PubMed] [Google Scholar]
- De A, Lewis XZ, Gambhir SS. Noninvasive imaging of lentiviral-mediated reporter gene expression in living mice. Mol Ther. 2003;7:681–691. doi: 10.1016/s1525-0016(03)00070-4. [DOI] [PMC free article] [PubMed] [Google Scholar]
- Gambotto A, Dworacki G, Cicinnati V, et al. Immunogenicity of enhanced green fluorescent protein (EGFP) in BALB/c mice: Identification of an H2-Kd-restricted CTL epitope. Gene Ther. 2000;7:2036–2040. doi: 10.1038/sj.gt.3301335. [DOI] [PubMed] [Google Scholar]
- Hollingshead MG, Bonomi CA, Borgel SD, Carter JP, Shoemaker R, Melillo G, Sausville EA. A potential role for imaging technology in anticancer efficacy evaluations. Eur J Cancer. 2004;40:890–898. doi: 10.1016/j.ejca.2003.12.018. [DOI] [PubMed] [Google Scholar]
- Luker GD, Bardill JP, Prior JL, Pica CM, Piwnica-Worms D, Leib DA. Noninvasive bioluminescence imaging of herpes simplex virus type 1 infection and therapy in living mice. J Virol. 2002;76:12149–12161. doi: 10.1128/JVI.76.23.12149-12161.2002. [DOI] [PMC free article] [PubMed] [Google Scholar]
- Murakami T, Cardones AR, Finkelstein SE, et al. Immune evasion by murine melanoma mediated through CC chemokine receptor-10. J Exp Med. 2003;198:1337–1347. doi: 10.1084/jem.20030593. [DOI] [PMC free article] [PubMed] [Google Scholar]
- Palamara F, Meindl S, Holcmann M, Luhrs P, Stingl G, Sibilia M. Identification and characterization of pDC-like cells in normal mouse skin and melanomas treated with imiquimod. J Immunol. 2004;173:3051–3061. doi: 10.4049/jimmunol.173.5.3051. [DOI] [PubMed] [Google Scholar]
- Prins RM, Incardona F, Lau R, et al. Characterization of defective CD4-CD8-T cells in murine tumors generated independent of antigen specificity. J Immunol. 2004;172:1602–1611. doi: 10.4049/jimmunol.172.3.1602. [DOI] [PubMed] [Google Scholar]
- Ray P, De A, Min JJ, Tsien RY, Gambhir SS. Imaging tri-fusion multimodality reporter gene expression in living subjects. Cancer Res. 2004;64:1323–1330. doi: 10.1158/0008-5472.can-03-1816. [DOI] [PMC free article] [PubMed] [Google Scholar]
- Rehemtulla A, Stegman LD, Cardozo SJ, Gupta S, Hall DE, Contag CH, Ross BD. Rapid and quantitative assessment of cancer treatment response using in vivo bioluminescence imaging. Neoplasia. 2000;2:491–495. doi: 10.1038/sj.neo.7900121. [DOI] [PMC free article] [PubMed] [Google Scholar]
- Smakman N, Martens A, Kranenburg O, Borel R. Validation of bioluminescence imaging of colorectal liver metastases in the mouse. J Surg Res. 2004;122:225–230. doi: 10.1016/j.jss.2004.05.021. [DOI] [PubMed] [Google Scholar]
- Wu JC, Sundaresan G, Iyer M, Gambhir SS. Noninvasive optical imaging of firefly luciferase reporter gene expression in skeletal muscles of living mice. Mol Ther. 2001;4:297–306. doi: 10.1006/mthe.2001.0460. [DOI] [PubMed] [Google Scholar]


