Abstract
Background
This study examines the quantitative accuracy, detection sensitivity, and time course of imaging the expression of a mutant herpes simplex type-1 virus thymidine kinase (HSV1-sr39tk) PET reporter gene in rat myocardium by using the PET reporter probe 9-(4-[18F]-Fluoro-3-Hydroxymethylbutyl)-Guanine ([18F]-FHBG) and a small-animal PET (microPET).
Methods and Results
In 40 rats, adenovirus expressing HSV1-sr39tk driven by a cytomegalovirus promoter (Ad-CMV-HSV1-sr39tk, 1×10⁶ to 1×10⁹ pfu) was injected through a thoracotomy directly into the left ventricular myocardium. After 3 days, myocardial perfusion was imaged with [13N]-ammonia for delineating the left ventricular myocardium, followed by imaging the expression of the reporter gene with intravenous [18F]-FHBG. The total myocardial [18F]-FHBG accumulation was quantified in percent of injected dose (%ID). Immunohistochemistry and autoradiography demonstrated HSV1-sr39tk enzyme (HSV1-sr39TK) and accumulation of [18F]-FHBG in the inoculated myocardium in 3 rats each. In 24 rats with various viral titers, the %ID was correlated with ex vivo well counting (r2=0.981, P<0.0001) and myocardial HSV1-sr39TK activity by tissue enzyme activity assay (r2=0.790, P<0.0001). Myocardial [18F]-FHBG accumulation was identified at viral titers down to 1×10⁷ pfu. In 6 rats serially imaged up to day 17, myocardial [18F]-FHBG accumulation on microPET peaked on days 3 to 5 and was no longer identified on days 10 to 17.
Conclusions
HSV1-sr39tk reporter gene expression can be monitored with [18F]-FHBG and microPET in rat myocardium quantitatively and serially with high detection sensitivity. Cardiac PET reporter gene imaging offers the potential of monitoring the expression of therapeutic genes in cardiac gene therapy.
Keywords: nuclear medicine, imaging, genes, myocardium, gene therapy
Diseases of the heart are relative “newcomers” as targets for gene therapy compared with cancer or monogenic disorders. Nonetheless, cardiac gene therapy holds considerable promise. This is mainly because (1) catheter-mediated intramyocardial injection of vector allows local targeted gene delivery, (2) coxsackie-adenovirus receptors on cardiomyocytes result in efficient uptake of adenovirus vector, and (3) transient expression of the therapeutic gene may be sufficient in some cardiovascular disorders to achieve therapeutic benefits.1 About 20 clinical trials on cardiac gene therapy are currently in progress.2 However, no consensus exists on how best to evaluate its efficacy. If cardiac gene therapy is to become a routine clinical strategy, development of an accurate, noninvasive quantitative method for evaluating transfer and expression of therapeutic genes in the myocardium will be important.
Reporter genes linked to therapeutic genes that encode proteins for intracellular trapping of systemically administered reporter probes enable external monitoring of the expression of the therapeutic gene. With a dedicated, small-animal positron emission tomograph (microPET),3 noninvasive imaging of PET reporter genes combined with PET reporter probes affords in rodents determination of the location, magnitude and time course of the gene expression.4–6 We recently reported on the feasibility of quantitative micro-PET imaging of rat myocardium7 and of imaging the expression of a PET reporter gene in rat myocardium.6 A mutant herpes simplex type-1 virus thymidine kinase (HSV1-sr39tk) served as PET reporter gene and 9-(4-[18F]-Fluoro-3-Hydroxymethylbutyl)-Guanine ([18F]-FHBG) as PET reporter probe. This combination offers improved imaging sensitivity.5 However, accuracy, sensitivity, and time course of imaging the expression of the PET reporter probe remain undetermined. Therefore, the present study explores the accuracy, detection sensitivity, and time course of imaging the expression of HSV1-sr39tk in rat myocardium with [ 18F]-FHBG and microPET.
Methods
Study Design
Forty-three male Sprague-Dawley rats (304±56 g, Harlan, Indianapolis, Ind) were studied. In 40 rats, adenovirus carrying HSV1-sr39tk driven by a cytomegalovirus promoter (Ad-CMV-HSV1-sr39tk, 1×10⁶ to 1×10⁹ pfu) was injected through a thoracotomy directly into the left ventricular (LV) myocardium. Three control rats were similarly injected with Ad-CMV-Firefly luciferase (Ad-CMV-Fluc, 1×10⁹ pfu). After 3 days, myocardial perfusion was imaged with [13N]-ammonia for delineating the LV myocardium followed by imaging the expression of the reporter gene with [18F]-FHBG, and the total myocardial [18F]-FHBG accumulation was quantified in percent of injected dose (%ID).
Immunohistochemistry and digital autoradiography were performed after microPET imaging in 3 rats each with Ad-CMV-HSV1-sr39tk to demonstrate in transfected myocardium the HSV1-sr39tk enzyme (HSV1-sr39TK) and accumulation of [18F]-FHBG. In 24 rats with various viral titers of Ad-CMV-HSV1-sr39tk, the %ID calculated from microPET images was compared with that from ex vivo well counting and with the myocardial HSV1-sr39TK activity by tissue enzyme activity assay to validate the quantitative accuracy of %ID. The regional myocardial [18F]-FHBG accumulation in the same 24 rats was also analyzed visually to determine the lowest viral titer needed for imaging gene expression and for assessing the detection sensitivity in %ID of myocardial [18F]-FHBG accumulation. The time course of myocardial and hepatic [18F]-FHBG accumulation was examined in 6 rats with Ad-CMV-HSV1-sr39tk by serial microPET imaging up to day 17 after transfection. The study design is summarized in the Table.
Table.
Summary of Study Design
| Study Type | Injected Virus | Viral Titer, pfu | No. of Rats | Studies Performed |
|---|---|---|---|---|
| Control study | Ad-CMV-Fluc | 1×10⁹ | 3 | MicroPET (3) |
| Immunohistochemistry | Ad-CMV-HSV1-sr39tk | 1×10⁹ | 3 | MicroPET (3), Immunohistochemistry |
| Digital autoradiography | Ad-CMV-HSV1-sr39tk | 1×10⁹ | 3 | MicroPET (3), Digital autoradiography |
| Quantitative accuracy and detection sensitivity | Ad-CMV-HSV1-sr39tk | 1×10⁹ | 6 | MicroPET (3), Well counting, TK assay |
| Ad-CMV-HSV1-sr39tk | 1×10⁸ | 6 | MicroPET (3), Well counting, TK assay | |
| Ad-CMV-HSV1-sr39tk | 1×10⁷ | 6 | MicroPET (3), Well counting, TK assay | |
| Ad-CMV-HSV1-sr39tk | 1×10⁶ | 6 | MicroPET (3), Well counting, TK assay | |
| Time course | Ad-CMV-HSV1-sr39tk | 1×10⁹ | 6 | MicroPET (3, 5, 7, 10, 12, 14, and 17) |
Number(s) in parentheses after “MicroPET” show the scanned day(s) after transfection. TK assay indicates tissue enzyme activity assay for HSV1-sr39TK.
This study was approved by the University of California Los Angeles Animal Research Committee and performed in accordance with National Institutes of Health (NIH) Guidelines for the Care and Use of Laboratory Animals and NIH Guidelines for Research Involving Recombinant DNA Molecules.
Radiolabeled Compounds
[13N]-ammonia and [18F]-FHBG were produced as described previously.8,9
Recombinant Adenoviruses
HSV1-sr39tk is a PET reporter gene, which leads to phosphorylation and consequent accumulation of [18F]-FHBG in tissues expressing HSV1-sr39tk.5 Fluc is a reporter gene for optical imaging.10 E1-deleted, replication-defective recombinant Ad-CMV-HSV1-sr39tk and Ad-CMV-Fluc were constructed and purified as described previously.5,10
Animal Preparation
Rats were anesthetized with sodium pentobarbital (50 mg/kg IP) and received atropine sulfate (0.04 mg/kg IM) for prevention of brady-cardia and reduction of tracheal secretions, warm normal saline solution (10 mL/kg SC) for volume replacement, banamine (2.5 mg/kg SC) for pain relief, and baytril (25 mg/kg SC) for prevention of infection. After a left thoracotomy at the 4th intercostal space under positive-pressure mechanical ventilation, the recombinant adenovirus was injected at 2 to 3 sites into the mid-LV anterolateral wall with the use of a 30-gauge needle containing 30 to 50 μL of viral volume. The chest was closed, with negative pressure applied to the chest cavity by a thin, sterile tube connected to a syringe to prevent pneumothorax. Except for 4 rats that died during surgery and were excluded from analysis, the animals recovered uneventfully and were studied with microPET 3 days later. Surgical procedures were performed under aseptic conditions in a biocontainment facility.6
MicroPET Imaging
MicroPET System
The UCLA microPET, a dedicated small-animal PET system with an 11.75-cm transverse and 1.8-cm axial field-of-view (FOV) was used.3 Random coincidence counts and dead-time losses were corrected for automatically.7
Acquisition Protocol
Rats were anesthetized with sodium pentobarbital (50 mg/kg IP). After intravenous injection of [13N]-ammonia (83.1±17.0 MBq), a scout image of myocardial perfusion was first obtained for 4 minutes and immediately reconstructed with filtered back-projection (FBP) algorithms to confirm adequate positioning of the heart in the scanner's FOV. The heart was repositioned into the FOV if necessary, and myocardial perfusion images were obtained from 10 to 20 minutes after [13N]-ammonia injection. With the animal kept in exactly the same position, [18F]-FHBG (56.5±22.9 MBq) was injected intravenously, and images of [18F]-FHBG accumulation were acquired from 30 to 60 minutes later.
Image Reconstruction
MicroPET image data were reconstructed by using statistical maximum a posteriori probability (MAP) algorithms with a smoothing parameter of 1.0 and a total of 20 iterations into 24 transaxial images on a SPARC Ultra 1 workstation (Sun Microsystems). The reconstructed images were consistent with 128×128 image matrixes of 0.40×0.40-mm pixel size and 0.75-mm slice thickness; the spatial resolution is 1.4 mm full-width at half-maximum (FWHM). Photon attenuation was corrected as described previously.11
Image Display
To define the site of [18F]-FHBG accumulation, color-coded transaxial [18F]-FHBG images were superimposed on inverted gray-scaled [13N]-ammonia myocardial perfusion images and reoriented into short-axis images. The reorientation parameters were the same as used for the [13N]-ammonia images. Polar maps were reconstructed from the maximum activity profiles of the 15 contiguous short-axis cuts, including the apex, using standard clinical PET software.7
Quantitative Analysis
Cross-calibration for conversion of counts per minute to MBq was performed with a cylindrical phantom with a diameter of 35 mm filled with an 18F solution of known activity concentration. Guided by the [13N]-ammonia images, circular, 1-cm diameter regions of interest (ROI) were placed over the entire LV (ROILV) on 12 [18F]-FHBG transaxial images of the mid-LV portion. Background activity was similarly estimated from 12 ROIs of the same size (ROIBG) assigned to the right lung on the same 12 slices.12 The total myocardial accumulation of [18F]-FHBG was corrected for background activity in each ROI, summed for the 12 slices, and expressed as %ID: %ID (%)=[total activity in 12 ROIsLV(MBq)–total activity in 12 ROIsBG (MBq)]/injected dose (MBq)×100.
Accumulation of [18F]-FHBG in the liver was also determined from microPET images by placing a ROI to the liver (ROILIVER), partially visualized on transaxial [18F]-FHBG images for the heart, and expressed as %ID per gram of liver (specific gravity of 1): %ID/g liver (%/g)=mean activity in ROILIVER (MBq/g)/injected dose (MBq)×100.
Immunohistochemistry
Rats were killed immediately after the microPET imaging, and the hearts were rapidly dissected and fixed in 10% formalin. Heart sections were prepared at 10-μm thickness perpendicular to the LV axis with a cryomicrotome (Leica) and placed on glass slides coated with Vectabond (Vector Laboratory). Each tissue was hydrated with PBS and preincubated at room temperature with 5% horse serum for 60 minutes to prevent nonspecific accumulation. After removal of horse serum, sections were incubated with rabbit anti-thymidine kinase antibody13 (courtesy of M.E. Black, University of Washington, Seattle, Wash) at 1/1000 dilution at room temperature for 60 minutes, washed with 3 rinses of PBS for 5 minutes each, and air-dried. Sections were then incubated with fluorescein anti-rabbit IgG antibody (Vector Laboratory) at 1/200 dilution at room temperature for 60 minutes and rinsed in 3 successive PBS washes before glycerol mount and cover slipping. Immunofluorescent images were visualized with UV-excitation by a Nikon Optiphot microscope (Nikon).
Digital Autoradiography
Rats were killed immediately after the microPET imaging and rapidly frozen with liquid nitrogen. The excised chest was embedded in 5% carboxymethylcellulose (Sigma Aldrich). The block was equilibrated with liquid nitrogen and sectioned in transaxial cuts with a slice thickness of 45 μm, using a PMV cryomicrotome. The cryosections were exposed directly onto digital plates for up to 12 hours. All digital plates were scanned on a Fuji Bas 5000 digital autoradiographic system (Fuji photo film) at a resolution of 25 μm.5
Gamma Well Counting
Rats were killed immediately after microPET imaging, and the hearts were rapidly dissected, rinsed from blood, weighed, and counted for 18F radioactivity in a gamma well counter (Cobra II Auto-Gamma, Packard). The total myocardial accumulation of [18F]-FHBG was expressed as %ID.
Tissue Enzyme Activity Assay for HSV1-sr39TK
Myocardial HSV1-sr39TK activity was determined as described previously.5 Results are expressed as percent conversion of 8-3HPCV in (dpm/μg protein per minute of tissue extract)/(dpm of control sample)×100.
Statistical Analysis
Mean values are given with standard deviations. One-way ANOVA was used for statistical analyses among 4 groups with different viral titers, and Fisher's PLSD for following post hoc tests. Receiver operating characteristics (ROC) curve analysis was used for visual detection of myocardial [18F]-FHBG accumulation. Linear and nonlinear correlation and nonparametric Spearman's correlation coefficient were applied to the relation between %ID calculated from [18F]-FHBG microPET images and that from well counting or myocardial HSV1-sr39TK activity. Probability values <0.05 were considered statistically significant.
Results
Quality of MicroPET Images
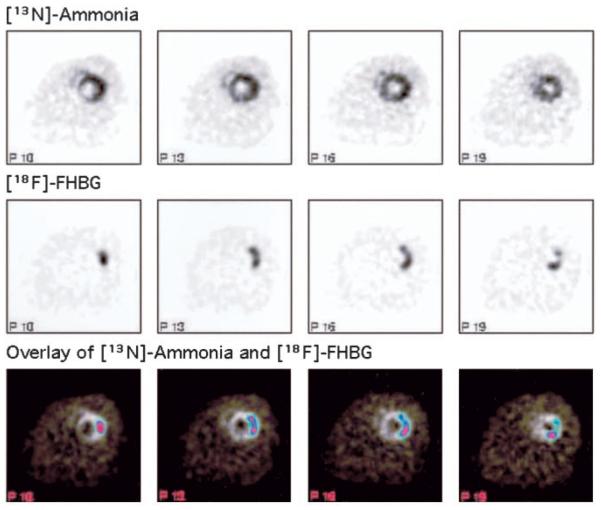
The left and right ventricular myocardium was clearly visualized on [13N]-ammonia microPET images in all animals. Localized tracer accumulation was detected on [18F]-FHBG images in rats injected with Ad-CMV-HSV1-sr39tk; its location in the LV anterolateral wall was verified through superimposition on the [13N]-ammonia images (Figure 1). Moreover, short-axis images and polar map displays allowed improved localization of the myocardial [18F]-FHBG accumulation and of its extent and distribution (Figure 2).
Figure 1.
Transaxial [13N]-ammonia microPET images, [18F]-FHBG microPET images at the same slice levels, and [18F]-FHBG images superimposed on [13N]-ammonia images (overlay) from a representative rat. Left, Cranial side; right, caudal side.
Figure 2.
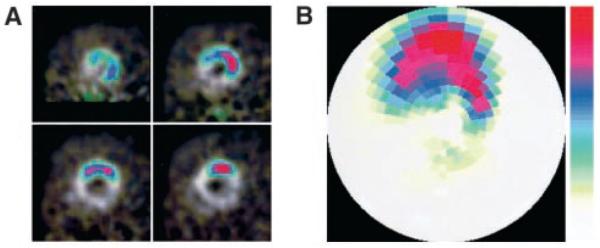
A, Reoriented short-axis images of overlay images shown in Figure 1. Upper left, basal; upper right, mid-basal; lower left, mid-apical; and lower right, apical slices. B, Polar map display of [18F]-FHBG microPET images from the same rat. Note that the top of both short-axis images and polar map indicates anterolateral wall in rats.
Control Study
In 3 control rats injected with Ad-CMV-Fluc, no retention of [18F]-FHBG was noted on the microPET images. This effectively excluded nonspecific [18F]-FHBG accumulation in myocardium inoculated with a control transgene. Further, estimates of the %ID of myocardial [18F]-FHBG accumulation in the control rats averaged 0.000±0.003% and thus approached zero, supporting the validity of the approach used for correction of background activity.
Immunohistochemistry
Immunohistochemistry in 3 rats revealed HSV1-sr39TK activity in the inoculated anterolateral but little if any in the inferior and posterior walls and the septum. No inflammatory response such as increased leukocytic infiltration was observed microscopically (Figure 3).
Figure 3.
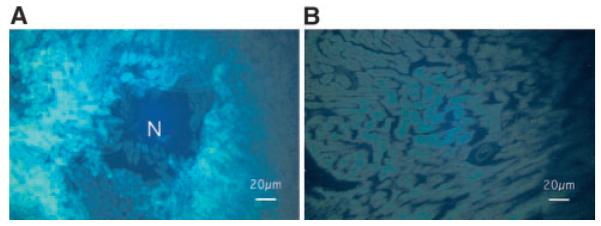
Immunohistochemistry for HSV1-sr39TK (A) at the inoculated anterolateral wall and (B) at the nontransfected septum. HSV1-sr39TK is clearly stained with fluorescence (bright areas) in cardiomyocytes surrounding a needle track for the virus injection (shown as N) at the anterolateral wall, whereas little staining is noted at the septum.
Digital Autoradiography
Digital autoradiography revealed [18F]-FHBG accumulation in the inoculated anterolateral wall of all 3 rats. The myocardial distribution of [18F]-FHBG accumulation as demonstrated on the autoradiographs was similar to that seen on the microPET images obtained in the same animals (Figure 4).
Figure 4.
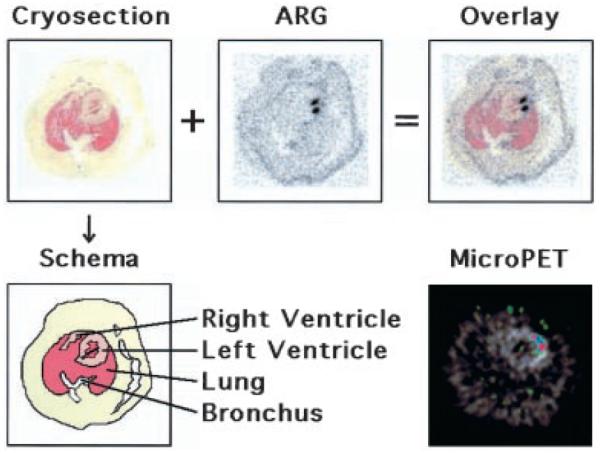
Top, Transaxial cryosection, digital autoradiograph (ARG), and digital autoradiograph superimposed on cryosection (overlay) of a representative rat. Bottom, Schema of the cryosection and transaxial [18F]-FHBG microPET image superimposed on [13N]-ammonia image at the corresponding slice level of the same rat. Two radioactive foci are clearly identified on the autoradiograph, which also can be recognized on the microPET image.
Quantitative Accuracy for [18F]-FHBG MicroPET Imaging
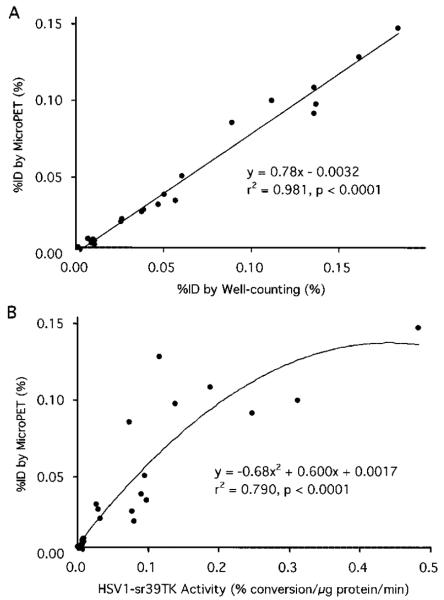
The %ID for myocardial [18F]-FHBG accumulation determined in vivo from microPET images was highly correlated with that determined postmortem by well counting. The %ID also significantly correlated with the myocardial HSV1-sr39TK activity, although not as closely as with well-counted activity (Figure 5).
Figure 5.
A, Correlation between %ID for myocardial [18F]-FHBG accumulation calculated from microPET images and that from ex vivo well counting. B, Correlation between %ID for myocardial [18F]-FHBG accumulation calculated from microPET images and HSV1-sr39TK activity.
Detection Sensitivity for HSV1-sr39tk Gene Expression
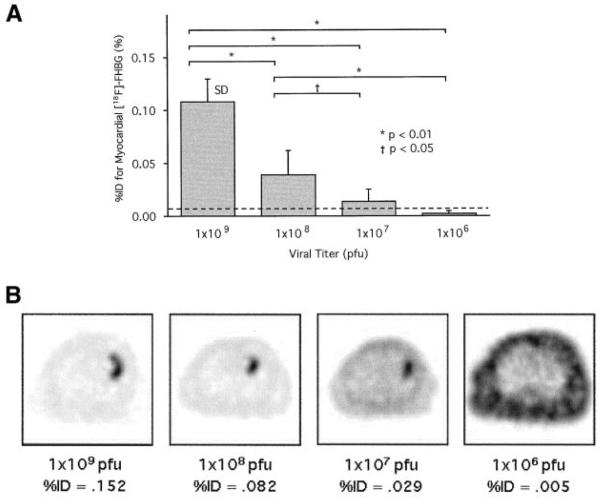
Myocardial [18F]-FHBG accumulation was visually identified in all rats at viral titers of 1×10⁹ and 1×10⁸ pfu and in 4 of 6 rats at titers of 1×10⁷ pfu but in none at titers of 1×10⁶ pfu. ROC curve analysis suggests a cutoff %ID value of 0.006% for visually identifiable myocardial [18F]-FHBG accumulation (Figure 6).
Figure 6.
A, Comparison in %ID for myocardial [18F]-FHBG accumulation calculated from microPET images among rats injected with different viral titers (n=6 for each viral titer). Broken line indicates cutoff %ID value for visually identifiable [18F]-FHBG accumulation. B, Trans-axial [18F]-FHBG microPET images of representative rats with different viral titers. Gray scale is normalized to individual peak activity of each image. Localized myocardial [18F]-FHBG accumulation is visualized with viral titers down to 1×10⁷ pfu but not with 1×10⁶ pfu.
Time Course of HSV1-sr39tk Gene Expression
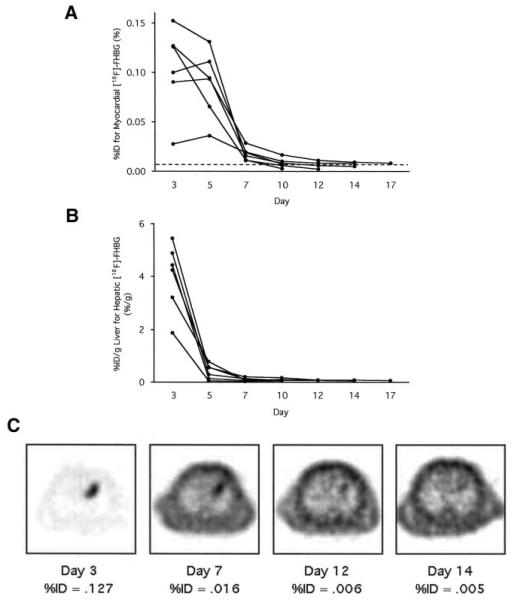
Serial imaging demonstrated myocardial [18F]-FHBG accumulation on days 3 and 5, less on day 7, and no longer on days 10 to 17. Significant [18F]-FHBG uptake was observed in the liver on day 3 but had declined on day 5 (Figure 7).
Figure 7.
A, Time course of %ID for myocardial [18F]-FHBG accumulation calculated from microPET images serially scanned with 6 rats. Broken line indicates cutoff %ID value for visually identifiable [18F]-FHBG accumulation. B, Time course of %ID/g liver for hepatic [18F]-FHBG accumulation calculated from microPET images in the same 6 rats. C, Transaxial [18F]-FHBG microPET images at similar slice levels of a representative rat scanned serially. Gray scale is normalized to the individual peak activity of each image. In this rat, we judged that localized myocardial [18F]-FHBG accumulation was visualized up to day 12 and no longer on day 14.
Discussion
In rats after intramyocardial injection of Ad-CMV-HSV1-sr39tk, [18F]-FHBG microPET images demonstrated the PET reporter gene expression in the inoculated myocardium as delineated by [13N]-ammonia perfusion imaging and polar map displays. Absence of detectable [18F]-FHBG accumulation in the myocardium of control animals inoculated with Ad-CMV-Fluc indicates that [18F]-FHBG accumulation was specific to the expressed reporter gene. Immunohistochemistry and digital autoradiography confirmed the expression of the enzyme induced by the PET reporter gene and accumulation of the PET reporter probe in the inoculated myocardium. The close correlation of %ID for total myocardial [18F]-FHBG accumulation derived in vivo by microPET with that by ex vivo well counting and tissue HSV1-sr39TK activity indicates that tracer activity concentrations can be accurately and noninvasively measured with microPET. The sensitivity study using various viral titers showed high detectability of the gene expression; serial imaging revealed the persistence of gene expression for about 1 to 2 weeks after transfection.
Correlation in Quantitative Accuracy Study
The %ID for myocardial [18F]-FHBG accumulation determined by microPET was highly correlated with that by well counting. This close correlation was maintained even when data from only 12 rats with 1×10⁸ and 1×10⁹ pfu of viral titers and thus with a more suitable range for reporter gene expression imaging were analyzed (y=0.78×−0.0036, r2=0.957, P<0.0001). The less-than-unity slope of the regression line indicates a modest systematic underestimation of the %ID by microPET, possibly because of an underestimation of the calibration factor. Although the %ID by microPET did not correlate with myocardial HSV1-sr39TK activities as closely as with well-counted activity, the correlation remained statistically significant. Possible reasons for this somewhat poorer correlation might include that the net [18F]-FHBG accumulation (a) was calculated for the entire heart, whereas the enzyme activity is only calculated per microgram of protein; (b) reflects the mass flux of substrate (ie, product of enzyme activity and substrate) as compared with the phosphorylating enzyme activity only; and (c) depends on intracellular concentrations of thymidine competing with [18F]-FHBG for phosphorylation. The correlation analysis also revealed possible “plateauing” of [18F]-FHBG accumulation relative to HSV1-sr39TK activity, which is similar to the relation between [8-14C]-ganciclovir uptake and HSV1-TK enzyme activity observed previously in the liver of mice.4
Issues Specific for PET Reporter Gene Expression Imaging of the Heart
Although imaging of PET reporter gene expression in rodents has been reported for oncological or neurological applications,4,5 information on its applications in the heart has remained limited.6 This may be because of the need for special experimental skills, but also because of complexities related to imaging the small and thin-walled rodent heart. In the present study, we acquired images of the myocardial uptake of [13N]-ammonia and of [18F]-FHBG while the animal remained in the same position. Images of gene expression thus could be superimposed on images of myocardial perfusion and the site and extent of gene expression in the myocardium be displayed on polar maps. Furthermore, the image data were reconstructed with MAP algorithms, which improved the volumetric resolution to 1.43 (=2.7) mm3 as compared with 23 (=8) mm3 with the conventional FBP algorithms.11 Furthermore, the “total” myocardial accumulation of the PET reporter probe was measured with a background-subtraction method developed for the present study. This subtraction method offered a means for estimating the magnitude of gene expression and for overcoming problems related to partial volume effects caused by the thin wall of the rat heart and the limited spatial resolution of microPET relative to size of the heart. The approach required no assumptions for partial volume because it accounted for all activity within the confines of the myocardium and in excess of background activity. Finally, [18F]-FHBG uptake occurred also in the liver, seen best on day 3 and declining on day 5, and probably was related to egress of adenovirus from the myocardium into the systemic circulation and eventual binding to coxsackie-adenovirus receptors on hepatocytes. Substituting cardiomyocyte-specific promoters, such as myosin light chain kinase, for constitutive CMV promoter may diminish extracardiac activity.6
Impact of PET Reporter Gene Expression Imaging on Human Cardiac Gene Therapy
Gene therapy entails multiple complex steps including delivery and expression of the therapeutic gene and action of the therapeutic protein leading to therapeutic benefits.1 For gene therapy to be efficacious, the transgene expression must be of sufficient magnitude and duration, both of which may vary between individuals, as also seen in the present study. Only when sufficient therapeutic gene expression is confirmed through imaging of PET reporter gene expression can the efficacy of the gene therapy be evaluated appropriately in any given subject. Therefore, identification of gene expression noninvasively may prove critical for optimization of gene therapy. Further, if the magnitude of expression of the therapeutic gene determines its therapeutic effects, then PET reporter gene imaging may be useful for predicting its therapeutic effect. Additionally, unnecessarily long-term lo cal expression of for example cardiac angiogenic therapeutic genes may lead to undesirable formation of hemangiomas.14 Therefore, monitoring of delivery and expression of cardiac therapeutic genes noninvasively by PET reporter gene imaging may become useful. Since PET imaging can be performed in subjects ranging from rodents to humans, images of cardiac PET reporter gene expression could aid in the design of strategies for gene therapy through animal studies and for evaluating the effect of human cardiac gene therapy.
Conclusions
After intramyocardial injection of Ad-CMV-HSV1-sr39tk, PET reporter gene expression can be monitored with a PET reporter probe [18F]-FHBG and microPET in the rat myocardium noninvasively, quantitatively, and repeatedly at high detection sensitivities. Cardiac PET reporter gene imaging offers the potential of monitoring the expression of therapeutic genes in cardiac gene therapy in animals and humans.
Acknowledgments
This work was supported by Department of Energy contract DEAC03-76-SF00012 (Dr Schelbert) and DE-FC03-87ER60615 (Dr Gambhir), NIH R01 CA82214-01 (Dr Gambhir), SAIRP R24 CA92865 (Dr Gambhir), ICMIC P50 CA86306 (Dr Gambhir), and an American Heart Association Western Affiliate Postdoctoral Grant (Dr Wu). We thank Judy Edwards and Waldermar Ladno for assisting the microPET studies and Eric Agdeppa, Frank Berger, and Xiaoman Z. Lewis for technical support.
References
- 1.Rubanyi GM. The future of human gene therapy. Mol Aspects Med. 2001;22:113–142. doi: 10.1016/s0098-2997(01)00004-8. [DOI] [PubMed] [Google Scholar]
- 2.Human gene marker/therapy clinical protocols (complete updated listing) Hum Gene Ther. 2001;12:2251–2337. doi: 10.1089/10430340152710586. [DOI] [PubMed] [Google Scholar]
- 3.Cherry SR, Shao Y, Silverman RW, et al. MicroPET: a high resolution PET scanner for imaging small animals. IEEE Trans Nucl Sci. 1997;44:1161–1166. [Google Scholar]
- 4.Gambhir SS, Barrio JR, Wu L, et al. Imaging of adenoviral-directed herpes simplex virus type 1 thymidine kinase reporter gene expression in mice with radiolabeled ganciclovir. J Nucl Med. 1998;39:2003–2011. [PubMed] [Google Scholar]
- 5.Gambhir SS, Bauer E, Black ME, et al. A mutant herpes simplex virus type 1 thymidine kinase reporter gene shows improved sensitivity for imaging reporter gene expression with positron emission tomography. Proc Natl Acad Sci U S A. 2000;97:2785–2790. doi: 10.1073/pnas.97.6.2785. [DOI] [PMC free article] [PubMed] [Google Scholar]
- 6.Wu JC, Inubushi M, Sundaresan G, et al. Positron emission tomography imaging of cardiac reporter gene expression in living rats. Circulation. 2002;106:180–183. doi: 10.1161/01.cir.0000023620.59633.53. [DOI] [PMC free article] [PubMed] [Google Scholar]
- 7.Kudo T, Fukuchi K, Annala AJ, et al. Noninvasive measurement of myocardial activity concentrations and perfusion defect sizes in rats with a new small-animal positron emission tomograph. Circulation. 2002;106:118–123. doi: 10.1161/01.cir.0000020221.28996.78. [DOI] [PubMed] [Google Scholar]
- 8.Baumgartner FJ, Barrio JR, Henze E, et al. 13N-labeled L-amino acids for in vivo assessment of local myocardial metabolism. J Med Chem. 1981;24:764–766. doi: 10.1021/jm00138a026. [DOI] [PubMed] [Google Scholar]
- 9.Yaghoubi S, Barrio JR, Dahlbom M, et al. Human pharmacokinetic and dosimetry studies of [(18)F]FHBG: a reporter probe for imaging herpes simplex virus type-1 thymidine kinase reporter gene expression. J Nucl Med. 2001;42:1225–1234. [PubMed] [Google Scholar]
- 10.Wu JC, Inubushi M, Sundaresan G, et al. Optical imaging of cardiac reporter gene expression in living rats. Circulation. 2002;105:1631–1634. doi: 10.1161/01.cir.0000014984.95520.ad. [DOI] [PubMed] [Google Scholar]
- 11.Chatziioannou A, Qi J, Moore A, et al. Comparison of 3-D maximum a posteriori and filtered backprojection algorithms for high-resolution animal imaging with microPET. IEEE Trans Med Imaging. 2000;19:507–512. doi: 10.1109/42.870260. [DOI] [PubMed] [Google Scholar]
- 12.Jacobs A, Tjuvajev JG, Dubrovin M, et al. Positron emission tomography-based imaging of transgene expression mediated by replication-conditional, oncolytic herpes simplex virus type 1 mutant vectors in vivo. Cancer Res. 2001;61:2983–2995. [PubMed] [Google Scholar]
- 13.Black ME, Newcomb TG, Wilson HM, et al. Creation of drug-specific herpes simplex virus type 1 thymidine kinase mutants for gene therapy. Proc Natl Acad Sci U S A. 1996;93:3525–3529. doi: 10.1073/pnas.93.8.3525. [DOI] [PMC free article] [PubMed] [Google Scholar]
- 14.Springer ML, Chen AS, Kraft PE, et al. VEGF gene delivery to muscle: potential role for vasculogenesis in adults. Mol Cell. 1998;2:549–558. doi: 10.1016/s1097-2765(00)80154-9. [DOI] [PubMed] [Google Scholar]


