

Abstract
Food intake increases the activity of hepatic de novo lipogenesis, which mediates the conversion of glucose to fats for storage or utilization. In mice, this program follows a circadian rhythm that peaks with nocturnal feeding1,2 and is repressed by Rev-erbα/β and an HDAC3-containing complex3–5 during the day. The transcriptional activators controlling rhythmic lipid synthesis in the dark cycle remain poorly defined. Disturbances in hepatic lipogenesis are also associated with systemic metabolic phenotypes6–8, suggesting that lipogenesis in the liver communicates with peripheral tissues to control energy substrate homeostasis. Here we identify a PPARδ-dependent de novo lipogenic pathway in the liver that modulates fat utilization by muscle via a circulating lipid. The nuclear receptor PPARδ controls diurnal expression of lipogenic genes in the dark/feeding cycle. Liver-specific PPARδ activation increases, while hepatocyte-Ppard deletion reduces, muscle fatty acid (FA) uptake. Unbiased metabolite profiling identifies PC(18:0/18:1), or 1-stearoyl-2-oleoyl-sn-glycero-3-phosphocholine (SOPC), as a serum lipid regulated by diurnal hepatic PPARδ activity. PC(18:0/18:1) reduces postprandial lipid levels and increases FA utilization through muscle PPARα. High fat feeding diminishes rhythmic production of PC(18:0/18:1), whereas PC(18:0/18:1) administration in db/db mice improves metabolic homeostasis. These findings reveal an integrated regulatory circuit coupling lipid synthesis in the liver to energy utilization in muscle by coordinating the activity of two closely related nuclear receptors. These data implicate alterations in diurnal hepatic PPARδ-PC(18:0/18:1) signaling in metabolic disorders including obesity.
PPARδ promotes FA synthesis in the liver9. Surprisingly, hepatic PPARδ over-expression (adenoviral-mediated, adPPARδ) reduced circulating triglyceride (TG) and free fatty acid (FFA) levels (Fig. 1a). FA uptake and β-oxidation were increased in isolated soleus muscle, compared to control mice (adGFP) (Fig. 1b), suggesting a PPARδ-dependent signal couples liver lipid metabolism to muscle FA oxidation. To identify candidate molecules, we performed untargeted liquid chromatography-mass spectrometry (LC-MS) based metabolite profiling of hepatic lipids10,11. Metabolite set enrichment analyses ranked acetyl-CoA carboxylase (Acaca/Acc1, a rate limiting enzyme in de novo lipogenesis) as a top altered pathway in the adPPARδ/adGFP comparison (Extended Data Fig. 1a and Extended Data Table 1), consistent with a positive correlation of ACC1 and PPARD expression in human livers (Extended Data Fig. 1b). Transient liver-specific Acc1 knockdown (LACC1KD) reduced hepatic TG content and elevated serum TG and FFA levels (Fig. 1c). FA uptake was decreased in isolated soleus muscle from LACC1KD mice (Fig. 1d). In vivo FA uptake assays revealed that muscle FA uptake was decreased in LACC1KD mice in the dark/feeding cycle, when the lipogenic program is active (ZT18 or 12 am. Zeitgeber time ZT0: lights on at 6 am; ZT12: lights off at 6 pm) (Fig. 1e). This defect was accompanied by slower clearance of circulating 3H-oleic acid (Fig. 1f). These results demonstrate that hepatic de novo lipogenesis is linked to muscle FA utilization.
Figure 1. Hepatic PPARδ and Acc1 are linked to muscle FA utilization.
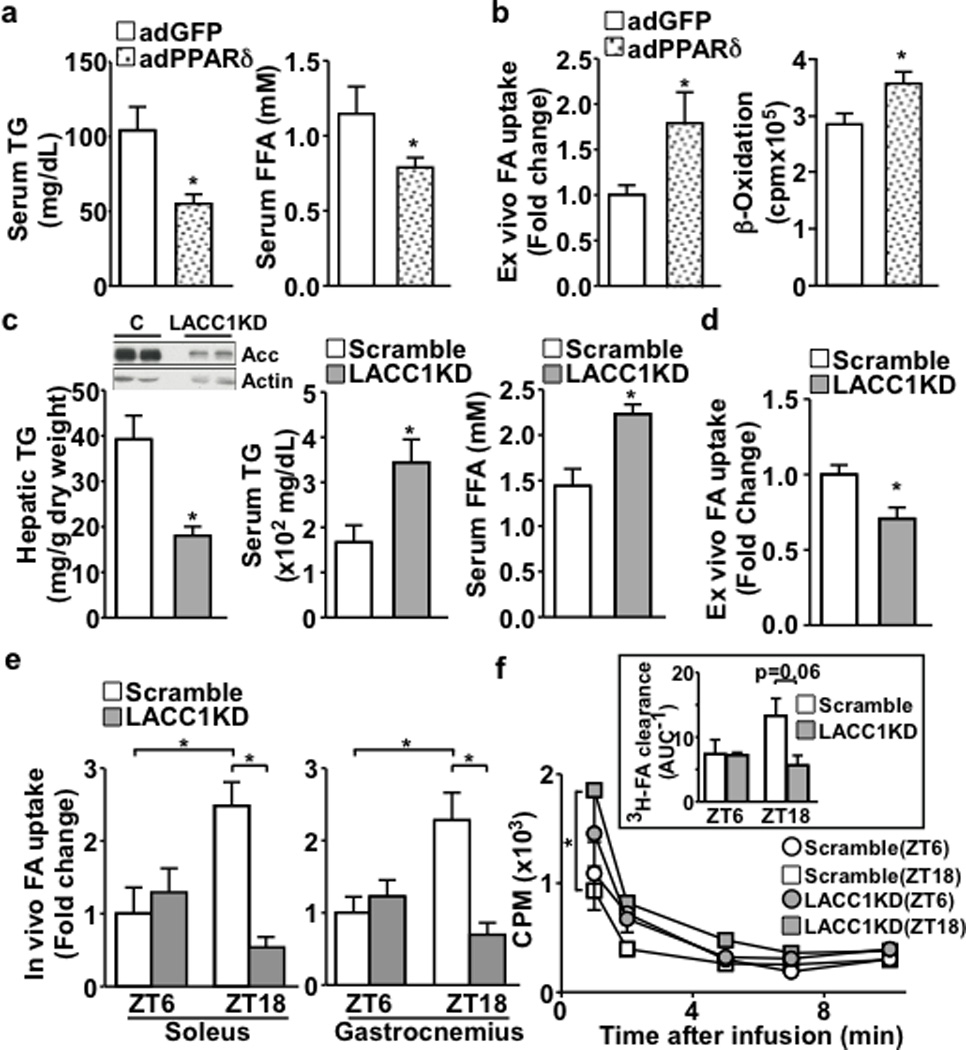
a. Serum TG and FFA levels in adGFP or adPPARδ mice (n=5). b. Ex vivo fatty acid uptake and oxidation in isolated soleus muscle. c. Hepatic TG and serum TG and FFA levels in LACC1KD or control (Scramble) mice (n=5). Inset: Immunoblotting of liver Acc protein. d. Ex vivo fatty acid uptake in isolated soleus muscle. e. In vivo fatty acid uptake in soleus and gastrocnemius muscle. f. Serum 3H-oleic acid disappearance. Inset: 3H-FA clearance. AUC: area under the curve of disappearance. *p<0.05 (t-test), data shown as mean±SEM.
Ppard expression oscillated diurnally, peaking at night, coincident with mRNA levels of the molecular clock Bmal1 (Arntl) in the liver and in dexamethasone-synchronized primary hepatocytes (Extended Data Fig. 2a,b). In liver-conditional Ppard knockout (LPPARDKO) mice, induction of hepatic Acc1 during the dark cycle was abolished; diurnal expression of Acc2, fatty acid synthase (Fasn) and stearoyl-CoA desaturase 1 (Scd1) was also altered (Fig. 2a), indicating PPARδ regulates rhythmic lipogenic gene expression in the liver. Daytime restricted feeding reversed expression patterns of all major molecular clocks (Extended Data Fig. 2c)12. Peak mRNA levels of Ppard and lipogenic genes also shifted to the light cycle in control but not LPPARDKO mice (Fig. 2b). The expression of diglycerol acyltransferase (Dgat1, triglyceride synthesis), choline kinase α (Chka, phosphocholine synthesis) and core circadian clock genes were unchanged in LPPARDKO mice (Extended Data Fig. 2a,c). Body weight, feeding activity and insulin sensitivity were similar between genotypes (Extended Data Fig. 2d,e and Extended Data Table 2). LPPARDKO reduced muscle FA uptake in the dark cycle in vivo (Fig. 2c), mirroring results from LACC1KD mice and demonstrating a functional consequence of this hepatic transcriptional circuitry in muscle physiology.
Figure 2. Hepatic PPARδ controls liver lipogenic gene expression and muscle FA uptake.
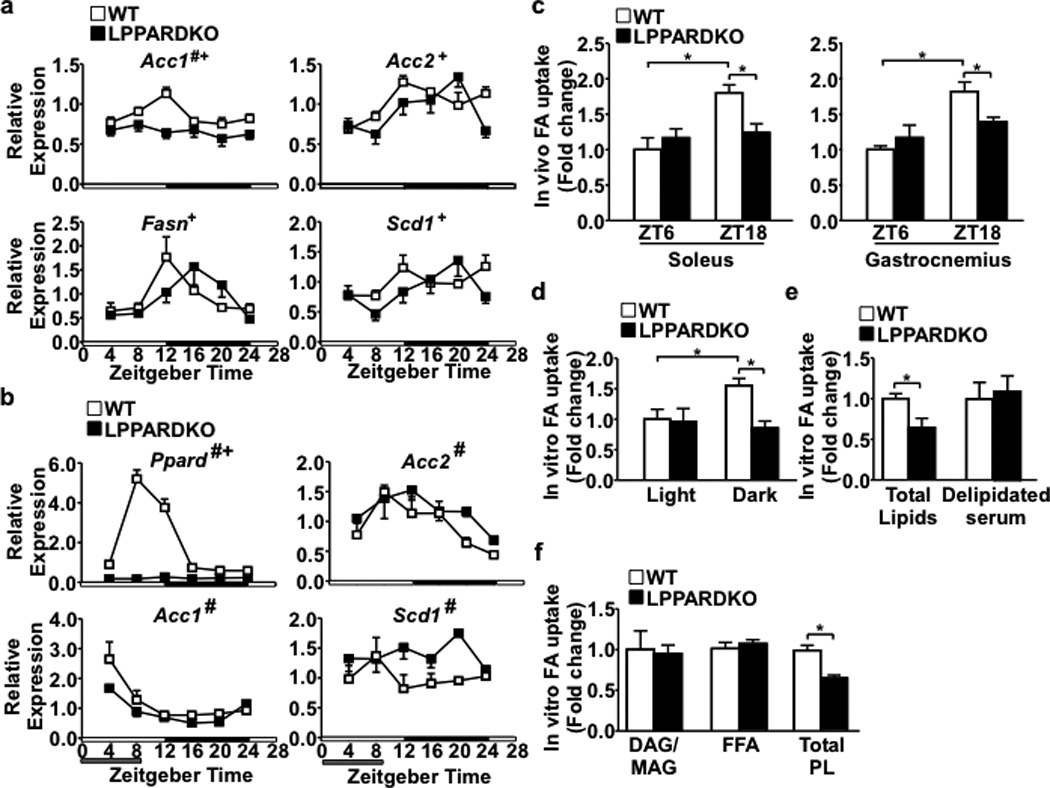
a. Hepatic lipogenic gene expression in wt and LPPARDKO mice (n=4/time point). White and black bars on the x-axis represent light and dark cycles, respectively. b. Liver gene expression under daytime feeding (n=3). #p<0.05 (ANOVA), wt vs. LPPARDKO; +p<0.05, comparing circadian patterns. c. In vivo muscle fatty acid uptake (n=3). d.-f. In vitro fatty acid uptake in C2C12 myotubes treated with serum (2%) pooled from light or dark cycle samples, serum total lipids or delipidated serum (dark cycle samples) or serum lipid fractions (n=3). *p<0.05 (t-test), data shown as mean±SEM.
Products of de novo lipogenesis can exert signaling effects, e.g., palmitoleate as a lipokine and 1- palmitoyl-2-oleoyl-sn-glycero-3-phosphocholine as an endogenous ligand of the nuclear receptor PPARα in hepatocytes13,14. In humans and mice, serum lipid composition closely resembles that of the liver15 (Extended Data Fig. 2f), suggesting that changes in hepatic de novo lipogenesis may have systemic metabolic effects. Indeed, serum or serum-derived lipid extracts - but not delipidated serum -collected in the dark cycle from wt mice increased FA uptake in C2C12 myotubes (vs. LPPARDKO, Fig. 2d,e). Solid phase extraction of plasma lipids (Extended Data Fig. 2g) identified that the phospholipid (PL) fraction stimulated FA uptake in myotubes (Fig. 2f).
To identify PLs mediating functional interactions between PPARδ, hepatic lipid synthesis and muscle FA utilization, we profiled serum lipid metabolites of samples from wt and LPPARDKO mice collected at 6 ZT points. 735 unique ion features were detected in positive and negative ionization modes (Extended Data Fig. 2f). Metabolite hierarchical clustering revealed the main differences between wt and LPPARDKO serum occurred during the dark cycle (Fig. 3a,b), when PPARδ- controlled lipogenesis is most active. Daytime feeding led to a more pronounced discordance in serum lipidomes between these two genotypes, suggesting that LPPARDKO mice were unable to adjust their lipogenic gene expression program (Extended Data Fig. 3a,b). Principal component analysis (PCA) of features in positive ionization mode, which detects PLs as well as mono-, di- and triacylglycerols, demonstrated co-clustering of LPPARDKO and LACC1KD serum samples from the dark cycle (Extended Data Fig. 3c). Comparison of serum and liver metabolomes from three relevant models - LPPARDKO, LACC1KD, adPPARδ - in positive ionization mode (Supplementary Data) yielded 14 features altered in all three models (Fig. 3c,d). These 14 lipid species were also the main drivers of the sample clustering in PCA analyses (Extended Data Fig. 3d). We focused on m/z=788.6, putatively identified as PC(36:1), as its levels were decreased in both LPPARDKO and LACC1KD (vs. control) serum but increased in liver tissue from PPARδ over-expressing mice (Fig. 3d), correlating with the FA uptake data observed in each model. The extracted ion chromatogram (EIC) showed this PL displayed diurnal rhythmicity peaking at night (or during the day in daytime restricted feeding) in wt, but not LPPARDKO serum (Extended Data Fig. 3e,f). This PL was also reduced in LACC1KD serum and increased in adPPARδ liver lysates (Extended Data Fig. 3e). Co-elution experiments with authentic PC(18:0/18:1) and tandem mass spectrometry scanning16 identified this ion as PC(18:0/18:1) (1-stearoyl-2-oleoyl-sn-glycero-3-phosphocholine, SOPC), whereas PC(18:1/18:0) or others such as PC(16:1/20:0) were not observed (Extended Data Fig. 3g and data not shown). The concentrations of PC(18:0/18:1) in wt serum ranged from ~50 µM at ZT8 (day) to ~115 µM ZT20 (night) using deuterated d83-PC(18:0/18:0) as an internal standard. The nighttime increase in PC(18:0/18:1) levels was diminished in LPPARDKO mice (Fig. 3e). PPARδ synthetic ligand treatment (GW501516, 4 days) increased serum PC(18:0/18:1) levels in wt but not LPPARDKO mice (Fig. 3f). These data identified PC(18:0/18:1) as a serum lipid regulated by hepatic PPARδ diurnally in three mouse models.
Figure 3. PC(18:0/18:1) links hepatic PPARδ to serum lipid levels and muscle FA uptake.
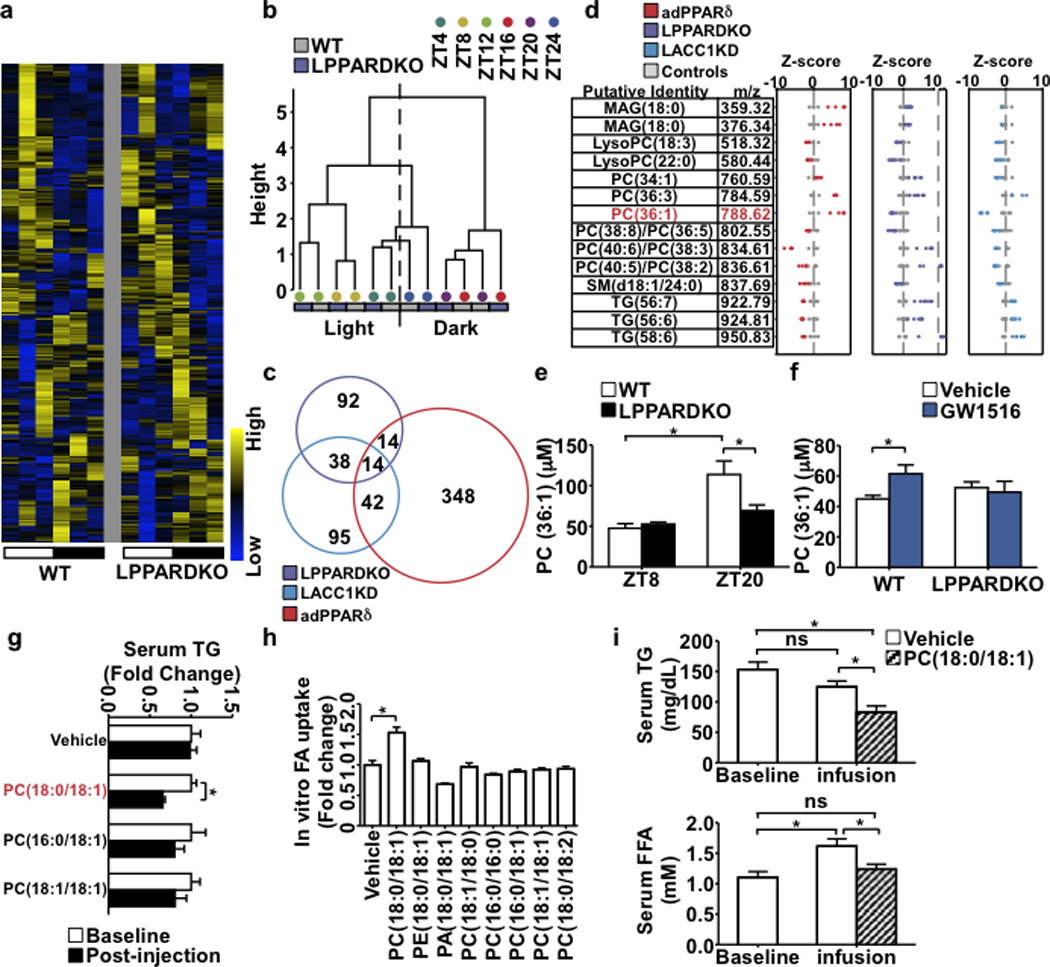
a. Serum lipid heatmap (n=3/time point). White = light (starting at ZT4) and black = dark cycles. b. Dendrogram from hierarchical clustering. c. Cross-comparison of changed lipids. d. Z-score plots of 14 commonly changed features. e. Serum PC(36:1) quantification in wt (n=5) and LPPARDKO (n=4) mice. f. Serum PC(36:1) concentrations in wt/LPPARDKO ± GW501516 (n=5). g. Serum TG changes (tail vein injection) with PLs in wt mice (n=6). h. FA uptake in C2C12 myotubes treated with PLs (50 µM, n=3). i. Serum TG and FFA levels after PC(18:0/18:1) infusion (n=6, wt C57BL/6J mice). *p<0.05 (t-test), data presented as mean±SEM.
Intraperitoneal injection of escalating concentrations of PC(18:0/18:1) reduced serum TG and FFA levels, (Extended Data Fig. 3h) with a trend of increased muscle FA uptake. Tail vein injection of PC(18:0/18:1) (5 mg/kg body weight) also reduced serum TG (Fig. 3g). Notably, PC(16:0/18:1) and PC(18:1/18:1) had no effect. In myotubes, only PC(18:0/18:1) increased FA uptake (Fig. 3h). Catheter-based, continuous infusion of PC(18:0/18:1) (25 µg/min/kg for 200 min) through the jugular vein also lowered circulating TG and FFA levels (Fig. 3i). As such, PC(18:0/18:1) links hepatic PPARδ-controlled lipogenic program to serum lipid concentrations and muscle fat utilization.
Mechanistically, several FA utilization genes in the muscle, namely Cd36, Fabp3, Fabp4, Fatp1, Fatp4, Ppara, Cidea and Mcad (Acadm), were induced in adPPARδ and/or PC(18:0/18:1) treated mice, but repressed in LPPARDKO and LACC1KD animals (Fig. 4a). Cd36 and Fabp3 are known mediators of muscle FA uptake17,18. Cd36 expression at mRNA and protein levels also oscillated in wt muscle peaking in the dark cycle, and shifted to the light cycle by daytime restricted feeding (Fig. 4b and Extended Data Fig. 4a). This diurnal pattern was disrupted in muscle of LPPARDKO mice. Furthermore, while PPARδ agonist GW501516 increased muscle expression of Cd36 and Fabp3 (Fig. 4c), enhanced muscle FA uptake and lowered serum TG levels in wt mice (Extended Data Fig. 4b), all these ligand effects were lost in LPPARDKO animals. These results suggest that hepatic PPARδ may alter expression of muscle genes and FA utilization through PC(18:0/18:1). Indeed, PC(18:0/18:1) treatment induced Cd36/Fabp3 expression in myotubes while Cd36 knockdown abrogated the effect of PC(18:0/18:1) on muscle cell FA uptake (Extended Data Fig. 4c,d). PPARα controls FA metabolism in muscle19 and can be activated by certain PCs14. In reporter assays, PC(18:0/18:1) moderately activated PPARα (Extended Data Fig. 4e). However, the effects of PC(18:0/18:1) infusion on reducing serum TG levels and increasing muscle FA uptake and Cd36/Fabp3 expression were abolished in Ppara knockout (PPARαKO) mice (Fig. 4d,e). In myotubes, increased FA uptake by PC(18:0/18:1) was diminished by Ppara knockdown or by a Pparα mutant lacking the c-terminus activation function domain (AF2), suggesting that PC(18:0/18:1) or its metabolites may modulate PPARα transcriptional activity in vivo (Fig. 4f). These findings demonstrate that a hepatic PPARδ-PC(18:0/18:1)-muscle PPARα signaling cascade coordinates fat synthesis and utilization.
Figure 4. PC(18:0/18:1) regulates muscle FA utilization through PPARα.
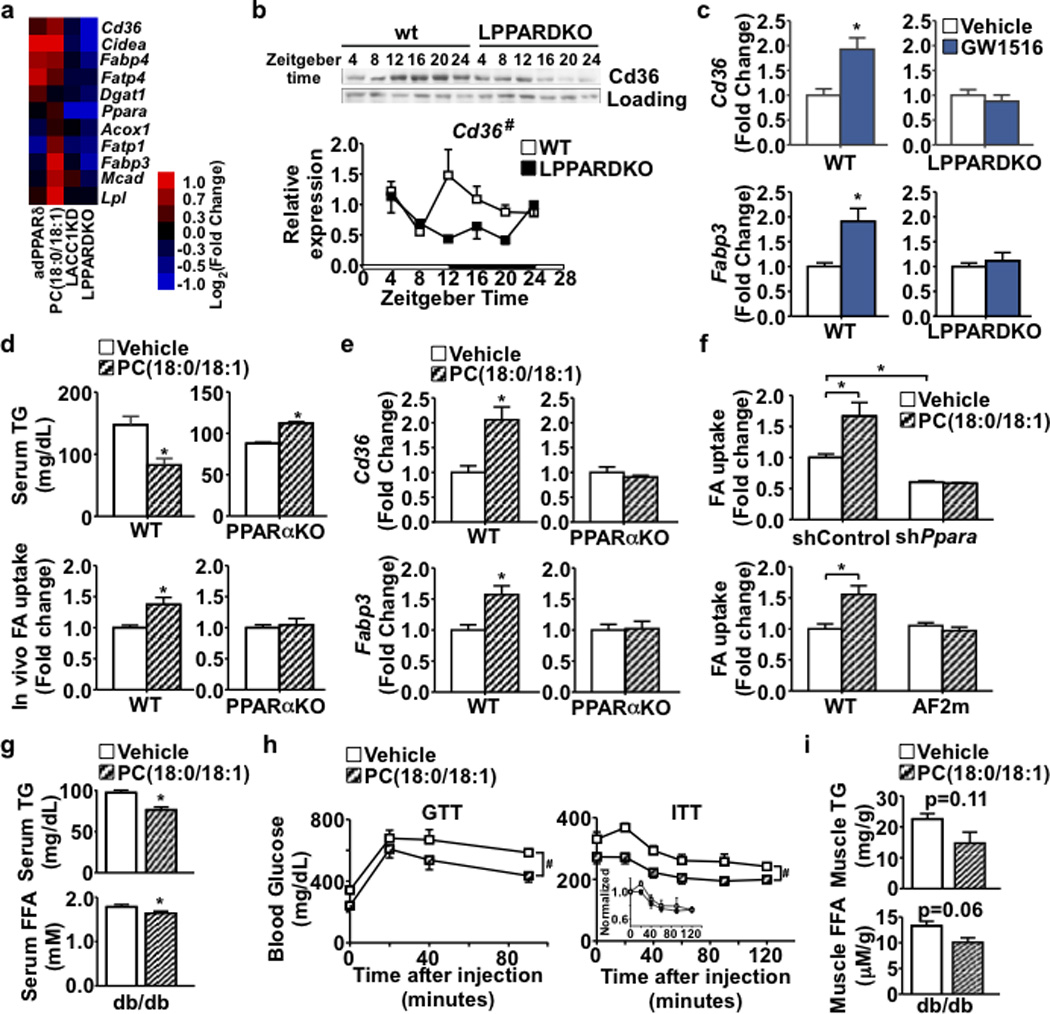
a. Muscle gene expression. b. Muscle Cd36 protein (upper) and gene (lower, n=4/time) expression. c. Cd36 and Fabp3 expression in wt and LPPARDKO muscle ± GW501516 (n=5). d. Top: Serum TG levels in wt and PPARαKO mice after vehicle or PC(18:0/18:1) infusion (n=6, wt from Fig. 3i). Bottom: In vivo soleus muscle FA uptake. e. Muscle Cd36 and Fabp3 expression in wt and PPARαKO mice. f. FA uptake in C2C12 myotubes (n=3). Top: Ppara knockdown or control; Bottom: wt Ppara or AF2 mutant (AF2m). g-i. Fasting serum lipid concentrations, GTT and ITT, and muscle lipid content in vehicle (n=4) or PC(18:0/18:1) (n=5) treated db/db mice. *p<0.05 (t-test); #p<0.05 (ANOVA); data presented as mean±SEM.
Obesity alters circadian rhythms in multiple tissues resulting in abnormal metabolism20. Diet- induced obesity altered the rhythmic pattern of serum PC(18:0/18:) (Extended Data Fig. 4f,g). In db/db mice (a genetic model of obesity), tail vein injection of PC(18:0/18:1) (5 mg/kg/day for 6 days) reduced fasting TG and FFA levels (Fig. 4g). Non-fasting blood glucose levels trended lower in PC(18:0/18:1) treated animals (Extended Data Fig. 4h). PC(18:0/18:1) reduced fasting glucose and improved GTT (Fig. 4h and Extended Data Table 2). Glucose concentrations throughout ITT were lower with PC(18:0/18:1) treatment (Fig. 4h), although the percent change did not differ. Fasting insulin levels were similar (Extended Data Table 2). Muscle lipid contents in the PC(18:0/18:1) treated group trended lower (Fig. 4i), consistent with the notion that PC(18:0/18:1) promotes fat utilization in the muscle.
The data presented here reveal that diurnal oscillations of hepatic de novo lipogenesis-derived lipid metabolites coordinate metabolic functions between liver and muscle (Extended Data Fig. 4i). The finding also adds PC(18:0/18:1) to an emerging network of signaling molecules mediating inter- organ communications13,21–24. The ~2-fold change in PC(18:0/18:1) concentrations is similar to other lipid mediators, including two gut-derived lipids that regulate satiety: N-acylphosphatidylethanolamine and oleylethanolamide21,22, suggesting that physiological fluctuations in levels of lipid mediators are sufficient to stimulate specific biological functions. Specificity is further supported by data showing that systemic treatment with PC(16:0/18:1) - a hepatic PPARα ligand14 – did not lower serum TG or stimulate FA uptake (Fig. 3g,h) nor did it activate PPARα in muscle cells (Extended Data Fig. 4j,k). An association between serum PC(36:1) levels and diabetes mellitus in humans has recently been reported25. Herein, diet-induced obesity dysregulated temporal PC(18:0/18:1) production, while PC(18:0/18:1) treatment improved lipid and glucose metabolism in db/db mice. Although reduced ectopic fat accumulation in PC(18:0/18:1) treated muscle would be predicted to improve metabolic homeostasis26, future studies are required to determine how PC(18:0/18:1) lowers fasting glucose, how 2-fold fluctuations in serum PC(18:0/18:1) levels transduce physiological effects and how PC(18:0/18:1) achieves specificity toward muscle PPARα. Nevertheless, mechanisms that restore the rhythmic activity of the PPARδ-PC(18:0/18:1) axis may provide new therapeutic opportunities to treat metabolic diseases.
Methods
Materials
Ppard or Gfp adenovirus was generated as described8. The shScramble and shAcc1 adenovirus were provided by Dr. Christopher Newgard30. Small hairpin RNA sequences against Cd3631, Ppara (5- CCCTTATCTGAAGAATTCTTA-3) or luciferase (control) were cloned in the pSIREN-RetroQ vector. PparaAF2 mutant construct was generated through site-directed mutagenesis to introduce a stop codon in front of the AF2 domain using wt Ppara construct as the template. The oligonucleotide used for mutagenesis was: 5-GAGCATGCGCAGCTCGAGTAGGTCATCAAGAAGACC-3. Full length Ppara or PparaAF2 mutant cDNA was cloned in the pBabe retroviral vector.
Cell lines
All cell lines were obtained from ATCC: C2C12 (CRL-1772); HEK293 (CRL-1573). C2C12 myoblasts were infected with retroviral particles and selected against puromycin to generate stable lines. All stable C2C12 myoblasts were able to differentiate into myotubes with no apparent defects. Differentiation of C2C12 myoblasts was performed in 2% horse serum, high glucose DMEM for 8 days.
FA uptake/oxidation assays
In vitro FA uptake
C2C12 myotubes were pre-treated with lipids complexed in 0.2% BSA (FA free) overnight. Cells were thoroughly washed before subjecting to a 5-minute FA loading with 1µCi/ml 3H- oleic acid in Krebs-Ringer Hepes (KRH) buffer, 1% FA free BSA and 100 µM oleic acid. Intracellular 3H radioactivity was determined and normalized to protein concentration.
Ex vivo FA oxiation
Freshly isolated soleus muscles were incubated at 37 °C for 30 minutes with 2% FA free BSA containing KRH buffer supplemented with 0.2 mM palmitic acid and 4 µCi/ml 3H- palmitic acid. Supernatants were collected and the 3H radioactivity in the aqueous phase was quantified as described27.
In vivo FA uptake
We adapted an established protocol.28. Briefly, 10 µCi 3H-oleic acid in 3.5% FA free BSA was infused through portal vein [or in 5% intralipid through jugular vein in PC(18:0/18:1) infusion experiments]. Blood samples were collected at 1, 2, 5, 7 and 10 minutes after infusion to determine radioactivity. At 10 minutes, soleus and gastrocnemius muscles were isolated. FA uptake was calculated as described29.
Animals
Mice used in the current study were on the C57BL/6J background, except for wt FVB/NJ and FVB/NJ- db/db mice used for PC(18:0/18:1) tail vein injection (see Extended Data Table 3 for detail). Liver specific Ppard knockout mice were generated by crossing albumin-cre transgenic mice to Ppard f/f mice. Ppara knockout mice (PPARαKO), FVN/NJ and FVB/NJ-db/db mice were purchased from Jackson Laboratory. Animals were on chow diet (with the exception of Extended Data Fig 4f,g) and housed in a barrier facility with 12-hour light and dark cycles. ZT0: lights on at 6 am; ZT12: lights off at 6 pm. All animal studies were approved by the Harvard Medical Area Standing Committee on Animals.
Adenovirus-mediated liver-specific over-expression of knockdown
Adenovirus was injected through the tail vein (109 pfu/mouse). Subsequent metabolic characterizations were carried out 4 days post injection. AdPPARδ/adGFP was repeated in 3 cohorts (8–10 weeks old male, n=4–6) and LACC1KD was conducted in 2 cohorts (8–10 weeks old male, n=5).
Circadian gene expression
5 cohorts were used for circadian studies (8 weeks old, 4 male and 1 female cohorts, showing similar results). For circadian studies, animals were sacrificed every 4 hours starting at 10AM (ZT4) for 24 hours (n=3–4/genotype/time point) with free access to food and water. For dark cycle time points, animals were sacrificed under red safety light prior to dissection. For daytime restricted feeding studies, animals were fed daily between 6AM (ZT0) and 2PM (ZT8) for 7 days under 12-hour light and dark cycles. On the 8th day, animals were sacrificed every 4 hours starting at 6AM (ZT0) for 24 hours (n=3/genotype/time point).
GW501516 treatment
Wild-type and LPPARDKO mice (n=4–5/genotype/treatment) were gavage with 2mg/kg body weight/day GW501516 carried by 0.5% methylcellulose solution for 4 days. Animals were sacrificed 4 hours after the last gavage.
PC(18:0/18:1) injection studies
For the pilot experiment, 8–10 week old male C57BL/6J mice were i.p. injected with 1.25–5 mg/kg PC(18:0/18:1). Circulating lipids levels were determined 2 and 4 hr after injection to determine the biological activity and dosing for PC(18:0/18:1). 5 mg/kg in 5% intralipid was later used for tail vein injection in FVB/NJ and serum lipids were measured 4 hr later. PC(18:0/18:1) showed similar lipid lowering effects when injection was performed during the dark (ZT12) or light (ZT8) cycle. FVB/NJ mice were used for these studies for technical reasons (ease of tail vein injection).
PC(18:0/18:1) infusion studies
8–10 week old male C57BL/6J and PPARαKO mice (n=6–7/genotype/treatment) were catheterized through the jugular vein. 5 days post-operation, animals were infused with PC(18:0/18:1) or vehicle carried by 5% intralipid at a rate of 25µg/kg/min for 200 minutes at ZT4 (10 am). After infusion, a bolus of 10 µCi 3H-oleic acid was infused to determine the in vivo fatty acid uptake rate as described in the method section.
db/db mice
Eight week old male FVB/NJ-db/db mice were injected with a bolus of 5mg/kg body weight PC(18:0/18:1) or vehicle carried by 5% intralipid through tail vein once daily for 6 days (n=4–5/treatment), followed by metabolic studies.
Metabolic studies
Metabolic cage studies were performed in a Comprehensive Lab Animal Monitoring System (Columbus Instruments). Data were collected for 48 hours starting at the beginning of the dark cycle. TG and FFA were determined by colorimetric methods (Thermo and Wako). Hepatic TG was determined from chloroform:methanol (2:1 v/v) extracts of vacuum dried liver samples. Glucose (GTT) and insulin tolerance test (ITT) were performed on overnight fasted animals. Blood glucose levels were determined at indicated time points after administration of 1.5 mg/kg body weight glucose (GTT) or 1U/kg body weight insulin (ITT).
Lipid extraction, fractionation and treatments
Serum lipids were diluted with phosphate buffer saline (PBS) followed by a liquid/liquid extraction with chloroform and methanol (final concentrations of chloroform:methanol: PBS were 2:1:1 v/v). This extraction mixture phase separated to provide an aqueous layer (top) and an organic layer (bottom), which contains all lipids. The lipid-containing layer was concentrated to dryness using a constant stream of nitrogen and dissolved in chloroform, followed by fractionation using a simple column purification method, as described32. Briefly, aminopropyl columns (Sep-Pak Vac NH2 cartridge 3cc/500mg 55–105 µm, Waters) were equilibrated 3 times with acetone/water (7:1). Lipids in chloroform were dried under nitrogen and re-dissolved in hexane/methyl-butyl-tert-ether (MBTE)/acetic acid (100:3:0.3). Lipids were loaded onto the equilibrated column and were eluted sequentially with hexane, hexane/cholorform/ethyl aceate (100:5:5), chloroform/2-propanol (2:1) (diacylglycerol/monoacylglycerol fraction), chloroform: methanol/acetic acid (100:2:2) (free fatty acid fraction), and methanol/chloroform/water (10:5:4) (phospholipids fraction, Supplementary Fig. 2g). Each fraction was dried under nitrogen and dissolved in chloroform. For in vitro experiments, lipids were dissolved in 0.2% fatty acid (FA) free BSA in DMEM with 2% double stripped FBS (charcoal stripped and lipoprotein deficient) and applied to cells overnight. Cells were washed extensively prior to functional assays.
Primary hepatocytes and in vitro synchronization
Primary hepatocytes were isolated as described33. 100 nM of dexamethasone was applied for 1 hour to synchronize cells. After thorough washing, fresh culture media was added and cells were collected at the indicated time after dexamethasone removal.
Gene expression and Western blots
Gene expression was determined by SYBR Green based real-time quantitative PCR (RT-qPCR) using 36b4 as an internal standard. A relative standard curve method was used to calculate the relative expression of genes. For high throughput RT-qPCR array used for muscle gene expression, the ΔΔCt method was used to measure relative expression. Hierarchical clustering and heatmap were generated by Cluster and Java Treeview. The primers used in this study were obtained from Primer Bank34 and listed in Extended Data Table 4. Protein levels of CD36 were determined by western blotting of muscle lysates using antibody against CD36 (SC-9154, Santa Cruz). For circadian studies, a pooled sample from wt or LPPARDKO mice (n=4) at each time point was used. For in vivo Acc1 knockdown, the knockdown efficiency was determined by western blotting (n=5). Two representative animals from each group were shown (Fig. 1c).
Liquid-Chromatography Mass-Spectrometry (LC-MS)
A 2:1:1 chloroform:methanol:PBS solution was prepared for lipid extraction to isolate organic soluble metabolites. Following brief vortexing, samples were centrifuged at 2500×g at 4 °C for 10 minutes. The organic layer (bottom) was transferred to a new vial and solvents were evaporated under a stream of nitrogen. Samples were then dissolved in chloroform (120 µl) to provide a mass spectrometry ready solution and stored at −80 °C until LC-MS analysis (within 48 hours of extraction). For both positive and negative ionization mode LC-MS runs, 20 µl of extract was injected. LC-MS analysis was performed using an Agilent 6210 Accurate-Mass time-of-flight LC-MS system as described10,11. For LC analysis in negative mode, a Gemini (Phenomenex) C18 column (5 mm, 4.6×50 mm) was used together with a pre-column (C18, 3.5 mm, 2×20 mm). Mobile phase A consisted of 95:5 water:methanol and mobile phase B was composed of 60:35:5 isopropanol:methanol:water. Both A and B were supplemented with 0.1% ammonium hydroxide solution (28% in water). The flow rate for each run was 0.5 ml/min. The gradient started at 0% B for 5 minutes and linearly increased to 100% B over 40 minutes, was then maintained at 100% B for 8 minutes before re-equilibrating for 7 minutes at 0% B. For the LC analysis in positive mode, a Luna (Phenomenex) C5 column (5 mm, 4.6×50 mm) was used together with a pre-column (C4, 3.5 mm, 2×20 mm). Mobile phase A and B and the gradient were the same as for positive mode, but supplemented with 0.1% formic acid and 5 mM ammonium formate. MS analysis was performed with an electrospray source ionization (ESI) interface. The capillary voltage was set to 3.0 kV and the fragmentor voltage to 100 V. The drying gas temperature was 350 °C, the drying gas flow was 10 L/min, and the nebulizer pressure was 45 psi. Data was collected using a mass range from 100–1500 Da. For wt and LPPARDKO serum samples, all samples of each genotype from different time points were detected in a single consecutive run. To validate the results, samples from ZT8, ZT16 and ZT24 were subject to a second run (Extended Data Fig. 5). For Scramble and LACC1KD serum or adGFP and adPPARδ liver, the entire sample set was run in a single session.
Targeted analysis of phosphocholine species
Side-chain composition of phosphocholine species
Phosphatidylcholine fatty acyl chain composition was analyzed separately based on established conditions15 on an Agilent 6410 triple quadrupole-mass spectrometer (QQQ-MS) by direct injection of 1 µl of serum lipid extracts without chromatography. This approach generates lithiated phosphocoline adducts, which unlike protonated adducts, give strong signals in tandem MS spectra, and reveals the position of various acyl chains because of a stronger signal in the tandem MS coming from the loss of the acyl chain in the sn-1 position over the sn-2 position. The QQQ-MS was operated in multiple reaction monitoring mode (MRM), targeting lithium adduct precursors and product ions. The MRM transitions and parameters for PC(18:0/18:1) or PC(18:1/18:0) were listed in Supplementary Table 4. Mobile phase was comprised of 98:2 methanol:water with 1 mM LiCl to facilitate the formation of lithium adducts for analysis. Samples were run in positive ionization mode with fragmentor voltage of 150 V, collision energy of 35 V and a dwell time of 25 ms.
Quantification of phosphocholine species by stable isotope dilution mass spectrometry
200 pmol of 1,2-distearoyl(d70)-sn-glycero-3-phosphocholine-1,1,2,2-d4-N,N,N-trimethyl-d9 (D83 PC(18:0/18:0)) was spiked into 50 µl of serum as the recovery standard. Serum was extracted as above. LC-MS/MS analysis was performed using an Agilent 6410 QQQ-MS in positive ionization mode equipped with an electrospray source ionization interface and an Agilent 1200 Binary Pump. For LC analysis, a Gemini (Phenomenex) C18 column (50 mm × 2.0 mm, 3 µm particle size with 100 angstrom pore) was used with a 50 µm steel mesh filter. Mobile phase A consisted of 95:5 water:methanol and mobile phase B consisted of 80:20 isopropanol:methanol. Both A and B were supplemented with 0.1% formic acid. The flow rate was 0.3 ml/min. The gradient started at 20% B and linearly increased to 100% B over 45 minutes, was maintained at 100% B for 10 minutes before equilibrating for 5 minutes at 20% B. The QQQ-MS was operated in MRM mode and PCs were targeted using the m/z [M + H]+ to m/z 281.2 transition for all PCs. Capillary voltage was set to 3.0 kV, the fragmentor voltage to 200 V with a collision energy of 35 V. The drying gas temperature was 350 °C, the drying gas flow was 10 L/min and the nebulizer pressure was 45 psi. The integrated peak area for each species was normalized to the peak area of the recovery standard.
Data analysis (Extended Data Fig. 6)
Data preprocessing
Raw data files were converted to mzXML files and subsequently aligned by XCMS35. The resulting aligned features derived from wt, LPPARDKO, Scramble and LACC1KD serum were compared to identify common features using metaXCMS36 with a mass tolerance of 0.01 and retention time tolerance of 60 seconds. Identical procedures were carried out to generate common features from adPPARδ and adGFP liver lysates. Subsequently, these features from serum and liver lysates samples were processed by an automated workflow37 to identify isotopic peaks and assign putative identity with 3ppm mass tolerance. All isotopic peaks were removed and the remaining data were cutoff for features with median intensity less than 5×10⁴. The reproducibility of the untargeted metabolomics platform was evaluated from two independent runs of 6 samples. The Spearman’s rank correlation coefficient was calculated and the duplicate pair with lowest correlation coefficient was plotted (Extended Data Fig. 5a).
Data normalization
We adapted methods from Sreekumar et al38. Briefly, each sample was centered by median and scaled by its inter-quartile range (IQR). The normalized distributions of samples were plotted in Extended Data Fig.5b as Box-and-Whisker plot.
Hierarchical clustering
Both positive and negative ionization mode features from wt and LPPARDKO serum around the clock were mean centered and scaled by standard deviation on a per feature basis (auto-scaling). To simplify the visualization, only the mean value of each feature from every time point was used for the construction of heat map. The resulting data sets of each genotype were clustered using Euclidean distance as the similarity metric in Cluster 3.0. Heatmaps were generated by Java Treeview. Heatmap of LPPARDKO serum was aligned to wt for comparison. Dendrogram of samples was plotted based on Spearman correlation with Ward linkage.
Principal component analysis
Auto-scaling was applied on a per metabolite basis to each biological group (wt vs LPPARDKO and Scramble vs LACC1KD). Principal component analysis was performed in Metaboanalyst39. The 3D view of the first 3 principal components was plotted. In addition, score plot of the first and third principal components, showing the separation between sample groups and the loading plot of these two principal components were generated (Extended Data Fig. 3c,d).
Identification of significant features
The empirical p-value for each pair of comparison was calculated by randomly permuting sample labels for 1000 times to obtain the null distribution. The analysis was carried out in Multiple Experiment Viewer40. False discovery rate was determined by Benjamini- Hochberg method. A feature is considered significant for downstream cross-comparison with unadjusted p<0.05. Significantly changed features in wt and LPPARDKO mice serum at night (n=6, pooled sample set from ZT16 and ZT20), Scramble and LACC1KD mice serum (n=5), and adGFP and adPPARδ liver lysates (n=4) were compared and visualized in Venn diagram. A total of 158, 189 and 418 features were significantly altered in LPPARKO/wt (serum samples at ZT16/ZT20, p<0.05, corresponding to 19.6% FDR, Supplementary Data), LACC1KD/scramble control (serum samples at ZT16, p<0.05, FDR=17%) and adPPARδ/adGFP (liver lysates, P<0.05, FDR=11.3%) comparisons, respectively.
Metabolites Set Enrichment Analysis (MSEA)
Significantly altered features in the adPPARδ/adGFP liver lysate comparison were subjected to database search to assign putative identities. Among those, 26 were matched to human metabolites database (HMDB) (Extended Data Table 1). The mapped species were assigned a HMDB ID for subsequent MSEA analysis implemented in the Metaboanalyst39.
Statistical test
Power
Due to the multitude of measurements on each animal cohort, it is not feasible to pre-determine a sample size that achieves the same power of all subsequent measurements. Therefore, we determined the minimal number of animals required to detect a pre-defined difference in serum TG, a key readout throughout the study. Our pilot studies in wt mice have indicated that to detect an effect size of 50% reduction in serum TG with a power of 80%, 3–8 mice are required per group, depending on time of the day (as TG levels vary). We determined the actual number of animals used for each study based on the above sample size estimation in conjunction with the feasibility of experimental approaches.
Replication
Animal experiments were performed on multiple cohorts (Extended Data Table 3). In vitro experiments were performed at least 3 times.
Randomization
The randomized block design was used for all animal experiments. We identified the age, sex, body weight, cage effect and timing of experiments as blocking factors. Therefore, all animal experiments were carried out on age matched animals of the same sex. Body weight was measured prior to assigning treatment groups. Cage effect was controlled in pharmacological treatment studies by randomly assigning animals to the placebo or treatment group from the same cage. To control for the timing of experiments, alternating genotypes were drawn for each measurement. Subsequent assays (gene expression, PC(18:0/18:1) concentration measurement, etc) were performed in a blinded fashion, that is, every sample was assigned a number without genotype or treatment labeled and the assays were performed sequentially based on the sample number. In often case, samples were intercalated from different groups.
Sample exclusion and statistical tests
Pre-determined sample exclusion criterion was established for technical failures. In addition, the 1.5 inter-quartile range rule was used to exclude additional outliers. Two-tailed unpaired student’s t-test was used to compare two groups/treatments for experiments considered normal distribution (e.g., cultured cells). For time-series data, the two-way ANOVA procedure was used. For metabolomics data analysis, the methods are detailed in metabolomics data analysis section. Equal variance among groups was assumed.
Extended Data
Extended Data Figure 1. Analyses of liver lipid metabolites altered by PPARδ over-expression.

a. Metabolite set enrichment analysis (MSEA) of lipids from adGFP and adPPARδ liver lysates (n=4). Metabolites were identified based on database search of matching mass-charge ratio and retention time. Identified metabolites and their relative quantity were used to calculate the enrichment and statistical significance. Top 30 perturbed enzyme or pathways were shown. List of metabolites recognized by the Metaboanalyst program and subsequently used for the MSEA analysis is shown in Supplementary Table 1. b. Correlation of hepatic PPARD and ACC1 expression in human liver. Human liver gene expression microarray data was downloaded from gene expression omnibus (GSE9588) and analyzed using Graphpad Prism. *p<0.05 (t-test).
Extended Data Figure 2. Molecular clock expression, food intake and glucose metabolism in wt and LPPARDKO mice.

a. Liver gene expression in wt and LPPARDKO mice (n=4, each time point). White bar: light cycle starting at ZT4; Black bar: dark cycle. b. Ppard and Bmal1 expression in dexamethasone synchronized primary hepatocytes (n=3, each time point). Circadian time: hours after dexamethasone treatment. c. Gene expression in wt and LPPARDKO livers under daytime restricted feeding (n=3, each time point). Red bar: time when food was available. d. Food intake in wt and LPPARDKO mice measured by metabolic cages (n=8). e. GTT and ITT in wt (n=6) and LPPARDKO (n=7) mice. f. Comparison of liver and serum lipidomes. g. Column purification of serum lipids (See methods for detail). IPA: isopropyl alcohol; MeOH: methanol; HOAc: acetic acid. Data were presented as mean±SEM.
Extended Data Figure 3. Identification and characterization of PC(18:0/18:1), or SOPC.

a. Heat map of identified features in wt and LPPARDKO serum under daytime feeding (n=3, each time point). White bar: light cycle starting at ZT0; Black bar: dark cycle; Red bar: time when food was available. b. Dendrogram of serum samples under daytime restricted feeding. c. Principal component analysis (PCA) of positive mode features in wt, LPPARDKO, Scramble and LACC1KD serum under ad lib feeding. Top: score plot of the first three PCs representing 53.2% of the total variation. Bottom: score plot of PC1 and PC3. Circle: 95% confidence interval. d. Loading plot of the PCA. The putative identities of 11 features identified in Fig. 3d are shown in red. Additional top features contributing to the segregation are highlighted in blue. e. Top panels: EIC of mz=788.6 in wt and LPPARDKO serum. Bottom panels: EIC of mz=788.6 in LACC1KD serum and adPPARδ livers. f. Normalized PC(36:1) intensity in wt and LPPARDKO mouse serum (n=4) under ad libitum or daytime restricted feeding (DF). g. Top: Multiple reaction monitoring (MRM) parameters for identification of acyl-chain composition of PC(36:1). Bottom left: Co-elution of the PC (18:0/18:1) standard with mz=788.6. Bottom right: PC(36:1) acyl-chain composition determined by tandem mass spectrometry running in the MRM mode. h. Top panels: Lipid levels in mice i.p. injected with various doses of PC(18:0/18:1) (n=4). Bottom: In vivo FA uptake in soleus muscle (left) and serum PC(36:1) enrichment (right) 4 hours after PC(18:0/18:1) injection at 5mg/kg body weight. *p<0.05 (t-test), data presented as mean±SEM.
Extended Data Figure 4. Requirement of hepatic PPARδ and muscle PPARα for the inter-organ communication mediated by PC(18:0/18:1)/SOPC.

a. Cd36 gene expression in muscle of wt and LPPARDKO mice under daytime restricted feeding (n=3, each time point). #p<0.05 (ANOVA). b. Effects of GW501516 on serum TG and muscle FA uptake in wt and LPPARDKO mice (n=5). c. Cd36 and Fabp3 gene expression in C2C12 myotubes treated with vehicle or 25 µM PC(18:0/18:1) (n=3). d. FA uptake in control or stable Cd36 knockdown C2C12 myotubes pretreated with indicated lipids. e. The mammalian one-hybrid assay (diagram shown on the top) to determine the trans-activation activity of the PPAR ligand binding domain (LBD) (n=3). Left panel: Relative luciferase unit (RLU, presented as fold change) indicative of the reporter activity regulated by Gal4 DNA binding domain (DBD)- PPARαLBD fusion protein (Gal4-PPARαLBD) in 293 cells treated with indicated phospholipids at 100 µM. Right panel: RLU of Gal4-PPARδLBD and Gal4-PPARγLBD treated with 100 µM PC(18:0/18:1). f. Heat map showing serum phospholipid changes between ZT20 and ZT8 in 7-month old male C57BL/6J mice on chow (n=3) or high fat diet (HFD for 4 months, n=5) from targeted metabolomics. g. Serum PC(36:1) concentrations under chow or HFD. h. Blood glucose levels of ad lib fed db/db mice measured between ZT0 and ZT3 before daily lipids injections [vehicle: n=4; PC(18:0/18:1): n=5]. i. Model for the role of PPARδ-PC(18:0/18:1)-PPARα signaling in FA synthesis and utilization in the liver-muscle axis. j. Upper panel: In vivo fatty acid uptake in soleus and gastrocnemius muscle 4 hours after vehicle or 5 mg/kg PC(16:0/18:1) injection though the tail vein (n=6); lower panel: muscle Cd36 and Fabp3 gene expression after PC(16:0/18:1) injection (n=4). k. Upper panel: activities of a PPRE-containing luciferase reporter in PPARα-expressing C2C12 cells treated with vehicle, 50 µM PC(18:0/18:1) or PC(16:0/18:1) and 1 µM GW7647 (a PPARα synthetic ligand). Lower panel: Cd36 expression in C2C12 myotubes. *p<0.05, (t-test), data presented as mean±SEM.
Extended Data Figure 5. Validation of metabolomics analyses.

a. The reproducibility of the untargeted metabolomics platform was validated from two separate runs of 6 serum samples. The Spearman’s rank correlations are between 0.9 and 0.94. The duplicate pair with the lowest correlation (Spearman’s r=0.90) is shown. b. The raw intensity of samples was subject to normalization with median centering and inter-quartile range (IQR) scaling. The resulting data show equal distribution among different groups of samples. White bar represents samples obtained in the light cycle and black bar for those in the dark cycle.
Extended Data Figure 6.

Flow chart of metabolomics data analysis (showing the positive mode metabolites; see methods for detailed description).
Extended Data Table 1.
List of metabolites recognized by Metaboanalyst program and subsequently used for MSEA analysis.
| Metabolites | HMDB ID |
|---|---|
| 1-Acylglycerol | METPA0229 |
| eicosatrienoic acid | HMDB02925 |
| eicosadienoic acid | HMDB05060 |
| eicosenoic acid | HMDB02231 |
| Glycerophosphocholine | HMDB00086 |
| LysoPC(18:0) | HMDB10384 |
| LysoPC(18:2) | HMDB10386 |
| LysoPC(18:3) | HMDB10387 |
| LysoPC(22:0) | HMDB10398 |
| LysoPC(22:6) | HMDB10404 |
| LysoSM(d18:1) | HMDB06482 |
| PA(34:1) | HMDB07858 |
| hexadecenoic acid | HMDB03229 |
| PC(36:1) | HMDB07887 |
| PC(32:0) | HMDB00564 |
| PC(36:2) | HMDB00593 |
| PE(34:1) | MSEA0160 |
| PE(34:2) | MSEA0161 |
| PE(40:6) | MSEA0170 |
| PhosphatidylgIyceroI | MSEA0606 |
| glycerophosphoethanolamine | MSEA0611 |
| phosphatidylserine | HMDB12330 |
| PS(36:1) | HMDB10163 |
| Sphingomyelin | HMDB01348 |
| sphingosine | HMDB00252 |
| Sphingosine 1-phosphate | HMDB00277 |
Extended Data Table 2.
Metabolic characteristics of mouse models: (I) wt and LPPARDKO mice under normal chow diet (male, 8–10 weeks old, n=6); (II) vehicle (n=4) and PC(18:0/18:1) (n=5) treated FVB/NJ-db/db mice.
| I | ||
|---|---|---|
| C57BL/6J | WT | LPPARDKO |
| Body Weight (8 wks) (g) | 26.03±0.67 | 24.63±0.23 |
| Fasting Insulin (ng/mL) | 0.35±0.10 | 0.31±0.05 |
| Fasting Blood Glucose (mg/dL) | 83.13±2.63 | 79.13±2.66 |
| ALT (Unit/L) | 25.19±2.48 | 18.23±1.66 |
| AST (Unit/L) | 102.70±25.02 | 96.78±25.02 |
| II | ||
|---|---|---|
| FVB/NJ-db/db | Control | PC(18:0/18:1) |
| Body Weight (g) | 37.70±1.97 | 35.98±0.94 |
| Fasting Insulin (ng/mL) | 36.70±4.96 | 42.61±5.12 |
| Fasting Blood Glucose (mg/dL) | 245.7±3.67 | 184.2±23.20* |
p<0.05, two-tailed t-test. Data were presented as mean±SEM.
Extended Data Table 3.
List of animal cohorts used for this study. ED: Extended Data.
| Cohort Name | No. Cohorts |
Age | Sex | Background | Animal No. | Figures |
|---|---|---|---|---|---|---|
| adPPARδ vs adGFP | 3 | 8–10 weeks | Male | C57BL/6J | 4–6/genotype |
Fig. 1a,b; Fig. 3c,d; Fig. 4a; ED. Fig 1a; ED. Fig 2f; ED. Fig. 3e |
| LACC1KD vs Scramble | 2 | 8–10 weeks | Male | C57BL/6J | 5/genotype | Fig. 1c–f; Fig. 3c,d; ED. Fig 3c–e |
|
LPPARDKO vs wt, chow fed, metabolic phenotyping |
2 | 8–10 and 32– 35 weeks |
Male | C57BL/6J | 6–8/genotype | ED. Fig. 2d–e |
|
LPPARDKO vs wt, ad lib circadian study |
4 | 8 weeks | Male /Female |
C57BL/6J | 3–5/genotype/time point |
Fig. 2a,c–f; Fig. 3a–e; Fig. 4b; ED. Fig. 2a; ED. Fig. 3c–f |
|
LPPARDKO vs wt, daytime restricted feeding |
1 | 8 weeks | Male | C57BL/6J | 3/genotype/time point |
Fig. 2b; ED. Fig. 2c; ED. Fig. 3a,b,f; ED. Fig. 4a |
|
LPPARDKO vs wt. GW501516 treatment |
1 | 10–12 weeks | Male | C57BL/6J | 4– 5/genotype/treatme nt |
Fig. 3f; Fig. 4c; ED. Fig. 4b |
|
wt, PC intra-peritoneal injection |
1 | 10–12 weeks | Male | C57BL/6J | 4/genotype/treatme nt |
ED. Fig. 3h |
| wt, PC tall vein injection | 2 | 8–10 weeks | Male | FVB/NJ | 6/genotype/treatme nt |
Fig. 3g |
|
PPARα KO vs wt, lipid infusion |
1 | 10–12 weeks | Male | C57BL/6J | 6- 7/genotype/treatme nt |
Fig. 3i; Fig. 4d–e |
|
wt, db/db, PC (18:0/18:1) vs vehicle |
1 | 8 weeks | Male | FVB/NJ | 4–5/treatment | Fig. 4g–l; ED. Fig. 4h |
|
wt, C57BL/5.1, Chow vs High Fat |
1 | 32–35 weeks | Male | C57BL/6J | 3–5/treatment/time point |
ED. Fig. 4f–g |
Extended Data Table 4.
List of primers used for RT-qPCR and oligonucleotides for shRNA constructs.
| RT-qPCR | |||
|---|---|---|---|
| Genes | Forward Sequence | Reverse Sequence | Accession Number |
|
Acaca/ Acc1 |
CGCTCGTCAGGTTCTTATTG | TTTCTGCAGGTTCTCAATGC | NM_133360.2 |
| Fasn | TCCTGGAACGAGAACACGATCT | GAGACGTGTCACTCCTGGACTTG | NM_007988.3 |
| Scd1 | CTTCTTCTCTCACGTGGGTTG | CGGGCTTGTAGTACCTCCTC | NM_009127.4 |
| Dgat1 | CATGCGTGATTATTGCATCC | ACAGGTTGACATCCCGGTAG | NM_010046.2 |
| Rev-erbα | TCTCTCCGTTGGCATGTCTAGA | GCAAGCATCCGTTGCTTCTC | X86010.1 |
| Cd36 | TCATATTGTGCTTGCAAATCCAA | TGTAGATCGGCTTTACCAAAGATG | NM_001159558.1 |
| Fabp4 | TCACCGCAGACGACAGGAA | CCACCAGCTTGTCACCATCTC | NM_024406.2 |
| Fatp4 | CATCAGCGTAAATGGGGATTTGG | CTGTCGTCTGCGGTGATTTCATC | AJ251113.1 |
| Cidea | TGCTCTTCTGTATCGCCCAGT | GCCGTGTTAAGGAATCTGCTG | NM_007702.2 |
| Ppara | TGTTTGTGGCTGCTATAATTTGC | GCAACTTCTCAATGTAGCCTATGTTT | NM_011144.6 |
| Fabp3 | ACCTGGAAGCTAGTGGACAG | TGATGGTAGTAGGCTTGGTCAT | NM_010174.1 |
| Fatp1 | CGCTTTCTGCGTATCGTCTG | GATGCACGGGATCGTGTCT | NM_011977.3 |
| Per1 | CCAGCGTGTCATGATGACATAC | CTCTCCCGGTCTTGCTTCAG | AF543843.2 |
| Cry1 | CACTGGTTCCGAAAGGGACTC | CTGAAGCAAAAATCGCCACCT | NM_007771.3 |
|
Arntl /Bmal1 |
TCAAGACGACATAGGACACCT | GGACATTGGCTAAAACAACAGTG | NM_007489.4 |
|
Rplp0/ 36b4 |
AGATGCAGCAGATCCGCAT | GTTCTTGCCCATCAGCACC | NM_007475.5 |
| Ppard | CAGCCTCAACATGGAATGTC | TCCGATCGCACTTCTCATAC | NM 011145.3 |
|
Acadm/ Mcad |
TTTCGAAGACGTCAGAGTGC | TGCGACTGTAGGTCTGGTTC | NM_007382.5 |
| shRNA | ||
|---|---|---|
| Gene | Sequence | Accession Number |
| Cd36 | GGGAAGTTGTCCTTGAAGA | NM_001159558.1 |
| Ppara | CCCTTATCTGAAGAATTCTTA | NM_011144.6 |
Supplementary Material
Acknowledgements
We thank Dr. Christopher Newgard (Duke University) for providing shACC1 and shScramble adenovirus, Ugur Unluturk, Xiaobo Li and Ariel N. White for technical help and Drs. David E. Cohen, Steven Watkins and David Jacobi for comments. This work is supported by American Heart Association and American Diabetes Association (C.-H.L.) and NIH grants: R01DK075046 (C- HL); R01HL048743 (JP); K08HL105678 (JDB).
Footnotes
Supplementary Information is linked to the online version of the paper at www.nature.com/nature.
Author Contributions S.L, A.S, J.P and C.H.L designed the research. S.L performed most of the experiments with technical assistance from K.S, P.B, M.G and L.D. S.L, J.B, E.H, M.L and A.S developed and performed untargeted and targeted metabolite profiling. B.H generated adGFP and adPPARδ virus. K.I performed metabolic cage and lipid infusion experiments. G.H, J.P, A.S and J.B provided critical intellectual inputs and manuscript editing. S.L and C.H.L analyzed the data and wrote the paper.
The authors declare no competing financial interests.
References
- 1.Asher G, Schibler U. Crosstalk between components of circadian and metabolic cycles in mammals. Cell metabolism. 2011;13:125–137. doi: 10.1016/j.cmet.2011.01.006. [DOI] [PubMed] [Google Scholar]
- 2.Bass J, Takahashi JS. Circadian integration of metabolism and energetics. Science. 2010;330:1349–1354. doi: 10.1126/science.1195027. [DOI] [PMC free article] [PubMed] [Google Scholar]
- 3.Feng D, et al. A circadian rhythm orchestrated by histone deacetylase 3 controls hepatic lipid metabolism. Science. 2011;331:1315–1319. doi: 10.1126/science.1198125. [DOI] [PMC free article] [PubMed] [Google Scholar]
- 4.Solt LA, et al. Regulation of circadian behaviour and metabolism by synthetic REV-ERB agonists. Nature. 2012;485:62–68. doi: 10.1038/nature11030. [DOI] [PMC free article] [PubMed] [Google Scholar]
- 5.Cho H, et al. Regulation of circadian behaviour and metabolism by REV-ERB-alpha and REV-ERB-beta. Nature. 2012;485:123–127. doi: 10.1038/nature11048. [DOI] [PMC free article] [PubMed] [Google Scholar]
- 6.Miyazaki M, et al. Hepatic stearoyl-CoA desaturase-1 deficiency protects mice from carbohydrate-induced adiposity and hepatic steatosis. Cell metabolism. 2007;6:484–496. doi: 10.1016/j.cmet.2007.10.014. [DOI] [PubMed] [Google Scholar]
- 7.Matsuzaka T, et al. Crucial role of a long-chain fatty acid elongase, Elovl6, in obesity-induced insulin resistance. Nature medicine. 2007;13:1193–1202. doi: 10.1038/nm1662. [DOI] [PubMed] [Google Scholar]
- 8.Choi CS, et al. Continuous fat oxidation in acetyl-CoA carboxylase 2 knockout mice increases total energy expenditure, reduces fat mass, and improves insulin sensitivity. Proceedings of the National Academy of Sciences of the United States of America. 2007;104:16480–16485. doi: 10.1073/pnas.0706794104. [DOI] [PMC free article] [PubMed] [Google Scholar]
- 9.Liu S, et al. Role of peroxisome proliferator-activated receptor {delta}/{beta} in hepatic metabolic regulation. The Journal of biological chemistry. 2011;286:1237–1247. doi: 10.1074/jbc.M110.138115. [DOI] [PMC free article] [PubMed] [Google Scholar]
- 10.Homan EA, Kim YG, Cardia JP, Saghatelian A. Monoalkylglycerol ether lipids promote adipogenesis. J Am Chem Soc. 2011;133:5178–5181. doi: 10.1021/ja111173c. [DOI] [PMC free article] [PubMed] [Google Scholar]
- 11.Brown JD, Oligino E, Rader DJ, Saghatelian A, Plutzky J. VLDL hydrolysis by hepatic lipase regulates PPARdelta transcriptional responses. PloS one. 2011;6:e21209. doi: 10.1371/journal.pone.0021209. [DOI] [PMC free article] [PubMed] [Google Scholar]
- 12.Damiola F, et al. Restricted feeding uncouples circadian oscillators in peripheral tissues from the central pacemaker in the suprachiasmatic nucleus. Genes & development. 2000;14:2950–2961. doi: 10.1101/gad.183500. [DOI] [PMC free article] [PubMed] [Google Scholar]
- 13.Cao H, et al. Identification of a lipokine, a lipid hormone linking adipose tissue to systemic metabolism. Cell. 2008;134:933–944. doi: 10.1016/j.cell.2008.07.048. [DOI] [PMC free article] [PubMed] [Google Scholar]
- 14.Chakravarthy MV, et al. Identification of a physiologically relevant endogenous ligand for PPARalpha in liver. Cell. 2009;138:476–488. doi: 10.1016/j.cell.2009.05.036. [DOI] [PMC free article] [PubMed] [Google Scholar]
- 15.Kotronen A, et al. Comparison of lipid and fatty acid composition of the liver, subcutaneous and intra-abdominal adipose tissue, and serum. Obesity. 2010;18:937–944. doi: 10.1038/oby.2009.326. [DOI] [PubMed] [Google Scholar]
- 16.Hsu FF, Bohrer A, Turk J. Formation of lithiated adducts of glycerophosphocholine lipids facilitates their identification by electrospray ionization tandem mass spectrometry. J Am Soc Mass Spectrom. 1998;9:516–526. doi: 10.1016/S1044-0305(98)00012-9. [DOI] [PubMed] [Google Scholar]
- 17.Glatz JF, Luiken JJ, Bonen A. Membrane fatty acid transporters as regulators of lipid metabolism: implications for metabolic disease. Physiol Rev. 2010;90:367–417. doi: 10.1152/physrev.00003.2009. [DOI] [PubMed] [Google Scholar]
- 18.Shearer J, et al. Heart-type fatty acid-binding protein reciprocally regulates glucose and fatty acid utilization during exercise. American journal of physiology. Endocrinology and metabolism. 2005;288:E292–E297. doi: 10.1152/ajpendo.00287.2004. [DOI] [PubMed] [Google Scholar]
- 19.Finck BN, et al. A potential link between muscle peroxisome proliferator- activated receptor- alpha signaling and obesity-related diabetes. Cell metabolism. 2005;1:133–144. doi: 10.1016/j.cmet.2005.01.006. [DOI] [PubMed] [Google Scholar]
- 20.Kohsaka A, et al. High-fat diet disrupts behavioral and molecular circadian rhythms in mice. Cell metabolism. 2007;6:414–421. doi: 10.1016/j.cmet.2007.09.006. [DOI] [PubMed] [Google Scholar]
- 21.Gillum MP, et al. N-acylphosphatidylethanolamine, a gut- derived circulating factor induced by fat ingestion, inhibits food intake. Cell. 2008;135:813–824. doi: 10.1016/j.cell.2008.10.043. [DOI] [PMC free article] [PubMed] [Google Scholar]
- 22.Fu J, et al. Oleylethanolamide regulates feeding and body weight through activation of the nuclear receptor PPAR-alpha. Nature. 2003;425:90–93. doi: 10.1038/nature01921. [DOI] [PubMed] [Google Scholar]
- 23.Lee JM, et al. A nuclear-receptor-dependent phosphatidylcholine pathway with antidiabetic effects. Nature. 2011;474:506–510. doi: 10.1038/nature10111. [DOI] [PMC free article] [PubMed] [Google Scholar]
- 24.Fu S, et al. Aberrant lipid metabolism disrupts calcium homeostasis causing liver endoplasmic reticulum stress in obesity. Nature. 2011;473:528–531. doi: 10.1038/nature09968. [DOI] [PMC free article] [PubMed] [Google Scholar]
- 25.Floegel A, et al. Identification of serum metabolites associated with risk of type 2 diabetes using a targeted metabolomic approach. Diabetes. 2013;62:639–648. doi: 10.2337/db12-0495. [DOI] [PMC free article] [PubMed] [Google Scholar]
- 26.Samuel VT, Shulman GI. Mechanisms for insulin resistance: common threads and missing links. Cell. 2012;148:852–871. doi: 10.1016/j.cell.2012.02.017. [DOI] [PMC free article] [PubMed] [Google Scholar]
- 27.Reilly SM, et al. Nuclear receptor corepressor SMRT regulates mitochondrial oxidative metabolism and mediates aging-related metabolic deterioration. Cell metabolism. 2010;12:643–653. doi: 10.1016/j.cmet.2010.11.007. [DOI] [PMC free article] [PubMed] [Google Scholar]
- 28.Bartelt A, et al. Brown adipose tissue activity controls triglyceride clearance. Nature medicine. 2011;17:200–205. doi: 10.1038/nm.2297. [DOI] [PubMed] [Google Scholar]
- 29.Shearer J, et al. Long chain fatty acid uptake in vivo: comparison of [125I]-BMIPP and [3H]-bromopalmitate. Lipids. 2008;43:703–711. doi: 10.1007/s11745-008-3183-4. [DOI] [PMC free article] [PubMed] [Google Scholar]
- 30.Ronnebaum SM, et al. Chronic suppression of acetyl-CoA carboxylase 1 in beta-cells impairs insulin secretion via inhibition of glucose rather than lipid metabolism. . The Journal of biological chemistry. 2008;283:14248–14256. doi: 10.1074/jbc.M800119200. [DOI] [PMC free article] [PubMed] [Google Scholar]
- 31.Lobo S, Wiczer BM, Bernlohr DA. Functional analysis of long-chain acyl-CoA synthetase 1 in 3T3-L1 adipocytes. The Journal of biological chemistry. 2009;284:18347–18356. doi: 10.1074/jbc.M109.017244. [DOI] [PMC free article] [PubMed] [Google Scholar]
- 32.Agren JJ, Julkunen A, Penttila I. Rapid separation of serum lipids for fatty acid analysis by a single aminopropyl column. Journal of lipid research. 1992;33:1871–1876. [PubMed] [Google Scholar]
- 33.Kang K, et al. Adipocyte-derived Th2 cytokines and myeloid PPARdelta regulate macrophage polarization and insulin sensitivity. Cell metabolism. 2008;7:485–495. doi: 10.1016/j.cmet.2008.04.002. [DOI] [PMC free article] [PubMed] [Google Scholar]
- 34.Spandidos A, Wang X, Wang H, Seed B. PrimerBank: a resource of human and mouse PCR primer pairs for gene expression detection and quantification. Nucleic acids research. 2010;38:D792–D799. doi: 10.1093/nar/gkp1005. [DOI] [PMC free article] [PubMed] [Google Scholar]
- 35.Smith CA, Want EJ, O'Maille G, Abagyan R, Siuzdak G. XCMS: processing mass spectrometry data for metabolite profiling using nonlinear peak alignment, matching, and identification. Analytical chemistry. 2006;78:779–787. doi: 10.1021/ac051437y. [DOI] [PubMed] [Google Scholar]
- 36.Tautenhahn R, et al. metaXCMS: second-order analysis of untargeted metabolomics data. Analytical chemistry. 2011;83:696–700. doi: 10.1021/ac102980g. [DOI] [PMC free article] [PubMed] [Google Scholar]
- 37.Brown M, et al. Automated workflows for accurate mass-based putative metabolite identification in LC/MS-derived metabolomic datasets. Bioinformatics. 2011;27:1108–1112. doi: 10.1093/bioinformatics/btr079. [DOI] [PMC free article] [PubMed] [Google Scholar]
- 38.Sreekumar A, et al. Metabolomic profiles delineate potential role for sarcosine in prostate cancer progression. Nature. 2009;457:910–914. doi: 10.1038/nature07762. [DOI] [PMC free article] [PubMed] [Google Scholar] [Research Misconduct Found]
- 39.Xia J, Wishart DS. Web-based inference of biological patterns, functions and pathways from metabolomic data using MetaboAnalyst. . Nature protocols . 2011;6:743–760. doi: 10.1038/nprot.2011.319. [DOI] [PubMed] [Google Scholar]
- 40.Saeed AI, et al. TM4 microarray software suite. Methods in enzymology. 2006;411:134–193. doi: 10.1016/S0076-6879(06)11009-5. [DOI] [PubMed] [Google Scholar]
Associated Data
This section collects any data citations, data availability statements, or supplementary materials included in this article.