

Abstract
Few randomized trials have compared visit‐to‐visit variability (VVV) of systolic blood pressure (SBP) across drug classes. The authors compared VVV of SBP among 24,004 participants randomized to chlorthalidone, amlodipine, or lisinopril in the Antihypertensive and Lipid‐Lowering Treatment to Prevent Heart Attack Trial (ALLHAT). VVV of SBP was calculated across 5 to 7 visits occurring 6 to 28 months following randomization. The standard deviation (SD) of SBP was 10.6 (SD=5.0), 10.5 (SD=4.9), and 12.2 (SD=5.8) for participants randomized to chlorthalidone, amlodipine, and lisinopril, respectively. After multivariable adjustment including mean SBP across visits and compared with participants randomized to chlorthalidone, participants randomized to amlodipine had a 0.36 (standard error [SE]: 0.07) lower SD of SBP and participants randomized to lisinopril had a 0.77 (SE=0.08) higher SD of SBP. Results were consistent using other VVV of SBP metrics. These data suggest chlorthalidone and amlodipine are associated with lower VVV of SBP than lisinopril.
Visit‐to‐visit variability (VVV) of systolic blood pressure (SBP) has been associated with an increased risk for stroke, coronary heart disease (CHD), and mortality in several studies.1, 2, 3 Based on these data, approaches to lower VVV of SBP have become an area of interest for research studies. Calcium channel blockers (CCBs), angiotensin‐converting enzyme (ACE) inhibitors, and diuretics are commonly used agents among patients initiating antihypertensive therapy.4, 5 However, few data are available directly comparing the effects of these drug classes on VVV of SBP. Webb and colleagues6 conducted a meta‐analysis of randomized controlled trials of antihypertensive therapy using interindividual variance of SBP as a surrogate for VVV of SBP. They determined that CCBs and non‐loop diuretics lowered blood pressure (BP) variability while ACE inhibitors resulted in higher BP variability compared with all other antihypertensive classes. When compared head‐to‐head, CCBs were associated with lower interindividual BP variability than diuretics. However, this study did not have data on patient‐level (intraindividual) VVV of SBP and the validity of interindividual variability as a proxy for VVV of SBP is unclear.
The 2013 European Society of Hypertension guidelines mentioned the need for analyses of large‐scale trials to determine whether a “drug class” effect on VVV of SBP should be used in guiding treatment.7 The goal of the current analysis was to compare the effects of chlorthalidone, amlodipine, and lisinopril on VVV of SBP. To address this goal, we conducted a secondary data analysis that included a post‐hoc comparison of VVV of SBP among participants randomized to these drugs in the Antihypertensive and Lipid‐Lowering Treatment to Prevent Heart Attack Trial (ALLHAT). Also, we compared the effects of these antihypertensive medications on VVV of diastolic BP (DBP).
Methods
ALLHAT was a multicenter randomized controlled trial sponsored by the National Heart, Lung, and Blood Institute of the US National Institutes of Health.8 It was designed to determine whether the occurrence of fatal CHD or nonfatal myocardial infarction is lower for high‐risk hypertensive individuals treated with amlodipine, lisinopril, or doxazosin, each compared with those treated with chlorthalidone. The randomization in ALLHAT was performed in a ratio of 1.7:1:1 for chlorthalidone, amlodipine, and lisinopril. These ratios were chosen in accordance with Dunnett's procedure for comparing 3 treatment groups to a single control group.9 A total of 42,418 study participants were recruited at 623 clinical sites across the United States, Canada, Puerto Rico, and the US Virgin Islands between February 1994 and January 1998. Because the doxazosin treatment arm was stopped early due to an excess of cardiovascular disease (CVD) events along with little chance of finding a CHD benefit compared with the chlorthalidone arm, it was not investigated in the current study.10 Main results for the comparison of participants randomized to chlorthalidone, amlodipine, and lisinopril were published in December 2002.11
Study Visits, BP Measurements, and Calculation of VVV of BP
To calculate VVV of BP, we used data from the 7 follow‐up visits that occurred 6, 9, 12, 16, 20, 24, and 28 months following randomization. In ALLHAT, a substantial reduction in mean BP occurred between randomization and the 6‐month follow‐up visit (6–10 mm Hg for SBP and ~5 mm Hg for DBP), likely reflecting the effect of adding new medications and increasing medication doses.11 The reduction in mean BP was much less during the subsequent follow‐up period. Therefore, we chose to begin the VVV of BP assessment period at the 6‐month follow‐up visit. Since the precision of VVV of BP estimates increases with a larger number of visits, we restricted our primary analysis to participants with 5, 6, or 7 visits with BP measurements between month 6 and 28 of follow‐up.12 As previously described, BP was measured two times by trained observers following standardized techniques at each follow‐up visit. For the current analysis, BP measurements were calculated as the average of two readings at each visit.
Four VVV of BP metrics were calculated: standard deviation (SD), average real variability (ARV), peak value, and standard deviation independent of the mean (SDIM). Descriptions of how these metrics are calculated are provided in Figure S1.13 While we considered additional VVV of BP metrics, prior research has demonstrated that other metrics contain nearly identical information to the 4 metrics analyzed.12
Covariate Information
Covariates were selected a priori based on their potential role as confounders. Data from the baseline (pre‐randomization) ALLHAT study visit included age, sex, race, ethnicity, use of antihypertensive medication, history of myocardial infarction or stroke, height and weight, left ventricular hypertrophy by electrocardiography or echocardiography, history of type 2 diabetes, current cigarette smoking, high‐density lipoprotein cholesterol <35 mg/dL, documentation of other atherosclerotic CVD, and the presence of ST depression and T‐wave inversion. Total cholesterol and serum creatinine were measured at the ALLHAT study laboratory. Estimated glomerular filtration rate (eGFR) was calculated using the Chronic Kidney Disease Epidemiology Study (CKD‐EPI) equation.14 Data collected at visits conducted 6 to 28 months following randomization were used to calculate the following covariates: mean SBP and DBP across the visits, the use of antihypertensive medications beyond the randomization drug, changes in antihypertensive medication regimen, use of statins, and low adherence to antihypertensive medications. Changes in antihypertensive medication regimen included adding, stopping, or changing the dose of ≥1 antihypertensive medication.
Statistical Analysis
The 33,357 participants randomized to chlorthalidone, amlodipine, or lisinopril form the base population for the current analyses. After excluding 9353 participants who had BP data from <5 follow‐up visits between months 6 and 28 of follow‐up, 24,004 participants were available for our primary analyses.
Characteristics of participants included and excluded from the current analyses were calculated stratified by randomization assignment. Mean values for the 4 VVV of BP metrics were calculated by randomization assignment with the difference in values determined after multivariable adjustment. Four nested models were constructed. The first model included adjustment for age, race/ethnicity, and sex. The second model included additional adjustment for baseline BMI, eGFR, diabetes, total cholesterol, history of MI or stroke, history of coronary revascularization, history of other atherosclerotic cardiovascular disease, major ST depression or T‐wave inversion, left ventricular hypertrophy by electrocardiogram, low HDL cholesterol, and use of antihypertensive medications prior to study randomization. The third model additionally included medication adherence, use of antihypertensive medications beyond the randomized drug, changes in antihypertensive medication regimen, statin use at any of the visits used to calculate VVV of SBP and number of visits used to calculate VVV of SBP. A final model also included mean SBP across the visits used to calculate VVV of SBP. We repeated the above analyses using multiple imputation to fill in missing BP data from the month 6 to 28 study visits and then recalculated VVV of SBP. Multiple imputation was performed using chained equations and 10 data sets.15, 16 In sensitivity analyses, we calculated differences for each VVV of SBP metric across randomization groups after excluding individuals (1) with CHD or stroke events prior to the 28‐month visit, (2) with low adherence to their antihypertensive medication, (3) taking antihypertensive drugs other than the one to which they were randomized, and (4) not taking the drug to which they were randomized.
To investigate the long‐term effect of drug classes on VVV of BP, we restricted our analyses to 15,035 participants who had BP data from ≥5 of the 7 follow‐up visits between months 6 and 28 following randomization and ≥5 of the 7 follow‐up visits between months 32 and 56 of follow‐up. We calculated the intraclass correlation coefficient to assess the intraindividual reproducibility of SD of SBP from month 6 to 28 of follow‐up (early follow‐up) through months 32 to 56 of follow‐up (late follow‐up). Also, we calculated SD of SBP during the early and late follow‐up periods by randomization assignment with differences determined after the 4 levels of adjustment described above. All analyses were conducted in Stata 12.0 (Stata Corporation, College Station, TX).
Results
Characteristics of participants included and excluded from the current analyses are provided by randomization assignment in Table S1. Differences in baseline characteristics of participants included in the current analysis across randomization assignment were small and not statistically significant (Table 1). The mean SBP during follow‐up was lowest among participants randomized to chlorthalidone. On average, participants randomized to chlorthalidone and amlodipine were less likely to change antihypertensive medication regimen compared with participants randomized to lisinopril. Among participants randomized to chlorthalidone, amlodipine, and lisinopril, 76%, 77%, and 68%, respectively, were taking their randomization drug at every visit between months 6 and 28 of follow‐up and 57%, 59%, and 65%, respectively, were taking other antihypertensive medications in addition to their randomization drug (Table S2). Other antihypertensive drug classes being taken by participants between months 6 and 28 of follow‐up are presented in Table S2.
Table 1.
Characteristics of ALLHAT Participants With Blood Pressure Measurement Data Available From 5, 6, or 7 Visits Between 6 and 28 Months of Follow‐up by Randomization Assignment (n=24,004)
| Chlorthalidone (n=11,115) | Amlodipine (n=6554) | Lisinopril (n=6335) | C vs A P Value a | C vs L P Value a | A vs L P Value a | |
|---|---|---|---|---|---|---|
| Age, mean (SD), y | 66.8 (7.5) | 66.8 (7.5) | 66.7 (7.5) | .97 | .69 | .75 |
| Men, No. (%) | 6063 (54.6) | 3557 (54.3) | 3550 (56.0) | .72 | .057 | .044 |
| Non‐hispanic white, No. (%) | 5767 (51.9) | 3423 (52.2) | 3314 (52.3) | .66 | .59 | .92 |
| Non‐hispanic black, n (%) | 3403 (30.6) | 2043 (31.2) | 1939 (30.6) | .44 | .99 | .49 |
| Hispanic white, No. (%) | 1128 (10.2) | 640 (9.8) | 635 (10.0) | .41 | .79 | .62 |
| Hispanic black, No. (%) | 229 (2.1) | 142 (2.2) | 124 (2.0) | .63 | .64 | .40 |
| BMI, mean (SD), kg/m2 | 29.8 (6.1) | 29.8 (6.1) | 29.8 (6.1) | .69 | .89 | .63 |
| Diabetes, No. (%) | 3930 (35.4) | 2340 (35.7) | 2200 (34.7) | .64 | .40 | .25 |
| Total cholesterol, mean (SD), mg/dL | 215.6 (43.0) | 216.2 (43.4) | 215.4 (41.5) | .42 | .74 | .31 |
| Low HDL cholesterol (<35 mg/dL), No. (%) | 1418 (12.8) | 801 (12.2) | 811 (12.8) | .30 | .93 | .32 |
| History of MI or stroke, No. (%) | 2587 (23.3) | 1469 (22.4) | 1423 (22.5) | .19 | .22 | .95 |
| History of revascularization, No. (%) | 1516 (13.6) | 847 (12.9) | 886 (14.0) | .18 | .52 | .077 |
| History of other ASCVD, No. (%) | 2675 (24.1) | 1622 (24.8) | 1516 (23.9) | .31 | .84 | .28 |
| Major ST depression or T‐wave inversion, No. (%) | 1128 (10.3) | 671 (10.4) | 654 (10.4) | .85 | .71 | .87 |
| LVH, No. (%) | 1751 (15.8) | 1125 (17.2) | 1044 (16.5) | .014 | .21 | .30 |
| Use of antihypertensive medication prior to baseline, No. (%) | 10136 (91.2) | 5967 (91.0) | 5740 (90.6) | .74 | .20 | .39 |
| eGFR, mean (SD), mL/min/1.73 m2 | 74.2 (17.6) | 74.8 (17.6) | 74.4 (17.6) | .037 | .44 | .25 |
| Baseline SBP, mean (SD), mm Hg | 145.7 (15.6) | 145.9 (15.7) | 145.9 (15.5) | .43 | .39 | .95 |
| Baseline DBP, mean (SD), mm Hg, | 83.7 (10.0) | 83.7 (10.1) | 83.8 (10.0) | .89 | .70 | .64 |
| Follow‐up SBP, mean (SD), mm Hg, | 136.4 (11.2) | 137.8 (10.2) | 139.1 (13.0) | <.001 | <.001 | <.001 |
| Follow‐up DBP, mean (SD), mm Hg, | 78.8 (6.9) | 78.2 (7.0) | 79.1 (7.6) | <.001 | .002 | <.001 |
| Low adherence at any visit, b No. (%) | 1573 (14.2) | 980 (15.0) | 971 (15.3) | .14 | .034 | .55 |
| Changes in medication regimen, b No. (%) | 5076 (45.7) | 3147 (48.0) | 3511 (55.4) | .003 | <.001 | <.001 |
| Taking statin, b No. (%) | 3933 (35.4) | 2316 (35.3) | 2257 (35.6) | .95 | .75 | .73 |
| BP measurements, No. | ||||||
| 5 | 1293 (11.6) | 769 (11.7) | 852 (13.5) | .84 | <.001 | .003 |
| 6 | 2655 (23.9) | 1564 (23.9) | 1543 (24.4) | .97 | .49 | .51 |
| 7 | 7167 (64.5) | 4221 (64.4) | 3940 (62.2) | .92 | .003 | .009 |
Abbreviations: A, amlodipine; ASCVD, atherosclerotic vascular disease; BMI, body mass index; C, chlorthalidone; DBP, diastolic blood pressure; eGFR, estimated glomerular filtration rate; L, lisinopril; LVH, left ventricular hypertrophy; SBP, systolic blood pressure; SD, standard deviation. Baseline blood pressure is based on the average of two measurements taken at prerandomization visit. Follow‐up mean blood pressure is based on the average across the 7 visits occurring between 6 and 28 months following baseline. aTest of differences between treatment groups. bAt any visit from month 6 to 28 of follow‐up.
Randomization Assignment and VVV of SBP
Each measure of VVV of SBP was lower among participants randomized to chlorthalidone and amlodipine compared with those randomized to lisinopril (Figure 1 and Table S3). SDIM, but not SD, ARV, or peak value, was statistically significantly lower among participants randomized to amlodipine compared with chlorthalidone. All 4 VVV of SBP metrics were lower among participants randomized to amlodipine vs chlorthalidone after full multivariable adjustment (Figure 2 and Table S3, Model 4). Results were similar after excluding participants who had a CHD or stroke event before month 28 of follow‐up, participants with low adherence to their antihypertensive medication, and participants not taking the drug to which they were randomized at every visit from month 6 to 28 (Table 2). The difference between participants randomized to amlodipine and chlorthalidone was not statistically significant after excluding participants taking antihypertensive medications other than their randomization drug. After imputing missing BP values, participants randomized to amlodipine and chlorthalidone had lower VVV of SBP compared with participants randomized to lisinopril and, after multivariable adjustment, the differences between participants randomized to chlorthalidone and amlodipine were only statistically significant for peak value (Table S4).
Figure 1.
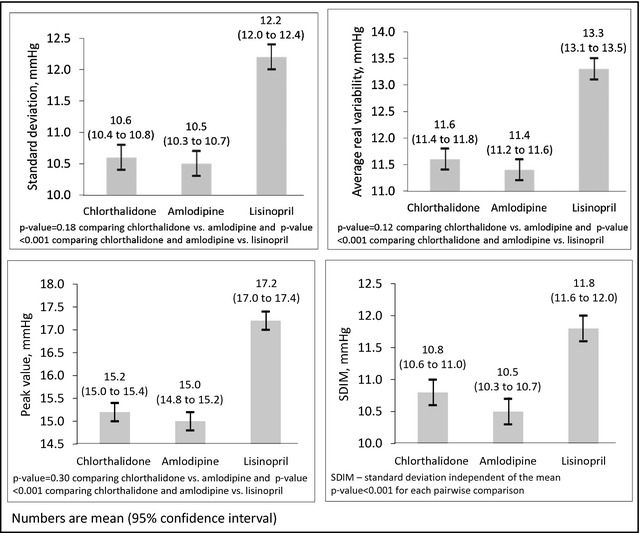
Visit‐to‐visit variability of systolic blood pressure across the 6‐ to 28‐month follow‐up visits by randomization assignment.
Figure 2.
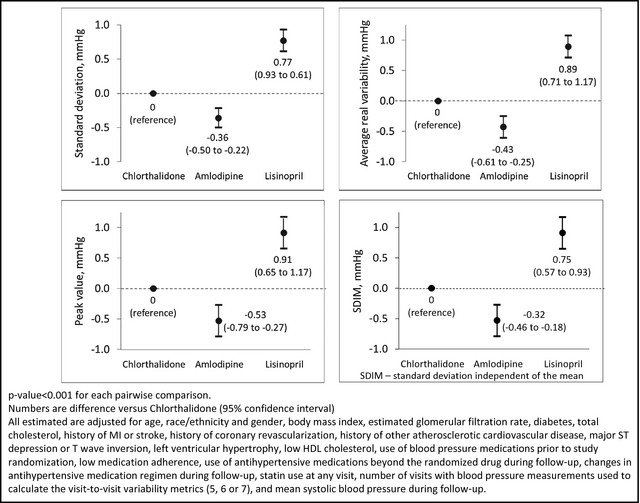
Adjusted difference in visit‐to‐visit variability of systolic blood pressure across the 6‐ to 28‐month follow‐up visits by randomization assignment.
Table 2.
Differences in Visit‐to‐Visit Variability of Systolic Blood Pressure Across the 6‐ to 28‐Month Follow‐up Visits by Randomization Assignment After Excluding Select Populations
| Chlorthalidone | Amlodipine | Lisinopril | C vs A P Value | C vs L P Value | A vs L P Value | |
|---|---|---|---|---|---|---|
| A. After excluding individuals with CHD or stroke events prior to the 28‐month visit | N=10,624 | N=6269 | N=6043 | |||
| SD, mean (SD) | 10.5 (5.0) | 10.4 (4.8) | 12.1 (5.8) | .11 | <.001 | <.001 |
| Adjusted difference (SE) | 0 (ref) | −0.37 (0.08) | 0.78 (0.08) | <.001 | <.001 | <.001 |
| Average real variability, mean (SD) | 11.5 (6.0) | 11.4 (5.8) | 13.2 (7.1) | .089 | <.001 | <.001 |
| Adjusted difference (SE) | 0 (ref) | −0.45 (0.09) | 0.91 (0.10) | <.001 | <.001 | <.001 |
| Peak value, mean (SD) | 15.1 (8.6) | 14.9 (8.2) | 17.1 (9.7) | .16 | <.001 | <.001 |
| Adjusted difference (SE) | 0 (ref) | −0.57 (0.13) | 0.90 (0.13) | <.001 | <.001 | <.001 |
| SDIM, mean (SD) | 10.7 (4.7) | 10.4 (4.4) | 11.8 (5.1) | <.001 | <.001 | <.001 |
| Adjusted difference (SE) | 0 (ref) | −0.33 (0.07) | 0.76 (0.08) | <.001 | <.001 | <.001 |
| B. After excluding individuals with low adherence at any visit | N=9542 | N=5574 | N=5364 | |||
| SD, mean (SD) | 10.4 (4.9) | 10.3 (4.8) | 11.9 (5.8) | .24 | <.001 | <.001 |
| Adjusted difference (SE) | 0 (ref) | −0.34 (0.08) | 0.77 (0.08) | <.001 | <.001 | <.001 |
| Average real variability, mean (SD) | 11.4 (6.0) | 11.3 (5.7) | 13.0 (7.0) | .18 | <.001 | <.001 |
| Adjusted difference (SE) | 0 (ref) | −0.41 (0.10) | 0.88 (0.10) | <.001 | <.001 | <.001 |
| Peak value, mean (SD) | 14.9 (8.4) | 14.8 (8.2) | 16.9 (9.7) | .53 | <.001 | <.001 |
| Adjusted difference (SE) | 0 (ref) | −0.47 (0.14) | 0.93 (0.14) | .001 | <.001 | <.001 |
| SDIM, mean (SD) | 10.7 (4.7) | 10.4 (4.5) | 11.7 (5.1) | <.001 | <.001 | <.001 |
| Adjusted difference (SE) | 0 (ref) | −0.30 (0.08) | 0.76 (0.08) | <.001 | <.001 | <.001 |
| C. After excluding individuals not taking randomized drug at any visit from 6 to 28 months | N=9010 | N=5351 | N=4632 | |||
| SD, mean (SD) | 10.2 (4.7) | 10.1 (4.5) | 11.7 (5.6) | .33 | <.001 | <.001 |
| Adjusted difference (SE) | 0 (ref) | −0.34 (0.08) | 0.84 (0.08) | <.001 | <.001 | <.001 |
| Average real variability, mean (SD) | 11.1 (5.8) | 11.0 (5.4) | 12.8 (6.8) | .098 | <.001 | <.001 |
| Adjusted difference (SE) | 0 (ref) | −0.44 (0.10) | 0.97 (0.10) | <.001 | <.001 | <.001 |
| Peak value, mean (SD) | 14.7 (8.3) | 14.6 (8.0) | 16.7 (9.6) | .52 | <.001 | <.001 |
| Adjusted difference (SE) | 0 (ref) | −0.51 (0.14) | 1.03 (0.15) | <.001 | <.001 | <.001 |
| SDIM, mean (SD) | 10.5 (4.5) | 10.2 (4.3) | 11.5 (5.0) | <.001 | <.001 | <.001 |
| Adjusted difference (SE) | 0 (ref) | −0.29 (0.08) | 0.82 (0.08) | <.001 | <.001 | <.001 |
| D. After excluding individuals taking antihypertensive medications other than randomized drug | N=4819 | N=2667 | N=2232 | |||
| SD, mean (SD) | 9.1 (4.1) | 9.2 (4.0) | 9.8 (4.5) | .29 | <.001 | .001 |
| Adjusted difference (SE) | 0 (ref) | −0.16 (0.10) | 0.70 (0.11) | .14 | <.001 | <.001 |
| Average real variability, mean (SD) | 10.0 (5.2) | 10.1 (4.9) | 10.7 (5.5) | .73 | <.001 | .001 |
| Adjusted difference (SE) | 0 (ref) | −0.25 (0.12) | 0.68 (0.13) | .063 | <.001 | <.001 |
| Peak value, mean (SD) | 13.0 (7.4) | 13.1 (7.2) | 13.8 (8.1) | .54 | .001 | .002 |
| Adjusted difference (SE) | 0 (ref) | −0.39 (0.18) | 0.86 (0.19) | .040 | <.001 | <.001 |
| SDIM, mean (SD) | 9.9 (4.3) | 9.6 (4.1) | 10.6 (4.7) | .030 | <.001 | <.001 |
| Adjusted difference (SE) | 0 (ref) | −0.12 (0.11) | 0.75 (0.11) | .29 | <.001 | <.001 |
| E. After excluding individuals with CHD or stroke events prior to the 28‐month visit, low adherence, or taking antihypertensive medications other than randomized drug | N=4033 | N=2186 | N=1876 | |||
| SD, mean (SD) | 8.9 (4.0) | 9.0 (3.9) | 9.6 (4.5) | .59 | <.001 | <.001 |
| Adjusted difference (SE) | 0 (ref) | −0.17 (0.11) | 0.70 (0.11) | .13 | <.001 | <.001 |
| Average real variability, mean (SD) | 9.8 (5.0) | 9.8 (4.7) | 10.5 (5.5) | .98 | <.001 | .001 |
| Adjusted difference (SE) | 0 (ref) | −0.26 (0.13) | 0.70 (0.14) | .074 | <.001 | <.001 |
| Peak value, mean (SD) | 12.7 (7.1) | 12.8 (7.0) | 13.5 (7.9) | .75 | <.001 | .001 |
| Adjusted difference (SE) | 0 (ref) | −0.38 (0.19) | 0.89 (0.20) | .056 | <.001 | <.001 |
| SDIM, mean (SD) | 9.7 (4.2) | 9.5 (4.1) | 10.5 (4.6) | .019 | <.001 | <.001 |
| Adjusted difference (SE) | 0 (ref) | −0.13 (0.11) | 0.76 (0.12) | .31 | <.001 | <.001 |
Abbreviations: CHD, coronary heart disease; SD, standard deviation; SE, standard error; SDIM, standard deviation independent of the mean. Adjustment is similar to Model 4 in Table 2 and includes adjustment for age, race/ethnicity, sex, body mass index, estimated glomerular filtration rate, diabetes, total cholesterol, history of myocardial infarction or stroke, history of coronary revascularization, history of other atherosclerotic cardiovascular disease, major ST depression or T‐wave inversion, left ventricular hypertrophy, low high‐density lipoprotein cholesterol, use of blood pressure medications prior to study randomization, statin use at any visit, low medication adherence (panels A, C, and D only), use of antihypertensive medications other than the randomized drug during follow‐up (panels A, B, and C only), changes in antihypertensive medication regimen during follow‐up (panels A, B, and C only), number of visits with blood pressure measurements used to calculate the visit‐to‐visit variability metrics (5, 6, or 7), and mean SBP during follow‐up.
Short‐ vs Long‐Term Effects of Randomization
The intraclass correlation coefficient for SD of SBP using visits conducted 6 to 28 months following randomization and 32 to 56 months following randomization was 0.29 (95% confidence interval [CI], 0.28–0.31). Among the 15,035 participants with BP measurements at ≥5 visits between months 6 through 28 and months 32 through 56 of follow‐up, the mean SD of SBP was similar for those randomized to chlorthalidone and amlodipine and higher for those randomized to lisinopril (Table S5).
VVV of DBP
The SD of DBP was 6.4 mm Hg (SD=2.7), 6.2 mm Hg (SD=2.6), and 6.9 mm Hg (SD=2.9) among participants randomized to chlorthalidone, amlodipine, and lisinopril, respectively (Table S6). In a full multivariable adjusted model and compared with participants randomized to chlorthalidone, participants randomized to amlodipine had a lower SD of DBP and those randomized to lisinopril had a higher SD of DBP (each P<.001). This pattern was also present when using ARV, peak value, and SDIM as measures of VVV of DBP.
Discussion
Randomization to chlorthalidone or amlodipine was associated with lower VVV of BP when compared with randomization to lisinopril in this secondary analysis of ALLHAT data. These associations were consistent when we used SD, ARV, peak value, or SDIM to define VVV of SBP and in a number of sensitivity analyses. After multivariable adjustment and compared with participants randomized to chlorthalidone, those randomized to amlodipine had lower VVV of SBP. However, this difference was relatively small and after excluding individuals taking antihypertensive medications other than the drug to which they were randomized, the difference in VVV of SBP between those randomized to chlorthalidone and amlodipine was no longer statistically significant. Although randomization to amlodipine was associated with lower VVV of DBP and lisinopril was associated with higher VVV of DBP, each compared with randomization to chlorthalidone, the differences in VVV of DBP across randomization arms were small.
In past secondary analyses of randomized controlled trials, CCBs have been associated with lower VVV of BP compared with β‐blockers.17, 18 However, these studies did not have data to make head‐to‐head comparisons of diuretics, CCBs, and ACE inhibitors on VVV of BP. Webb and colleagues conducted a meta‐analysis evaluating antihypertensive medication classes on interindividual BP variability. Interindividual variability measured by the variance ratio has been reported to capture about 50% of intraindividual BP variability.1 In the meta‐analysis, the variance ratio was calculated as the between‐individual variance after 1 year of treatment divided by the between‐individual variance at baseline. A variance ratio <1 indicates lower BP variability. The variance ratios were 0.81 (95% CI, 0.76–0.86) and 0.87 (95% CI, 0.79–0.96) for CCBs and diuretics vs all other drug classes, respectively. In a head‐to‐head comparison, CCBs were associated with lower interindividual variance than diuretics (variance ratio, 0.89; 95% CI, 0.86–0.92). In contrast to ALLHAT, this meta‐analysis did not have individual level data and VVV of BP was not directly calculated. The current study extends the results from this meta‐analysis to individual level data, which allowed us to investigate the effect of different antihypertensive medication classes on VVV of BP after excluding individuals taking other antihypertensive medications, accounting for low adherence, and controlling for several potential confounders.
While we observed statistically significant differences in VVV of SBP across randomization arms in the current analysis, the differences between chlorthalidone and amlodipine vs lisinopril were <2 mm Hg and between chlorthalidone and amlodipine were <0.5 mm Hg. These differences may equate to a relatively small difference in CVD risk. For example, using data from the Anglo‐Scandinavian Cardiac Outcomes Trial Blood Pressure–Lowering Arm, each standard deviation (~5–6 mm Hg) higher SD of SBP was associated with a hazard ratio for stroke or coronary events of 1.50 (95% CI, 1.31–1.72) or <1.10 per 1 mm Hg higher VVV of SBP. The small magnitude of differences in VVV of SBP across drug classes observed in the current analysis does not mean that it is not an important risk factor for CVD outcomes. However, changing between a diuretic, CCB, or ACE inhibitor to lower VVV of SBP may have only a small impact on CVD outcomes.
Reasons for amlodipine or chlorthalidone to be associated with lower VVV of BP or alternatively lisinopril to be associated with higher VVV of BP are not entirely known.19, 20 Impaired endothelial function, inflammation, increased wall stress, baroreceptor dysfunction, and increased sympathetic nervous system activity have each been proposed as possible mechanisms underlying high levels of VVV of SBP.21, 22, 23 Prior studies have shown that thiazide‐type diuretics and CCBs increase arterial compliance through vasodilation.24, 25 In addition, the longer half‐lives of amlodipine and chlorthalidone may explain the lower VVV of BP associated with their use. Investigations of the mechanisms by which amlodipine, chlorthalidone, and lisinopril affect VVV of BP are warranted but are beyond the scope of the current study.
Study Strengths and Limitations
There are many strengths associated with using ALLHAT data to study the association between antihypertensive medication classes and VVV of BP. Most notable is the randomization of participants to 3 commonly used classes of antihypertensive medication. Additional strengths of ALLHAT include its large sample size, the enrollment of a large number of black and Hispanic patients, the measurement of BP following a standardized protocol at set time points, and collection of a large number of potential confounders. However, there are also limitations associated with the current analysis. This was a post‐hoc secondary analysis of ALLHAT, and the hypotheses being tested were not specified prior to the trial. Only two visits were conducted prior to randomization, precluding the assessment of changes in VVV of BP from before to after the initiation of different antihypertensive medication classes. Approximately 30% of ALLHAT participants were excluded because they did not have ≥5 BP measurements during the VVV of BP assessment period. There is a circadian rhythm in BP with a surge in the 2 hours following waking up, substantial variability throughout the day, and dipping at night.26 The time of day participants took their medication and when BP measurements were performed during follow‐up visits may have contributed to VVV of BP. Although participants were advised to take their antihypertensive medication in the morning, being a large simple trial, ALLHAT did not record data on the time of day medication was taken or when BP measurements were performed during follow‐up visits. However, previous studies have found that the correlation between 24‐hour BP variability and VVV of BP is small (r<0.3).27 Finally, the majority of participants were taking antihypertensive medication classes in addition to their randomization drug. However, results were similar when we limited the analysis to participants who were not taking antihypertensive medications other than the one they were randomized to take.
Conclusions
Chlorthalidone and amlodipine were associated with lower VVV of SBP when compared with lisinopril in the current study. Compared with participants randomized to chlorthalidone, those randomized to amlodipine had a modestly lower VVV of BP. The effect of lower VVV of BP associated with use of chlorthalidone and amlodipine on CVD incidence remains to be studied. In the interim, the small differences between randomization to chlorthalidone, amlodipine, and lisinopril in ALLHAT suggest that changing antihypertensive medication classes to lower VVV of BP may have little impact on CVD risk.
Disclosures
Dr Muntner has received research support and an honorarium from Amgen Inc.
Supporting information
Figure S1. Formulas used to calculate visit‐to‐visit variability of blood pressure metrics.
Table S1. Characteristics of included and excluded individuals by randomization assignment.
Table S2. Percentage of participants taking antihypertensive medication classes during follow‐up by randomization assignment.
Table S3. Means and adjusted differences in visit‐to‐visit variability of systolic blood pressure across the 6‐ to 28‐month follow‐up visits by randomization assignment.
Table S4. Mean and adjusted differences in visit‐to‐visit variability of systolic blood pressure from 6‐ to 28‐month follow‐up visits by randomization assignment using multiple imputation to fill in missing blood pressure data.
Table S5. Mean and adjusted differences in standard deviation of systolic blood pressure from the 6‐ to 28‐month follow‐up visits (early period) and the 32‐ to 56‐month follow‐up visits (late period) by randomization assignment.
Table S6. Mean and adjusted differences in visit‐to‐visit variability of diastolic blood pressure across the 6‐ to 28‐month follow‐up visits by randomization assignment.
Acknowledgments
Research reported in this publication was supported by the National Heart, Lung, and Blood Institute of the National Institutes of Health under contracts NO1‐HC‐35130 and HHSN268201100036C and under award number R01 HL110993. The Antihypertensive and Lipid‐Lowering Treatment to Prevent Heart Attack Trial investigators acknowledge study medications contributed by Pfizer, Inc. (amlodipine and doxazosin), AstraZeneca (atenolol and lisinopril), and Bristol‐Myers Squibb (pravastatin) and financial support provided by Pfizer, Inc. The content is solely the responsibility of the authors and does not necessarily represent the official views of the National Institutes of Health.
J Clin Hypertens (Greenwich). 2014;16:323–330. DOI: 10.1111/jch.12290. ©2014 Wiley Periodicals, Inc.
References
- 1. Rothwell PM, Howard SC, Dolan E, et al. Prognostic significance of visit‐to‐visit variability, maximum systolic blood pressure, and episodic hypertension. Lancet. 2010;375:895–905. [DOI] [PubMed] [Google Scholar]
- 2. Muntner P, Shimbo D, Tonelli M, et al. The relationship between visit‐to‐visit variability in systolic blood pressure and all‐cause mortality in the general population: findings from NHANES III, 1988 to 1994. Hypertension. 2011;57:160–166. [DOI] [PubMed] [Google Scholar]
- 3. Shimbo D, Newman JD, Aragaki AK, et al. Association between annual visit‐to‐visit blood pressure variability and stroke in postmenopausal women: data from the Women's Health Initiative. Hypertension. 2012;60:625–630. [DOI] [PMC free article] [PubMed] [Google Scholar]
- 4. Muntner P, Krousel‐Wood M, Hyre AD, et al. Antihypertensive prescriptions for newly treated patients before and after the main antihypertensive and lipid‐lowering treatment to prevent heart attack trial results and seventh report of the Joint National Committee on Prevention, Detection, Evaluation, and Treatment of High Blood Pressure Guidelines. Hypertension. 2009;53:617–623. [DOI] [PubMed] [Google Scholar]
- 5. Player MS, Gill JM, Fagan HB, Mainous AG 3rd. Antihypertensive prescribing practices: impact of the antihypertensive and lipid‐lowering treatment to prevent heart attack trial. J Clin Hypertens. 2006;8:860–864. [DOI] [PMC free article] [PubMed] [Google Scholar]
- 6. Webb AJ, Fischer U, Mehta Z, Rothwell PM. Effects of antihypertensive‐drug class on interindividual variation in blood pressure and risk of stroke: a systematic review and meta‐analysis. Lancet. 2010;375:906–915. [DOI] [PubMed] [Google Scholar]
- 7. Mancia G, Fagard R, Narkiewicz K, et al. 2013 Practice guidelines for the management of arterial hypertension of the European Society of Hypertension (ESH) and the European Society of Cardiology (ESC): ESH/ESC Task Force for the Management of Arterial Hypertension. J Hypertens. 2013;31:1925–1938. [DOI] [PubMed] [Google Scholar]
- 8. Davis BR, Cutler JA, Gordon DJ, et al. Rationale and design for the Antihypertensive and Lipid Lowering Treatment to Prevent Heart Attack Trial (ALLHAT). ALLHAT Research Group. Am J Hypertens. 1996;9:342–360. [DOI] [PubMed] [Google Scholar]
- 9. Dunnett CW. A multiple comparisons procedure for comparing several treatments with a control. J Am Stat Assoc. 1955;60:573–583. [Google Scholar]
- 10. ALLHAT Collaborative Research Group . Major cardiovascular events in hypertensive patients randomized to doxazosin vs chlorthalidone: the antihypertensive and lipid‐lowering treatment to prevent heart attack trial (ALLHAT). JAMA. 2000;283:1967–1975. [PubMed] [Google Scholar]
- 11. Major outcomes in high‐risk hypertensive patients randomized to angiotensin‐converting enzyme inhibitor or calcium channel blocker vs diuretic: the Antihypertensive and Lipid‐Lowering Treatment to Prevent Heart Attack Trial (ALLHAT). JAMA. 2002;288:2981–2997. [DOI] [PubMed] [Google Scholar]
- 12. Levitan EB, Kaciroti N, Oparil S, et al. Relationships between metrics of visit‐to‐visit variability of blood pressure. J Hum Hypertens. 2013;27:589–593. [DOI] [PubMed] [Google Scholar]
- 13. Muntner P, Joyce C, Levitan EB, et al. Reproducibility of visit‐to‐visit variability of blood pressure measured as part of routine clinical care. J Hypertens. 2011;29:2332–2338. [DOI] [PMC free article] [PubMed] [Google Scholar]
- 14. Levey AS, Stevens LA, Schmid CH, et al. A new equation to estimate glomerular filtration rate. Ann Intern Med. 2009;150:604–612. [DOI] [PMC free article] [PubMed] [Google Scholar]
- 15. Azur MJ, Stuart EA, Frangakis C, Leaf PJ. Multiple imputation by chained equations: what is it and how does it work? Int J Methods Psychiatr Res. 2011;20:40–49. [DOI] [PMC free article] [PubMed] [Google Scholar]
- 16. White IR, Royston P, Wood AM. Multiple imputation using chained equations: issues and guidance for practice. Stat Med. 2011;30:377–399. [DOI] [PubMed] [Google Scholar]
- 17. Rothwell PM, Howard SC, Dolan E, et al. Effects of beta blockers and calcium‐channel blockers on within‐individual variability in blood pressure and risk of stroke. Lancet Neurol. 2010;9:469–480. [DOI] [PubMed] [Google Scholar]
- 18. Mancia G, Facchetti R, Parati G, Zanchetti A. Visit‐to‐visit blood pressure variability in the European Lacidipine Study on Atherosclerosis: methodological aspects and effects of antihypertensive treatment. J Hypertens. 2012;30:1241–1251. [DOI] [PubMed] [Google Scholar]
- 19. Rothwell PM. Limitations of the usual blood‐pressure hypothesis and importance of variability, instability, and episodic hypertension. Lancet. 2010;375:938–948. [DOI] [PubMed] [Google Scholar]
- 20. Mancia G. Short‐ and long‐term blood pressure variability: present and future. Hypertension. 2012;60:512–517. [DOI] [PubMed] [Google Scholar]
- 21. Diaz KM, Veerabhadrappa P, Kashem MA, et al. Relationship of visit‐to‐visit and ambulatory blood pressure variability to vascular function in African Americans. Hypertens Res. 2012;35:55–61. [DOI] [PMC free article] [PubMed] [Google Scholar]
- 22. Shan ZZ, Dai SM, Su DF. Arterial baroreflex deficit induced organ damage in sinoaortic denervated rats. J Cardiovasc Pharmacol. 2001;38:427–437. [DOI] [PubMed] [Google Scholar]
- 23. Su DF. Treatment of hypertension based on measurement of blood pressure variability: lessons from animal studies. Curr Opin Cardiol. 2006;21:486–491. [DOI] [PubMed] [Google Scholar]
- 24. Ichihara A, Kaneshiro Y, Sakoda M, et al. Add‐on amlodipine improves arterial function and structure in hypertensive patients treated with an angiotensin receptor blocker. J Cardiovasc Pharmacol. 2007;49:161–166. [DOI] [PubMed] [Google Scholar]
- 25. Zhu Z, Zhu S, Liu D, et al. Thiazide‐like diuretics attenuate agonist‐induced vasoconstriction by calcium desensitization linked to Rho kinase. Hypertension. 2005;45:233–239. [DOI] [PubMed] [Google Scholar]
- 26. Pickering TG, Shimbo D, Haas D. Ambulatory blood‐pressure monitoring. N Engl J Med. 2006;354:2368–2374. [DOI] [PubMed] [Google Scholar]
- 27. Muntner P, Shimbo D, Diaz KM, et al. Low correlation between visit‐to‐visit variability and 24‐h variability of blood pressure. Hypertens Res. 2013;36:940–946. [DOI] [PMC free article] [PubMed] [Google Scholar]
Associated Data
This section collects any data citations, data availability statements, or supplementary materials included in this article.
Supplementary Materials
Figure S1. Formulas used to calculate visit‐to‐visit variability of blood pressure metrics.
Table S1. Characteristics of included and excluded individuals by randomization assignment.
Table S2. Percentage of participants taking antihypertensive medication classes during follow‐up by randomization assignment.
Table S3. Means and adjusted differences in visit‐to‐visit variability of systolic blood pressure across the 6‐ to 28‐month follow‐up visits by randomization assignment.
Table S4. Mean and adjusted differences in visit‐to‐visit variability of systolic blood pressure from 6‐ to 28‐month follow‐up visits by randomization assignment using multiple imputation to fill in missing blood pressure data.
Table S5. Mean and adjusted differences in standard deviation of systolic blood pressure from the 6‐ to 28‐month follow‐up visits (early period) and the 32‐ to 56‐month follow‐up visits (late period) by randomization assignment.
Table S6. Mean and adjusted differences in visit‐to‐visit variability of diastolic blood pressure across the 6‐ to 28‐month follow‐up visits by randomization assignment.