Abstract
Objectives:
To analyse teeth samples by using terahertz time-domain spectroscopy (THz-TDS) system that was developed in the laboratory to measure the properties of sliced teeth sections in transmission mode.
Methods:
Using home-built THz-TDS system, we analysed a total of 25 teeth samples (9 primary and 16 permanent teeth). For transmission measurements, the refractive index and absorptive properties of the teeth sections were calculated. Difference between groups was tested using Mann–Whitney U-test statistics at the specific frequency of 0.5 THz, which was at the midpoint of the bandwidth. Median and minimum–maximum values were given as descriptive statistics. Type-I error rate was taken as α = 0.05.
Results:
Median refractive index values for permanent and primary teeth were found to be 2.53 and 2.54, respectively. Median absorption coefficient values for permanent and primary teeth were found to be 26.29 and 29.67, respectively. Median refractive index values for both healthy and carious teeth were found to be 2.54. Median absorption coefficient values for healthy and carious teeth were found to be 26.52 and 27.13, respectively. Although higher median absorption coefficient values were found for primary and carious teeth than those of permanent and healthy teeth, the differences were insignificant (p > 0.05). In addition, no statistical differences were found for refractive index values among different groups (p > 0.05).
Conclusions:
THz imaging has the potential to be used in assessing dental structures.
Keywords: terahertz time-domain spectroscopy, teeth, characterization
Introduction
In the late 1980s with the work of a few research groups, terahertz time-domain spectroscopy (THz-TDS) was developed and now it has gained remarkable importance for several areas of application. The frequency range for THz waves is between the microwave and far-infrared regions of the electromagnetic spectrum (1 THz wave: wavelength, 300 µm; energy, 4.1 meV). THz waves are highly absorbed by water, are non-ionizing contrary to X-ray and ultraviolet light and are known to be harmless. In addition, they provide sharper images than those of microwaves, and they have high signal-to-noise ratio at THz frequency.1–5 THz studies have attracted much attention in the medical community owing to the inherent non-invasive and non-ionizing nature of the radiation when applied to biological tissues in moderate doses. Biomedical diagnostics for cancer and dermatologic diseases with THz were also reported.6–8
Caries is a widely prevalent disease, and radiographic imaging using X-rays has been the primary diagnostic imaging technique to diagnose caries within the dental profession along with tactile method using a dental explorer.9,10 However, it is an ionizing radiation with some detrimental effects to human health, and demineralization in excess of 40% must occur for the radiographic detection to be possible.9 There are also several other methods for identifying caries, such as the caries-detector dyes and substances such as gels based on papain and laser fluorescence devices. It is of vital importance for the clinician to decide whether the surface is intact or carious in order to determine an accurate treatment plan.9,10
THz imaging has the potential to be used in assessing tooth and periodontal structures without the risk of ionizing the surrounding tissue. For example, in a study, it was shown that THz pulse imaging could quantitatively determine the extent of lesions formed by acid gel ex vivo.11 Therefore, the aim of the present study was to analyse healthy and carious permanent and primary teeth samples using our home-built THz-TDS system.
Methods and Materials
Sample preparation
Ethical approval was obtained from the ethical committee of the Faculty of Dentistry of Ankara University, Ankara, Turkey. Newly extracted 25 human teeth (9 primary and 16 permanent teeth) were cleaned and stored in distilled water. Each tooth was serially sectioned mesiodistally in parallel with the long axis of the crown using a water-cooled diamond saw at low speed so that THz radiation could probe the layered structure of the sample. Afterwards, both sides of each section were examined under a stereomicroscope (×10) (Stemi 2000; Carl Zeiss, Jena, Germany) by one of the authors of the present study. Teeth were recorded as either sound or as having a caries lesion, which was defined as a demineralized white or yellowish-brown discoloured area in the enamel or dentine. Examination of the 25 teeth surfaces revealed caries in 10 and no caries in 15 teeth. Distribution of the studied sample teeth was as follows: sound, permanent teeth, nine samples; carious, permanent teeth, seven samples; sound, deciduous teeth, six samples; and carious, deciduous teeth: three samples.
Analysis of tooth samples with terahertz time-domain spectroscopy
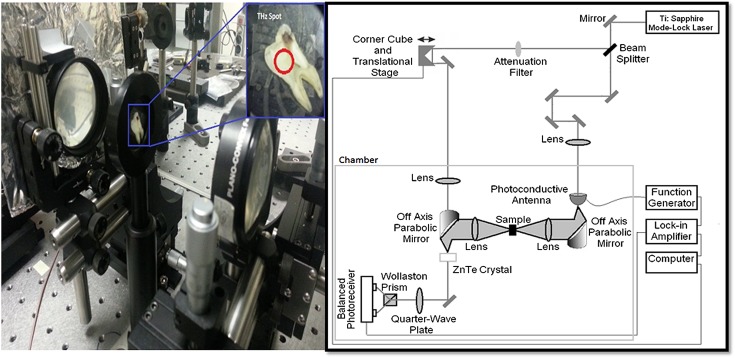
The system that was used for THz-TDS is given in Figure 1. A Ti:Al2O3 mode-lock laser with an average output power of 300 mW, repetition rate of 75 MHz and pulse width of 16 fs was used to drive the home-built THz-TDS spectrometer. The spectrometer was defined by two optical paths: the THz pulse generation and detection arms. After generation of THz pulse with the help of the photoconductive antenna, an off-axis parabolic mirror collimated the beam and a lens [TPX®lens (TYDEX, st Petersburg, Russia), D = 50 mm, F = 100 mm (F#2)] and focused the THz pulse train onto the tooth sample. THz wave was focused on a 5-mm diameter area of the sample. After transmitting through the sample, a second similar lens directed the pulse to another off-axis parabolic mirror, where it focused the pulse onto the detector crystal, which was detected using electro-optic detection methods. Data acquisition and instrument control were carried out with the help of a personal computer. Typically, measurements are carried out in an enclosed box that is purged with nitrogen gas; however, for the purposes of clinical applicability, we conducted the measurements at a relative humidity of about 45%.8,12–15 Figure 1 shows home-made THz-TDS and schematic representation of the THz-TDS system.
Figure 1.
Home-made terahertz (THz) time-domain spectrometer and schematic representation of THz-time-domain spectroscopy system. Ti:Sapphire, titanium doped Sapphire crystal; ZnTe, zinc telluride crystal.
After the measurements of reference scans (without any sample) and sample scans, the time-dependent data were converted to the frequency domain using fast Fourier transform algorithm. Transmittance, phase and absorbance are some of the parameters that are extracted from the frequency domain. Here, changes in refractive index can be interpreted as a representative of the changes in density of the medium, whereas changes in absorption are a combination of both scattering and resonant effects if any. For transmission measurements, the refractive index and absorptive properties of the teeth sections were analysed in the 0.1–1 THz range using the following formula:
 |
 |
where n is refractive index, c is speed of light, d is thickness, Δϕ is phase shift, υ is frequency, α is absorption coefficient and T is transmittance. Loss through the sample is governed by absorption, reflection and transmission assuming that scattering processes are negligent.8,12–15
Difference between teeth groups was tested using Mann–Whitney U-test statistics for the specific frequency of 0.5 THz, which lies at the midpoint of the measurement range. Median and minimum–maximum values were given as descriptive statistics. Type-I error rate was taken as α = 0.05. SPSS® v. 22.0 (SPSS Inc., Chicago, IL) was used for statistical analyses.
Results
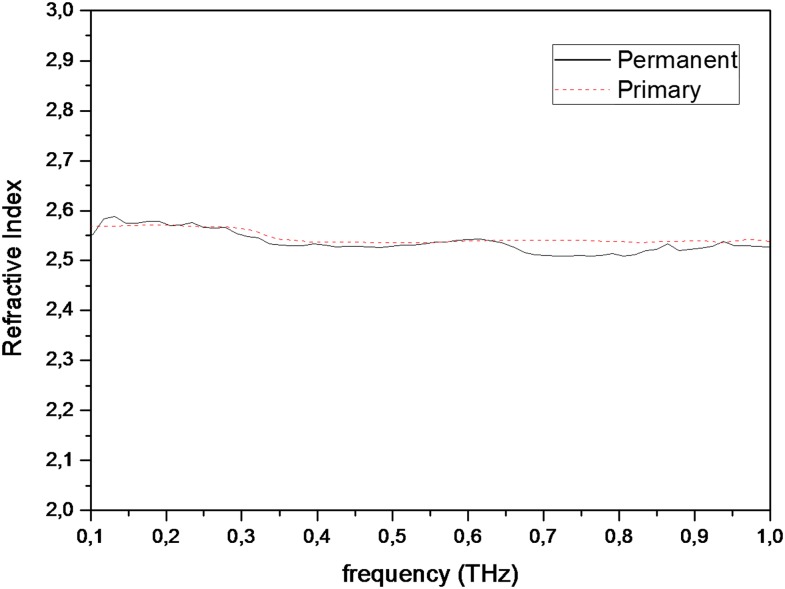
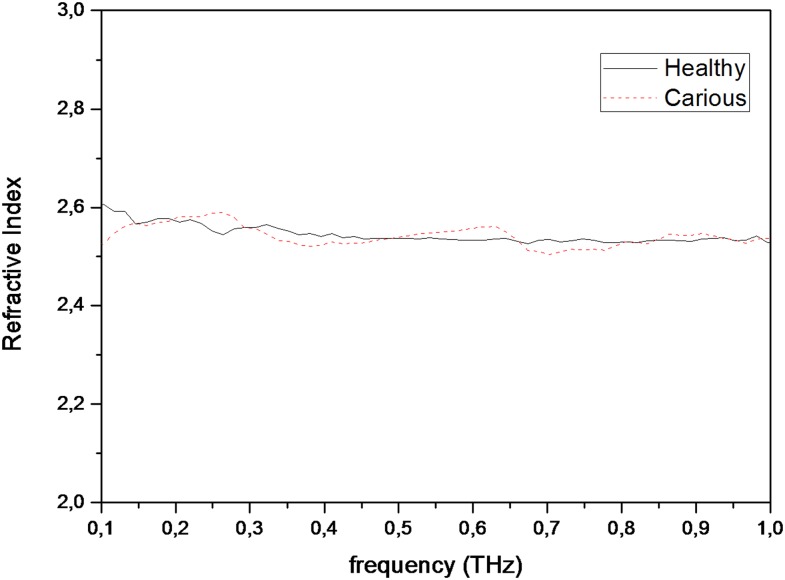
Figures 2 and 3 show graphics of refractive index measurements conducted between 0.1 and 1 THz frequencies, for permanent and primary teeth and carious and healthy teeth, respectively. Median refractive index values for permanent and primary teeth were found to be 2.53 and 2.54, respectively. Median refractive index values for both healthy and carious teeth were found to be 2.54. Table 1 shows median and minimum–maximum values for refractive index measurements obtained at 0.5-THz frequency. The differences for refractive index values among different groups were statistically insignificant (between permanent and primary teeth, p = 0.820; between healthy and carious teeth, p = 0.978).
Figure 2.
Graphics of refractive index measurements conducted for permanent and primary teeth between 0.1- and 1-THz frequencies.
Figure 3.
Graphics of refractive index measurements conducted for carious and healthy teeth between 0.1- and 1-THz frequencies.
Table 1.
Median and minimum–maximum values for refractive index measurements obtained at 0.5-THz frequency
| Tooth type and health status | Median (minimum–maximum) | p-value |
|---|---|---|
| Tooth | ||
| Permanent | 2.53 (2.41–2.67) | 0.820 |
| Primary | 2.54 (2.38–2.64) | |
| Status | ||
| Healthy | 2.54 (2.38–2.67) | 0.978 |
| Carious | 2.54 (2.44–2.66) | |
| Tooth and status | ||
| Permanent | ||
| Healthy | 2.54 (2.41–2.67) | 0.821 |
| Carious | 2.51 (2.44–2.66) | |
| Primary | ||
| Healthy | 2.53 (2.38–2.64) | |
| Carious | 2.59 (2.49–2.59) | |
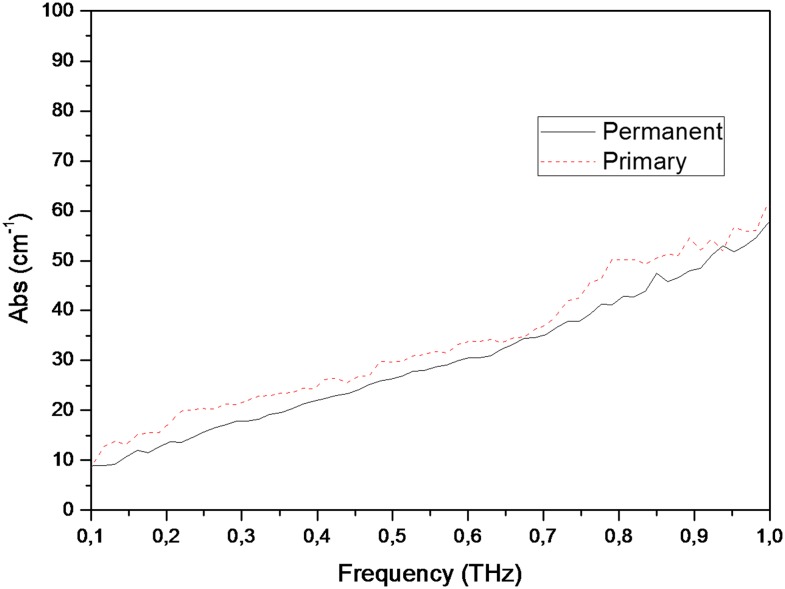
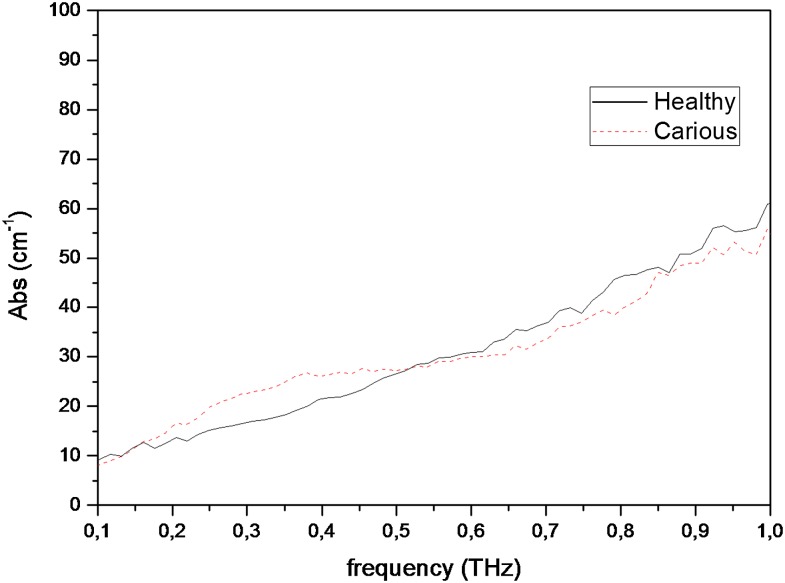
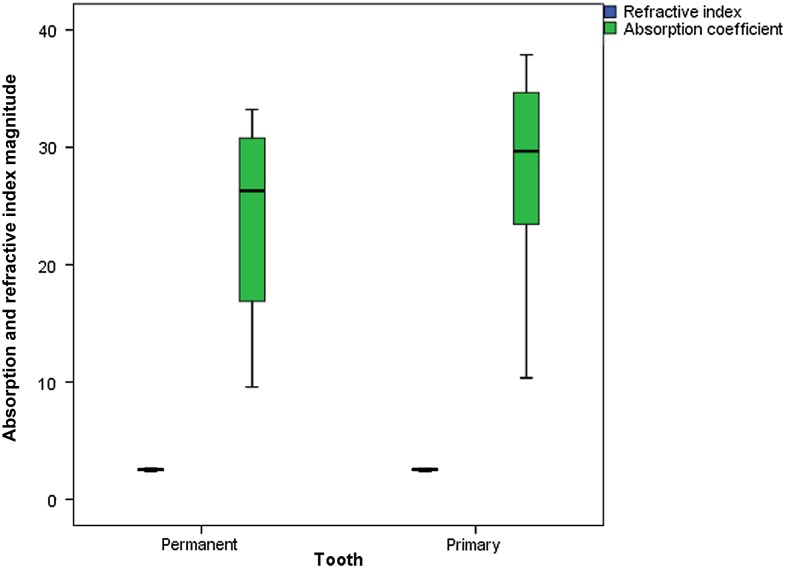
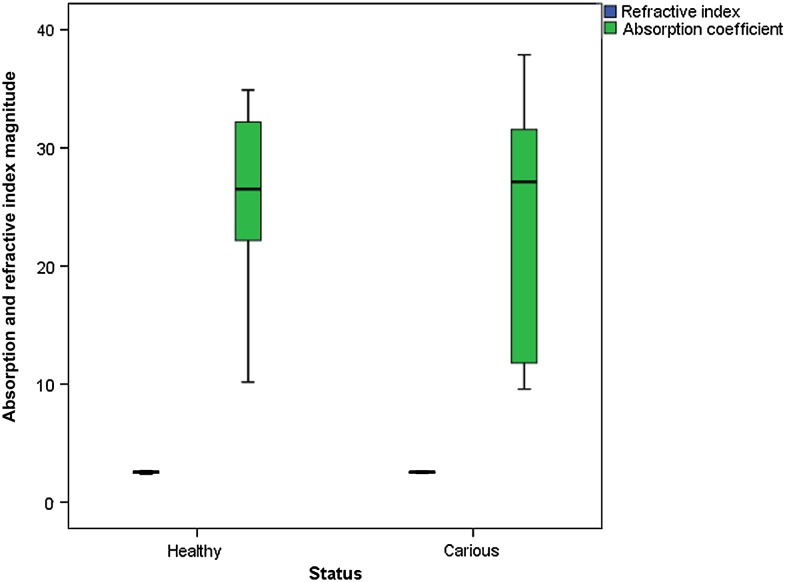
Figures 4 and 5 show graphics of absorption coefficient measurements conducted between 0.1- and 1-THz frequencies, for permanent and primary teeth and carious and healthy teeth, respectively. Table 2 shows median and minimum–maximum values for absorption coefficient measurements obtained at 0.5-THz frequency. Permanent tooth samples were found to have lower absorption coefficient than those of primary samples. Median absorption coefficient values for permanent and primary teeth were found to be 26.29 and 29.67, respectively. Absorption of the carious teeth was higher than those of healthy teeth. Median absorption coefficient values for healthy and carious teeth were found to be 26.52 and 27.13, respectively. The differences for absorption coefficient values among different tooth groups were also found to be statistically insignificant (between permanent and primary teeth, p = 0.301; between healthy and carious teeth, p = 0.849). Figures 6 and 7 show refractive index and absorption coefficient comparisons according to tooth type (permanent or primary) and health status (healthy or carious), respectively.
Figure 4.
Graphics of absorption coefficient measurements conducted for permanent and primary teeth between 0.1- and 1-THz frequencies. Abs, absorption.
Figure 5.
Graphics of absorption coefficient measurements conducted for carious and healthy teeth between 0.1- and 1-THz frequencies. Abs, absorption.
Table 2.
Median and minimum–maximum values for absorption coefficient measurements obtained at 0.5-THz frequency
| Tooth type and health status | Median (minimum–maximum) | p-value |
|---|---|---|
| Tooth | ||
| Permanent | 26.29 (9.57–33.22) | 0.301 |
| Primary | 29.67 (10.35–37.88) | |
| Status | ||
| Healthy | 26.52 (10.17–34.90) | 0.849 |
| Carious | 27.13 (9.57–37.88) | |
| Tooth and status | ||
| Permanent | ||
| Healthy | 25.73 (10.17–33.22) | 0.689 |
| Carious | 28.11 (9.57–31.88) | |
| Primary | ||
| Healthy | 30.62 (17.35–34.90) | |
| Carious | 26.15 (10.35–37.88) | |
Figure 6.
Refractive index and absorption coefficient comparisons according to tooth type (permanent or primary).
Figure 7.
Refractive index and absorption coefficient comparisons according to health status (healthy or carious).
Discussion
THz radiation has gained much interest in the medical community since it is non-ionizing and can be used in applications where one has to image below the surface of the sample. Such attributes make it an ideal technique to investigate its versatility for dental applications. To perform imaging in this frequency range, one does not need to slice the teeth, since the inner structure is being probed. However, in the research presented here, each tooth had to be thinly sliced by a diamond saw in order to effectively measure the refractive index and absorption coefficient. Imaging capacity of THz waves will be analysed using reflection measurements in future research.
The refractive index, in various carious or healthy primary and adult teeth, was measured to be approximately 2.50 with slight variation among the samples at a frequency of 0.5 THz. This is not surprising since we probed a large area of the teeth sample (∼5 mm), which comprises of both dentine and enamel as well as carious material if any. Although the large probing area gave an effective picture of the tooth medium, there were still some notable differences in the spectra. For absorption coefficient values, slight differences were found between permanent and primary teeth. This might be owing to the fact that dentinal tubule diameters are larger in primary teeth than those of permanent teeth. Tubular liquid concentration of primary teeth is also higher than that of permanent teeth liquid concentration16 suggesting higher THz absorption coefficient values for primary teeth samples. In addition, we found higher absorption coefficient values for carious teeth when compared with healthy teeth. There are two possible explanations for this phenomenon. First, the higher absorption capacity of carious tissues than that of healthy tissues can be due to enhanced scattering in carious tissues, which can be brought on by sclerotic dentine formation.16 It has been noted in another study that the changes in porosity of the dental tissue, which result from caries, have a similar scale to THz wavelengths.17 The main argument is that electromagnetic waves such as THz would be expected to be strongly scattered by dielectric objects that have the same scale structure as that of the wavelength. This may suggest that the carious tissue is not absorbing but rather scattering the THz radiation, which is the mechanism for the observed attenuation.17 Another possibility is that because of the porous structure, there might be a higher liquid concentration in carious teeth than in healthy teeth. Furthermore, these differences may be attributed to the density difference of dentinal tubules between the primary and permanent teeth resulting in a change in THz absorption.16
Analogous to our findings, where we measured predominantly the dentine portion of the tooth sections, authors of another study17 found the mean refractive index for dentine to be 2.6. Authors of the mentioned study also suggested that caries appeared as a region of higher absorption relative to healthy structures.17 This finding is in line with our results.
Spectroscopy is useful for the analysis of the composition of the teeth but is hindered by the fact that teeth samples have to be extracted and dissected. THz-TDS systems with imaging configurations not only image the teeth in three dimensions but also eliminate these limitations. Unlike radiography, THz pulse imaging delivers a spectrum of different frequencies for each pixel measured. This offers the possibility of using that spectrum for diagnosis that goes beyond simply measuring mineralization levels.18 Authors described a THz pulse imaging system that can be used to generate images of dental tissue in three dimensions and presented data from a series of 12 human incisors. They successfully detected the enamel–dentine junction in 91% of the cases.18
The development of techniques that utilize THz waves for applications in dentistry is growing evermore rapidly with the development of instrumentation. The measurements performed in this study showed that there were slight differences between various teeth groups assessed, such as permanent and primary teeth as well as carious and healthy teeth. Owing to the large effective measurement area, the differences that were measured among the teeth samples were statistically insignificant. However, the slight variations among different groups suggest that dental structures, such as dentine, enamel or even carious portions, must be analysed with higher resolution.
Conclusion
Overall, THz waves were found to be sensitive to absorptive changes but refractive index changes were similar between different tooth groups. Our findings suggested that THz imaging has the potential to be used in assessing dental structures. Future studies will focus on increasing the resolution of the sampled area, and our future work will also entail development of current home-built THz-TDS systems for imaging teeth upon reflection in three dimensions.
Acknowledgments
Acknowledgments
Authors are grateful to Zeynep Ozer and Burcu Karagoz for their assistance during the study.
References
- 1.Beard MC, Turner GM, Schmuttenmaer CA. Terahertz spectroscopy. J Phys Chem B 2002; 106: 7146–59. [Google Scholar]
- 2.Ferguson B, Zhang XC. Materials for terahertz science and technology. Nat Mater 2002; 1: 26–33. doi: 10.1038/nmat708 [DOI] [PubMed] [Google Scholar]
- 3.Han PY, Tani M, Usami M, Kono S, Kersting R, Zhang XC. A direct comparison between terahertz time-domain spectroscopy and far-infrared Fourier transform spectroscopy. J Appl Phys 2001; 89: 2357. [Google Scholar]
- 4.van Exter M, Grischkowsky D. Characterization of an optoelectronic terahertz beam system. IEEE Trans Microw Theory Tech 1990; 38: 1684–91. [Google Scholar]
- 5.Yu B, Zeng F, Yang Y, Xing Q, Chechin A, Xin X, et al. Torsional vibrational modes of tryptophan studied by terahertz time-domain spectroscopy. Biophys J 2004; 86: 1649–54. doi: 10.1016/S0006-3495(04)74233-2 [DOI] [PMC free article] [PubMed] [Google Scholar]
- 6.Humphreys K, Loughran JP, Gradziel M, Lanigan W, Ward T, Murphy JA, et al. Medical applications of terahertz imaging: a review of current technology and potential applications in biomedical engineering. Conf Proc IEEE Eng Med Biol Soc 2004; 2: 1302–5. [DOI] [PubMed] [Google Scholar]
- 7.Mittleman DM, Gupta M, Neelamani R, Baraniuk RG, Rudd JV, Koch M. Recent advances in terahertz imaging. Appl Phys B Laser Optic 1999; 68: 1085–94. [Google Scholar]
- 8.Fitzgerald AJ, Berry E, Zinovev NN, Walker GC, Smith MA, Chamberlain JM. An introduction to medical imaging with coherent terahertz frequency radiation. Phys Med Biol 2002; 47: R67–84. [DOI] [PubMed] [Google Scholar]
- 9.White SC, Yoon DC. Comparative performance of digital and conventional images for detecting proximal surface caries. Dentomaxillofac Radiol 1997; 26: 32–8. doi: 10.1038/sj.dmfr.4600208 [DOI] [PubMed] [Google Scholar]
- 10.Senel B, Kamburoglu K, Uçok O, Yüksel SP, Ozen T, Avsever H. Diagnostic accuracy of different imaging modalities in detection of proximal caries. Dentomaxillofac Radiol 2010; 39: 501–11. doi: 10.1259/dmfr/28628723 [DOI] [PMC free article] [PubMed] [Google Scholar]
- 11.Pickwell E, Wallace VP, Cole BE, Ali S, Longbottom C, Lynch RJ, et al. A comparison of terahertz pulsed imaging with transmission microradiography for depth measurement of enamel demineralisation in vitro. Caries Res 2007; 41: 49–55. doi: 10.1159/000096105 [DOI] [PubMed] [Google Scholar]
- 12.Ahn J, Efimov V, Averitt R, Taylor AJ. Terahertz waveform synthesis via optical rectification of shaped ultrafast laser pulses. Opt Express 2003; 11: 2486–96. [DOI] [PubMed] [Google Scholar]
- 13.Zhang XC, Xu J, eds. Generation and detection of THz waves. In: Introduction to THz wave photonics. New York, NY: Springer; 2010. pp. 27–48. [Google Scholar]
- 14.Jepsen PU, Fischer BM. Dynamic range in terahertz time-domain transmission and reflection spectroscopy. Opt Lett 2005; 30: 29–31. [DOI] [PubMed] [Google Scholar]
- 15.Pickwell E, Wallace VP. Biomedical applications of terahertz technology. J Phys D: Appl Phys 2006; 39: R301. [Google Scholar]
- 16.Lenzi TL, Guqlielmi Cde A, Arana-Chavez VE, Raqqio DP. Tubule density and diameter in coronal dentin from primary and permanent human teeth. Microsc Microanal 2013; 19: 1445–9. doi: 10.1017/S1431927613012725 [DOI] [PubMed] [Google Scholar]
- 17.Crawley DA, Longbottom C, Cole BE, Ciesla CM, Arnone D, Wallace VP, et al. Terahertz pulse imaging: a pilot study of potential applications in dentistry. Caries Res 2003; 37: 352–9. [DOI] [PubMed] [Google Scholar]
- 18.Crawley D, Longbottom C, Wallace VP, Cole B, Arnone D, Pepper M. Three-dimensional terahertz pulse imaging of dental tissue. J Biomed Opt 2003; 8: 303–7. doi: 10.1117/1.1559059 [DOI] [PubMed] [Google Scholar]


