Summary
To shorten the time between brain harvesting and microglia isolation, and characterization we utilized the MACS® neural dissociation kit followed by OctoMACS® CD11b magnetic bead isolation technique to positively select for brain microglia expressing the pan-microglial marker Cd11b, a key subunit of the Membrane Attack Complex (MAC). This protocol yields a viable and highly pure (> 95%) microglial population of approximately 500,000 cells per pup that is amenable for in vitro characterization within hours or days after being harvested from brain tissue. Primary microglia from C57Bl/6 mice were plated for next day analyses of morphology and cellular markers by immunocytochemistry or for analysis of gene expression under resting or LPS-stimulated conditions. The ease of isolation enables investigators to perform molecular and cellular analyses without having to wait 1–2 weeks to isolate microglia by conventional methods involving mechanical agitation to dislodge the from astrocyte beds.
1. Introduction
Microglia are the monocyte-derived resident macrophages of the brain in charge of immune surveillance (Ransohoff and Perry, 2009). Activated microglia secrete neurotrophic factors to limit tissue injury, protect vulnerable neuronal populations, and aid in brain repair processes. However, activated microglia can also overproduce prostaglandins, chemokines, cytokines, and reactive oxygen and nitrogen species which can have a deleterious effect on neuronal survival by enhancing oxidative stress and activating cell death pathways (reviewed in (McGeer and McGeer, 2004), raising the interesting possibility that chronic microglia activation may contribute to the etiology and/or progression of neurodegenerative disease (reviewed in Tansey et al., 2007). In vitro analyses of microglia phenotype and their effector functions is expected to significantly improve the ability to generate testable hypotheses about the in vivo role of microglia in normal and pathophysiological states in the brain. Yet conventional methods used to obtain homogeneous populations of microglia require maintenance of primary neuron-glia cultures for extended periods of time (from 1 to 2 weeks), increasing the likelihood for loss of morphological and functional microglial phenotype.
2. Materials
2.1 Tissue Harvest and Primary Cell Culture Components
Mice at postnatal day 3–5 (P3–P5)
DMEM/F12 with 10% Heat Inactivated FBS
lipopolysaccharide (LPS E. coli strain O111:B4)
2.2 Magnetic Cell Isolation Components
MACS® neural dissociation it (Miltenyi Biotec)
OctoMACS® CD11b magnetic bead separation (Miltenyi Biotech)
2.3 Immunocytochemistry Components
4% paraformaldehyde in 0.01M PBS pH 7.4
Antibodies for CD45 (Serotec) and CD68 (Serotec)
Alexa dye-conjugated secondary antibodies for immunocytochemistry (Invitrogen)
2.4 Components for Flow Cytometry
F4/80-Texas Red (Caltag) and Cd11b-FITC (Miltenyi Biotec)
Hoechst 33258 (Invitrogen) for nuclear counterstain
2.5 Components for Quantitative PCR
RNA STAT60 (Tel-Test, Friendswood, TX)
DNAse I (Invitrogen)
Superscript II RNAse H-reverse transcriptase (Invitrogen)
SYBR green PCR mastermix (Applied Biosystems Inc.)
Oligonucleotide forward and reverse PCR primers for TNF, IL-1β, iNOS, MIP-1α, CD45 (Integrated DNA Technologies)
ABI Prism 7000 Detection System (Applied Biosystems Inc.)
3. Methods
3.1 Positive selection of primary microglia using CD11b magnetic beads for next day immunocytochemical analyses
Obtain eight postnatal day 3–5 (P3–P5) C57Bl/6 wild-type pups.
Isolate primary microglia using the MACS® neural dissociation kit (Miltenyi Biotec).
Determine the total cell number by trypan-blue exclusion (~ 40 million total).
To enrich for primary microglia, OctoMACS® CD11b magnetic bead separation (Miltenyi Biotech) can be employed according to the protocol provided by the manufacturer. We recommend shortening the centrifugation time from 10 minutes to 5 in order to increase cell viability.
The number of cells obtained post-magnetic CD11b bead isolation will be ~ 4 million or 10% of the total number of cells in the single-cell suspension obtained with the MACS neural dissociation kit, which is in the expected range.
After (1) day in vitro in DMEM/F12 with 10% HI-FBS the cells can be treated with lipopolysaccharide (LPS E. coli strain O111:B4, 10ng/mL or 1 ug/mL for 24 hours) then fixed in 4% paraformaldehyde in 0.01M PBS and processed for fluorescence immunocytochemistry as previously described (McCoy et al., 2006).
Acquire images of stained cells with a fluorescence microscope equipped with a digital camera. [See Notes 1, 2 and 3]
Notes:
1. The antibody dilutions should be as follows: CD45 (Serotec) 1:250, CD68 (Serotec) 1:250, and Hoechst 33258 (Invitrogen) 1:20,000.
2. The appropriate Alexa conjugated secondary antibodies (Invitrogen) should be used at a dilution of 1:1000 in the dark.
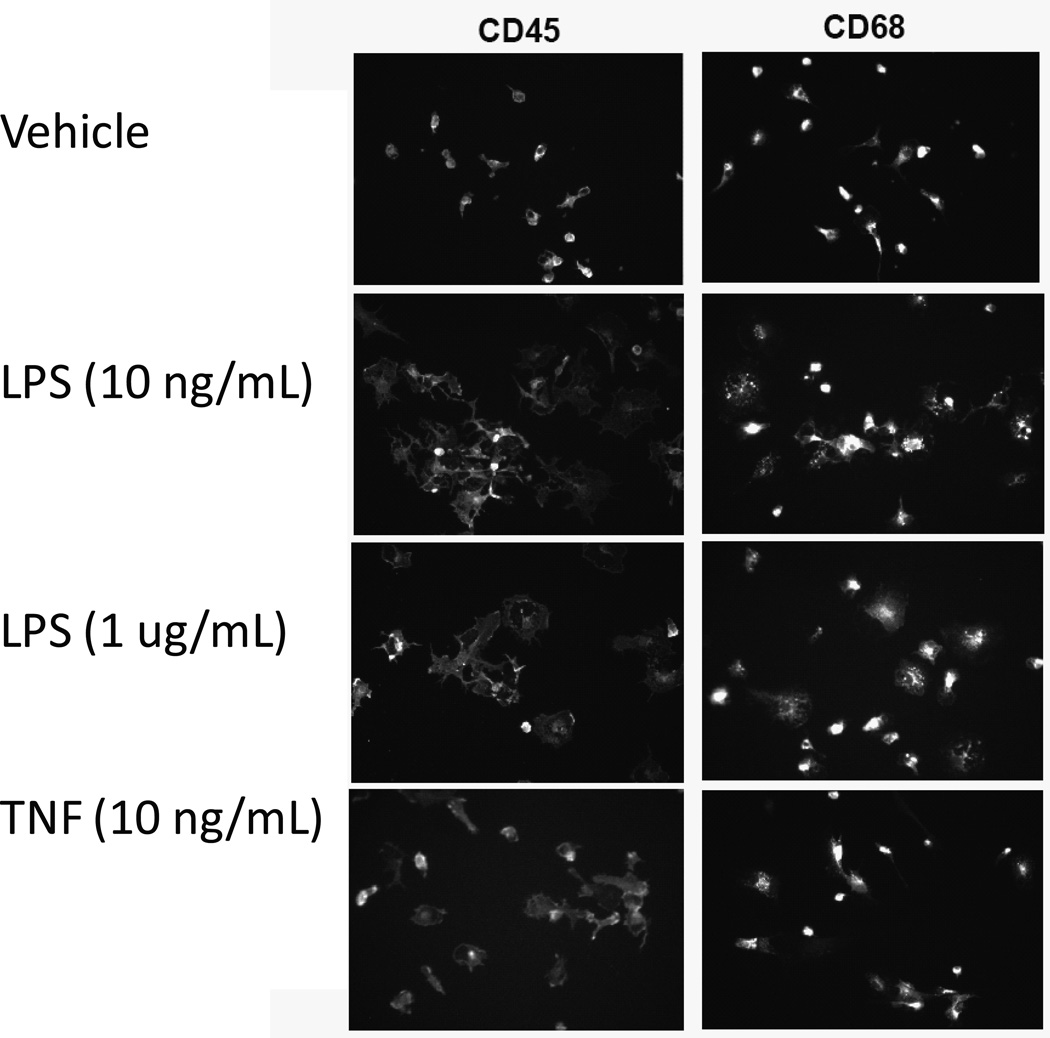
3. Figure 2 illustrates images from a representative experiment demonstrating that the number of cells found to be immunoreactive for CD45 was approximately (99%) and for CD68 was (98%), indicating that the purity of the isolated microglia population is high.
Figure 2. Primary microglia positively selected with CD11b magnetic beads reveal normal morphological changes upon LPS stimulation as measure by immunocytochemistry.
Primary microglial cells were isolated from postnatal day 3–5 (P3–P5) C57Bl/6 pups using the MACS® neural dissociation kit followed by CD11b magnetic bead separation. Cells were plated and treated for 24 hours with LPS or TNF, fixed, and stained with anti-CD45 (Serotec) and anti-CD68 (Serotec). Immunocytochemical analysis revealed morphological changes and increased expression of microglial markers CD45 and CD68 after stimulation LPS or TNF.
3.2 Positive selection of postnatal microglia using CD11b magnetic beads for gene expression analyses induced by inflammatory stimuli
Obtain 10 postnatal day 3–5 (P3–P5) C57Bl/6 wild-type pups.
Isolate primary microglia using the MACS® neural dissociation followed by OctoMACS® Cd11b magnetic bead positive selection.
Plate cells in 6-well plates at a density of 0.5 million/well.
After 2 days in culture in DMEM/F-12 supplemented with 10% FBS, stimulate cells with lipopolysaccharide (LPS, 1ug/mL) for 4 hrs at 37 degrees in a humidified CO2 incubator.
Harvest cells in RNA STAT60 (Tel-Test, Friendswood, TX) for isolation of total RNA and briefly treat with DNAse I (Invitrogen) then reverse transcribe into cDNA using Superscript II RNAse H-reverse transcriptase (Invitrogen). [See Note 4]
Perform real-time quantatitive polymerase chain reaction (qPCR) as previously described (Kurrasch et al., 2004; Lee et al., 2008) using an ABI Prism 7000 Detection System (Applied Biosystems Inc.). [See Note 5]
Notes:
1. All reactions can be done in 384-well format with 50 ng cDNA, 10 uL SYBR green PCR mastermix, and 150 nM each forward and reverse primer. Oligonucleotide primers for TNF, IL-1β, iNOS, MIP-1α, CD45 can be designed using primer design software freely available on the World Wide Web.
2. All reactions should be performed in triplicate and levels of various mRNAs should be normalized to the geometric mean of several housekeeping genes such as TATA binding protein, cyclophilin, GAPDH.
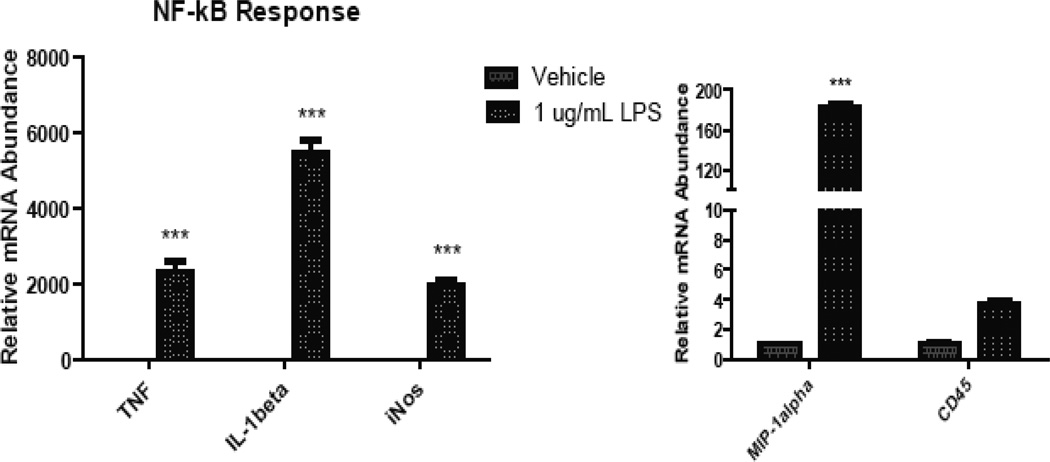
3. Figure 3 illustrates changes in mRNA levels for these markers in response to LPS stimulation.
Figure 3. Primary microglia positively selected with CD11b magnetic bead separation are responsive to inflammatory stimuli as measured by real-time PCR.
Primary microglia were isolated from ten postnatal day 3–5 (P3–P5) C57Bl/6 pups by MACS® neural dissociation followed by CD11b magnetic separation and treated for 4 hours with 1ug/mL LPS. Total RNA was harvested using phenol/chloroform extraction and reverse transcribed into cDNA. Quantitative PCR analysis revealed expression of mRNA for iNOS, MIP1α, IL-1β, TNF, CD45 at rest and after LPS stimulation.
3.3. Positive selection of postnatal microglia using Cd11b magnetic beads for quantitative flow-cytometric analyses of cell surface markers
Obtain eight postnatal day 3–5 pups from wild type or TNF-null (or another knockout mouse).
Isolate primary microglia using MACS® neural dissociation followed by OctoMACS® CD11b magnetic bead separation (Miltenyi Biotech).
Label cells with a fluorescently conjugated antibodies specific for the pan-marker CD11b and the activation marker F4/80.
Fix briefly in 1% PFA in PBS and sort using flow cytometry as previously described (Lee et al., 2008).
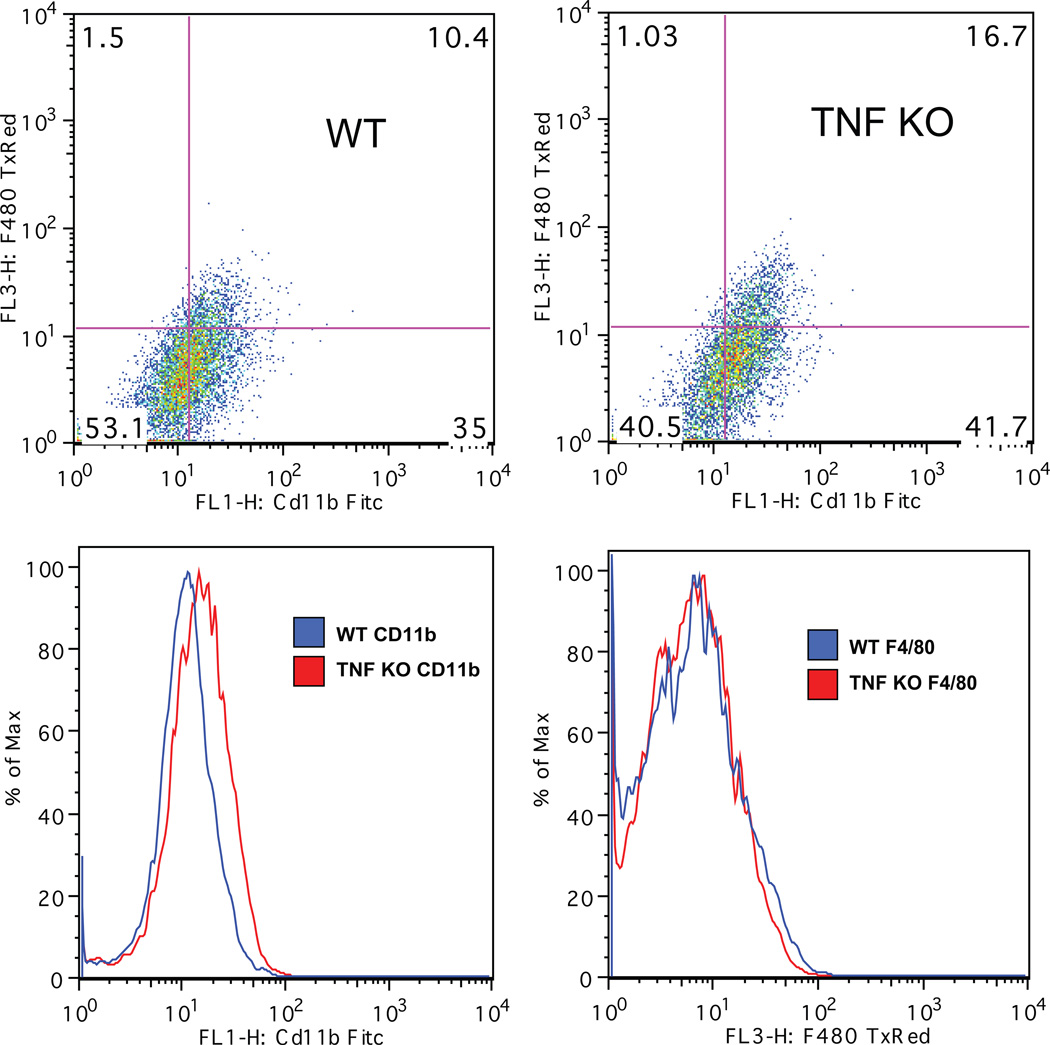
Figure 1 demonstrates a representative scatter plot from fluorescence-activated cell sorting (FACS) analysis from the cell population. The data reveals the expected Cd11b expression in the population and relatively low F4/80 expression indicative of minimal activation; no difference between genotypes was noted.
Figure 1. Primary microglia positively selected with CD11b magnetic bead separation display the expected microglial cell-surface markers as measured by flow cytometry.
Primary microglia were isolated from postnatal day 3 (P3) TNF-deficient (TNF KO) and wild type (WT) pups by MACS® neural dissociation and CD11b magnetic bead separation. Cells were double-labeled with an antibody against the activation marker F4/80 conjugated to the fluorophore Texas Red (Caltag) and an antibody against the microglial marker Cd11b conjugated to the fluorophore FITC (Miltenyi Biotec), fixed in 1% paraformaldehyde and subjected to flow cytometry. FACS analyses of the live cell population revealed the activation status of the microglia isolated from the two different genotypes.
Acknowledgement
The content of this article was adapted from one that appeared in the [Date] issue of the Miltenyi Biotech newsletter. This work was supported by NIH/NINDS grant 5R011NS049433 and The Michael J. Fox Foundation for Parkinson’s Research.
References Cited
- Harms AS, Lee JK, Nguyen TA, Chang J, Ruhn KM, Trevino I, Tansey MG. Regulation of microglia effector functions by tumor necrosis factor signaling. Glia. 2012;60(2):189–202. doi: 10.1002/glia.21254. [DOI] [PMC free article] [PubMed] [Google Scholar]
- Kurrasch DM, Huang J, Wilkie TM, Repa JJ. Quantitative real-time polymerase chain reaction measurement of regulators of G-protein signaling mRNA levels in mouse tissues. Methods Enzymol. 2004;389:3–15. doi: 10.1016/S0076-6879(04)89001-3. [DOI] [PubMed] [Google Scholar]
- Lee JK, et al. Regulator of G-protein signaling 10 promotes dopaminergic neuron survival via regulation of the microglial inflammatory response. J Neurosci. 2008;28:8517–8528. doi: 10.1523/JNEUROSCI.1806-08.2008. [DOI] [PMC free article] [PubMed] [Google Scholar]
- McCoy MK, et al. Blocking soluble tumor necrosis factor signaling with dominant-negative tumor necrosis factor inhibitor attenuates loss of dopaminergic neurons in models of Parkinson’s disease. J Neurosci. 2006;26:9365–9375. doi: 10.1523/JNEUROSCI.1504-06.2006. [DOI] [PMC free article] [PubMed] [Google Scholar]
- McGeer PL, McGeer EG. Inflammation and neurodegeneration in Parkinson’s disease. Parkinsonism Relat Disord. 2004;10(Suppl 1):S3–S7. doi: 10.1016/j.parkreldis.2004.01.005. [DOI] [PubMed] [Google Scholar]
- Ransohoff RM, Perry VH. Microglial physiology: unique stimuli, specialized responses. Annu Rev Immunol. 2009;27:119–145. doi: 10.1146/annurev.immunol.021908.132528. [DOI] [PubMed] [Google Scholar]
- Tansey MG, et al. Neuroinflammatory mechanisms in Parkinson’s disease: potential environmental triggers, pathways, and targets for early therapeutic intervention. Exp Neurol. 2007;208:1–25. doi: 10.1016/j.expneurol.2007.07.004. [DOI] [PMC free article] [PubMed] [Google Scholar]


