

Abstract
Previous studies have shown that in amyotrophic lateral sclerosis (ALS) multiple motor and extra-motor regions display structural and functional alterations. However, their temporal dynamics during disease-progression are unknown. To address this question we employed a longitudinal design assessing motor- and novelty-related brain activity in two fMRI sessions separated by a 3-month interval. In each session, patients and controls executed a Go/NoGo-task, in which additional presentation of novel stimuli served to elicit hippocampal activity. We observed a decline in the patients' movement-related activity during the 3-month interval. Importantly, in comparison to controls, the patients' motor activations were higher during the initial measurement. Thus, the relative decrease seems to reflect a breakdown of compensatory mechanisms due to progressive neural loss within the motor-system. In contrast, the patients' novelty-evoked hippocampal activity increased across 3 months, most likely reflecting the build-up of compensatory processes typically observed at the beginning of lesions. Consistent with a stage-dependent emergence of hippocampal and motor-system lesions, we observed a positive correlation between the ALSFRS-R or MRC-Megascores and the decline in motor activity, but a negative one with the hippocampal activation-increase. Finally, to determine whether the observed functional changes co-occur with structural alterations, we performed voxel-based volumetric analyses on magnetization transfer images in a separate patient cohort studied cross-sectionally at another scanning site. Therein, we observed a close overlap between the structural changes in this cohort, and the functional alterations in the other. Thus, our results provide important insights into the temporal dynamics of functional alterations during disease-progression, and provide support for an anatomical relationship between functional and structural cerebral changes in ALS.
Keywords: Amyotrophic lateral sclerosis, Hippocampus, Longitudinal fMRI, Novelty processing
Highlights
-
•
We investigated motor- and memory-related brain activity in ALS patients and controls.
-
•
For the first time, changes in fMRI activity were assessed in a longitudinal design.
-
•
Activity within the motor system decreased in ALS patients within only 3 months.
-
•
Strikingly, novelty-related hippocampal activity increased within the same time.
-
•
The magnitude of the activity changes correlated with the patients' clinical state.
1. Introduction
Amyotrophic lateral sclerosis (ALS) is a neurodegenerative disorder characterized by progressive muscular weakness and atrophy. Although the degeneration of upper and lower motor neurons is the pathological hallmark of the disease, several studies indicated that ALS is a multisystem disorder that also affects cognitive domains (Agosta et al., 2010; Raaphorst et al., 2010; Tsermentseli et al., 2012). Concordantly, neurodegenerative changes beyond the motor-system have been reported (Anderson et al., 1995; Grosskreutz et al., 2006; Kato et al., 1997; Neumann et al., 2006; Takeda et al., 2009; Wightman et al., 1992).
Besides such structural changes, functional alterations related to ALS have also been observed across multiple motor and extra-motor regions using a variety of different tasks (for recent review see Tsermentseli et al., 2012). Most studies observed increased activations of sensorimotor areas and/or recruitment of additional regions, which was interpreted as functional compensation or reorganization within the motor-system (Kew et al., 1993; Kollewe et al., 2011; Konrad et al., 2002; Mohammadi et al., 2011; Schoenfeld et al., 2005). However, some studies also found an activation decrease of sensorimotor and premotor areas (Mohammadi et al., 2011; Tessitore et al., 2006). One major reason for these controversial findings refers to the heterogeneity of the patient populations especially with regard to their particular disease stage during the time of study. Bearing this in mind, it is important to note that neurodegenerative alterations and therewith—interrelated functional loss or compensatory processes are certainly subject to change during progression of the disease. Thus, to identify patterns of functional alterations and their putative modifications during ALS disease-progression, it is indispensable to perform longitudinal within-subject investigations. The present study was designed to directly address such progression-related functional changes in motor and cognitive functions. To this end, brain activity in fourteen ALS patients and fourteen healthy controls was studied in two fMRI sessions separated by a 3-month interval, employing a simple Go/NoGo-task, in which the additional presentation of task-irrelevant novel stimuli allowed for assessment of novelty-related hippocampal activity.
In addition, to assess the relationship between functional and structural changes emerging during ALS disease-progression, we performed cross-sectional voxel-based morphometric (VBM) analyses on structural volumes acquired with magnetization transfer imaging in an independent, but socio-demographically comparable sample of 26 ALS patients and 28 controls. The magnetization transfer ratio of tissues depends on the surface chemistry and biophysical dynamics of macromolecules, as well as their tissue concentration (Cosottini et al., 2011; Eckert et al., 2004; Kato et al., 1997; Muller-Vahl et al., 2009; Wolff and Balaban, 1994). As such it has been shown to be strongly associated with tissue integrity (Grossman et al., 1994) and reduced magnetization transfer ratios have therefore repeatedly been suggested to mirror microstructural alterations like gliosis and changes in axonal density possibly related to early-stage neurodegenerative phenomena (Eckert et al., 2004; Kiefer et al., 2009; Perez-Torres et al., 2014; Ridha et al., 2007).
2. Materials and methods
2.1. Subjects
Two patient samples with sporadic ALS were recruited from the ALS outpatient clinics of the departments of Neurology at the Medical School Hannover and at the Medical School of the Otto-von-Guericke University Magdeburg. All patients met the criteria for probable or definitive ALS as defined by the El Escorial diagnostic criteria for ALS (Brooks et al., 2000) and had either a limb or bulbar onset. Exclusion criteria were other neurological conditions that could affect motor performance and cognition (e.g. stroke, traumatic brain injury). The first sample of fourteen patients took part in the fMRI experiment. The second sample of twenty-six patients participated in the VBM study. All participants underwent clinical examination on the day of study with active follow-up. Disease severity was assessed using the revised ALS Functional Rating Scale (ALSFRS-R; Cedarbaum et al., 1999). Disease duration was defined as time in months between symptom onset and the date of the experiment. From these measures the disease-progression rate was then calculated as (48 − ALSFRS-R)/disease duration (Ellis et al., 1999). In addition, the neuromuscular impairment was quantified by the five-point Medical Research Council (MRC) scale. 15 muscles were tested on the right and left for a maximum score of 150 (sternocleidomastoids, shoulder abductors and adductors, elbow flexors and extensors, wrist flexors and extensors, long finger flexors, thumb opponent, finger abductors and adductors, hip flexors, knee flexors and extensors, and ankle dorsiflexors). Good reliability and reproducibility for manual muscle testing in patients with ALS have previously been shown (Great lakes ALS Study Group, 2003; Andres et al., 1988). Furthermore, a detailed neuropsychological assessment lasting about 2 h was performed during the baseline visit in the first sample of fourteen patients who took part in the fMRI experiment.
Forty-two healthy individuals similar to the patients in age and gender were recruited as controls. Twenty-eight of the subjects were included in the VBM study and the remaining fourteen took part in the fMRI experiment. Ethical approval for all procedures was obtained prior to study (Vote number 11/06-75/11, Ethical committee of the Medical Faculty of the Otto-von-Guericke University, Magdeburg) and all participants gave written informed consent before participation. All experimental procedures have been performed in accordance with the ethical standards laid down in the 1964 Declaration of Helsinki and its later amendments.
Subject demographics and all relevant clinical data are shown in Table 1.
Table 1.
Participant demographics and clinical features.
| VBM study |
fMRI experiment |
|||
|---|---|---|---|---|
| ALS patients | Healthy controls | ALS patients | Healthy controls | |
| Gender (M/F) | 13/13 | 13/15 | 13/1 | 13/1 |
| Age (years) | 60.4 ± 2.2a,c (30-86) | 60.1 ± 1.9a,d (33-78) | 60.3 ± 3.1b,c (39-76) | 59.7 ± 3.3b,d (42-79) |
| Disease duration (months) | 23.8 ± 4.8(6–120) | NA | 18.3 ± 3.1 (6-49) | NA |
| Site of onset (spinal/bulbar) | 22/4 | NA | 11/3 | NA |
| ALSFRS-R | 36.2 ± 1.2(20-46) | NA | 38.2 ± 1.3 (26-44) | NA |
| MRC-Megascore | NA | NA | 130.9 ± 5.1 (79-150) | NA |
| Rate of disease-progression | 0.74 ± 0.09 (0.13–2.0) | NA | 0.66 ± 0.09 (0.22–1.5) | NA |
Data for the subjects' age, disease duration, ALSFRS-R, MRC-Megascore, and the rate of disease-progression are presented as mean ± standard error of the mean. Abbreviations: ALSFRS-R, revised ALS Functional Rating Scale; MRC, Medical Research Council.
Two-sample t-tests
T(1,52) = 0.08, p > 0.9;
T(1,26) = 1.45, p > 0.1;
T(1,38) = 0.02, p > 0.9;
T(1,40) = 1.79, p > 0.1.
2.2. Neuropsychological assessment
For neuropsychological assessment a range of standardized neuropsychological tests were employed (see Table 2). Verbal memory performance was tested using the VLMT, a German version of the Rey Auditory Verbal Learning Task (Lezak et al., 2004), and non-verbal memory using the Rey Complex Figure Test (Shin et al., 2006). Furthermore, we measured the Digit Span and the Visual Memory Span (Lezak et al., 2004). To address executive frontal functions, the Ruff Figural Fluency Test (Ruff et al., 1987), the Trail-making Test (Soukup et al., 1998), the Regensburger Verbal Fluency Test (Aschenbrenner et al., 2000), and the copy subtest of the Rey Complex Figure Test were employed. Attention was assessed using the d2 attention test (Brickenkamp and Zillmer, 1998). Deficient verbal memory performance was defined as abnormal performance (<2 standard deviations compared to an age matched reference population) in ≥2 different memory tasks (Phukan et al., 2012). Executive dysfunction was defined as an abnormal performance in ≥2 different executive tests (Strong et al., 2009). Adjustments were made for motor disability in tasks that were time dependent (d2, Ruff Figural Fluency Test, and Trail-making Test).
Table 2.
Neuropsychological data of the ALS patients.
| Test | Parameter | Mean scores (SD) | Patients within deficient rangea | Number of patientsb |
|---|---|---|---|---|
| 1. Learning and memory | ||||
| VLMT | ||||
| Supra span D1 | # words | 5,7 (1,3) | 1/14 (7%) | 14 |
| Learning D5 | # words | 11,6 (1,6) | 1/14 (7%) | 14 |
| Total learning ∑ D1 − D5 | # words | 45,1 (6,6) | 2/14 (14%) | 14 |
| Interference | # words | 5,5 (1,2) | 2/14 (14%) | 14 |
| Immediate verbal recall (D6) | # words | 8,8 (2,9) | 3/14 (21%) | 14 |
| Delayed verbal recall (D7) | # words | 9,4 (2,5) | 2/14 (14%) | 14 |
| Rey complex figure test | ||||
| Immediate visual recall | Points | 17,1 (4,1) | 1/13 (8%) | 13 |
| Delayed visual recall | Points | 17,0 (3,9) | 1/13 (8%) | 13 |
| Digit span | ||||
| Forwards | Raw-values | 7,4 (2,4) | 3/14 (21%) | 14 |
| Backwards | Raw-values | 6,4 (1,8) | 2/14 (14%) | 14 |
| Visual memory span | ||||
| Forwards | Raw-values | 7,8 (2,4) | 4/13 (30%) | 13 |
| Backwards | Raw-values | 7,2 (1,2) | 0/13 (0%) | 13 |
| 2. Executive functions | ||||
| Verbal Fluency (RWT) | ||||
| Phonematic fluidity | # words | 15,4 (6,4) | 4/14 (29%) | 14 |
| Phonematic flexibility | # words | 14 (6,1) | 5/14 (36%) | 14 |
| Semantic fluidity | # words | 32,4 (8,3) | 2/14 (14%) | 14 |
| Semantic flexibility | # words | 20,7 (3,2) | 1/14 (7%) | 14 |
| Ruff figural fluency | ||||
| Unique designs | Raw-values | 69,6 (17,9) | 2/11 (18%) | 11 |
| Perseverative errors | Raw-values | 4,0 (4,4) | 1/11 (9%) | 11 |
| Rey complex figure test | ||||
| Copy | Points | 33,6 (2,0) | 1/14 (7%) | 14 |
| Trail-making-test | ||||
| A | seconds | 37,7 (14,5) | 2/14 (14%) | 14 |
| B | seconds | 98,9 (45,1) | 1/14 (7%) | 14 |
| Ratio B/A | # | 2,8 (0,9) | 6/14 (43%) | 14 |
| 3. Attention | ||||
| d2 | ||||
| Total number of items | Raw-values | 349,8 (81,8) | 5/12 (42%) | 12 |
| Errors | Raw-values | 19,3 (12,2) | 0/12 (0%) | 12 |
| Corrected performance | Raw-values | 330,5 (75,3) | 5/12 (42%) | 12 |
| Concentration performance | Raw-values | 124,7 (12,2) | 4/12 (33%) | 12 |
At or below the 10th percentile.
Number of patients that completed the respective test/subtest.
The patients' neuropsychological data are summarized in Table 2. Based on the classification scheme suggested by Phukan et al. (2012), 14% of the patients showed executive dysfunction (ALS-Ex, single domain), 21% had executive paired with memory dysfunction, attention dysfunction or impaired visuo-construction (ALS-Ex, multi domain) and 7% showed deficits regarding attentional performance (non-executive impairment, ALS-NECI). 58% of the ALS patients had no cognitive impairment. None of the patients fulfilled the Neary criteria for frontotemporal dementia (Neary et al., 1998).
2.3. MRI data acquisition
2.3.1. fMRI data acquisition
Data were acquired on a 3-Tesla MR scanner (Siemens Magnetom Trio, Erlangen, Germany) equipped with an 8-channel head coil. The subjects viewed the stimuli through a mirror attached to the head coil, which reflected the images that were back-projected from an LCD projector onto a screen positioned behind the coil. During each run 187 volumes were acquired with a T2×-weighted echo planar imaging sequence (32 AC-PC oriented slices, TR 2000 ms, TE 30 ms, flip-angle 80°, in-plane resolution 64 × 64 mm2, FoV 224 × 224 mm2, no gap, resulting voxel-size 3.5 × 3.5 × 3.5 mm3) in an odd–even interleaved sequence. Scanning parameters as well as the paradigm were the same for both scanning sessions separated by a 3-month interval.
2.3.2. Image acquisition for VBM analysis
Structural images for the VBM analysis were acquired on a 1.5-T GE, Signa Horizon LX scanner equipped with a standard quadrature head coil (General Electric, Milwaukee, WI, USA). The protocol for magnetization transfer imaging consisted of a proton-density weighted SE sequence (48 AC–PC oriented slices, TR = 2600 ms, TE = 20 ms, in-plane resolution 256 × 256 mm2, resulting voxel-size = 3 × 1 × 1 mm3) both with (MT) and without (PD) a preparing saturation pulse (1200 Hz off-resonance, 1180° flip angle, 16 ms). Image post-processing included an inter-sequence movement correction by co-registration of the MT and PD images and subsequent calculation of the magnetization transfer ratio maps (MTR) by the formula MTR = 100 × [(PD − MT)/PD].
2.4. Experimental design
The fMRI experiment consisted of two scanning sessions separated by a 3-month interval, in both of which functional data were acquired in 4 runs of 6 min each, while subjects performed in a modified Go/NoGo-paradigm. All subjects (14 patients and their respective controls) participating in the fMRI experiment were scanned twice. The mean interval between sessions was 95 ± 10 (standard deviation; SD) days (range: 77–112 days) for the patients and 86 ± 10 (SD) days (range: 71–116 days) for controls. During the task subjects were repeatedly presented with a target (church with 3 towers) and a highly similar non-target stimulus (church with only 2 towers, see Fig. 1), with which they were familiarized before the experiment. Subjects were instructed to make a speeded button-press response upon the detection of the target, but not to the highly similar non-target stimulus. In addition, our design included the presentation of novel stimuli (indoor and outdoor black-and-white pictures), each of which was presented only once throughout the experiment. The total number of novel pictures matched the number of repetitions of the target and non-target stimuli (176 presentations throughout each scanning session).
Fig. 1.
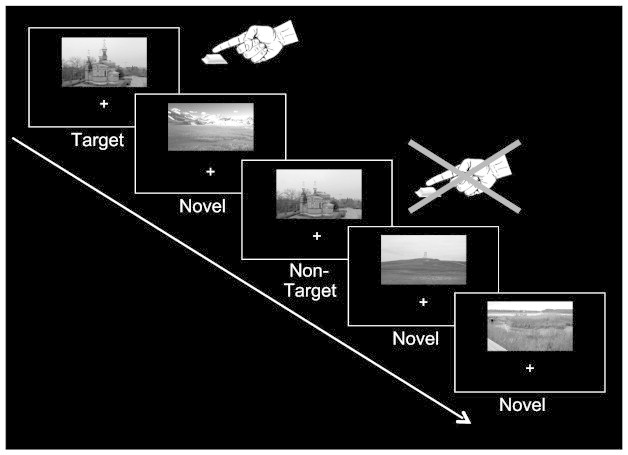
Schematic illustration of the experimental design. The paradigm consisted of a modified Go/NoGo-task. Beyond repeated presentation of a target and a highly similar non-target stimulus, the design also included the presentation of novel pictures (each of which occurred only once during the entire experiment). The subjects' task was to make a speeded button-press response upon detection of the target picture, but to withhold their response to the highly similar non-target and novel stimuli.
Target and non-target stimuli were identical across sessions for all participants, while novel stimuli differed across sessions. In addition, to avoid memory/habituation-effects, pictures of outdoor-scenes served as novels within one and indoor-scenes in the other fMRI session (counterbalanced across subjects). All stimuli (size of 9.6 × 5.8°) were presented 4.4° above a central fixation cross for 1 s and their presentation-sequence was pseudo-randomized with an inter-trial interval varying between 2 and 6 s (mean: 2.75 s) to allow for trial separation in an event-related analysis.
2.5. fMRI data analysis
fMRI data were analyzed using SPM8 software (Wellcome Department of Cognitive Neurology, University College London, UK) and MATLAB 7.9 (The MathWorks Inc.). Functional data from both measurements were slice-time corrected and realigned. Then the mean image derived from realignment of the 2nd session was co-registered to that of the 1st session and the resultant spatial transformation matrices were applied to all volumes of the 2nd session. Finally, all images were spatially normalized to an EPI template in MNI space and smoothed with an isotropic Gaussian kernel of 8-mm full-width at half-maximum.
For statistical analysis, blood-oxygen level-dependent responses were modeled by delta functions at the time of stimulus onsets. Resultant event-regressors (Targets, Non-Targets, and Novels) were entered into a general linear model and convolved with the standard hemodynamic-response function implemented in SPM8. Movement parameters from the realignment procedure were included as covariates into the model. The data from both scanning sessions were independently analyzed, resulting in two contrasts of interest per session and subject (“Targets > Non-Targets” and “Novels > Non-Targets”). These individual-subject contrasts then were submitted to second-level random-effects group analyses (one-sample t-tests). In addition, session-specific contrasts were directly compared against each other by second-level paired t-tests to identify activity changes within 3 months of ALS disease-progression.
All statistical parametric maps from the group analyses were thresholded at p < 0.001 (uncorrected) for voxel-level inference with a minimum cluster-size criterion of 20 contiguous voxels, and subsequent cluster-level correction for multiple testing at p < 0.05 (FWE-corrected). Given our a priori hypotheses, the significance of activated clusters in the primary motor cortex, cerebellum, and hippocampus, was assessed using small volume correction (SVC). Statistical parametric maps were visualized using MRIcron (http://www.mccauslandcenter.sc.edu/mricro/mricron/).
To directly compare the magnitude of motor- and novelty-related modulations between sessions, and for correlation of activation differences with clinical measures, a region of interest (ROI) analysis was performed using MarsBar (Brett et al., 2002). Functional ROIs located in the left primary motor cortex (M1), bilateral cerebellum, and bilateral hippocampus were defined based on the significant clusters obtained from the second-level paired t-test group analyses on the patients' data. Beta-estimates for the contrasts “Targets > Non-Targets” and “Novels > Non-Targets” were extracted from both fMRI measurements. These values were submitted to repeated-measures ANOVAs (RANOVA) with the factor contrast (“Targets > Non-Targets” vs. “Novels > Non-Targets”) and session (1st vs. 2nd). If statistical significance (p < 0.05) was obtained, paired t-tests were applied for post hoc comparison. If significant differences in motor- or novelty-related activity across sessions were observed, correlations between these difference values and the patients' clinical parameters (ALSFRS-R and MRC-Megascore) were assessed by Spearman's rank correlation.
To relate the patients' motor- and novelty-evoked activations to those of healthy individuals, mean contrast-estimates from the left M1 and bilateral hippocampus were also extracted from the control subjects' data. Analysis of the resultant hippocampal data by RANOVA (within-subject factor hemisphere and session, between-subject factor group) revealed no main effects or interactions for the factor hemisphere. Therefore, data of both hippocampal ROIs were collapsed. The resultant values then were analyzed by RANOVA with the within-subject factor session and the between-subject factor group. If significant effects (p < 0.05) were obtained, paired t-tests (within-subject comparison) or two-sample t-tests (comparison between groups) were applied for post hoc analysis.
2.6. VBM data analysis
In contrast to the fMRI experiment, MTR data from our second cohort were acquired only once. These data thus only allowed for a cross-sectional comparison between patients and controls, but not for assessment of longitudinal structural changes emerging during ALS disease-progression. The VBM analysis on MTR data was also performed using SPM8. First, PD-weighted images from 52 healthy, aged individuals (which did not serve as control subjects in the current study) were normalized to the PD-template included in SPM8. The resulting normalization parameters were applied to the concurrently acquired MT-images of the 52 subjects. Then the normalized MT-volumes were smoothed with a 4-mm FWHM isotropic Gaussian kernel and averaged to create a scanner-specific template for normalization of our current VBM data. MT-images of our ALS patients and their respective controls were normalized to this template and the resultant normalization parameters were applied to the inherently co-registered MTR-maps. Finally, these normalized MTR-volumes were smoothed with an isotropic Gaussian kernel of 4 mm FWHM.
For statistical analysis the normalized and smoothed MTR-images were submitted to an ANCOVA with study group (ALS patients vs. controls) as the main factor, and age, as well as total brain volume as covariates. Directional t-contrasts were defined between groups, whereby only the contrast “Controls > ALS patients” revealed significant effects. To assess putative correlations between the disease-related structural changes and the patients' clinical data we performed regression analyses on the patients' MTR volumes by adding the their clinical data into the design as covariates (ALSFRS-R scores, MRC-Megascores, disease duration and disease progression rate), in addition to their age and total brain volumes. Beyond that, spherical ROIs (4 mm radius) were centered at the local maxima showing significant MTR differences between patients and controls in the main ANCOVA (see Table 6 for MNI-coordinates of these local maxima where ROIs were centered). From these ROIs mean MTR-values were extracted and then correlated with the patients' ALSFRS-R scores, MRC-Megascores, their disease duration and disease progression rate using Spearman's rank correlation.
Table 6.
Peak-values from the voxel-based morphometry controls > ALS patients.
| Anatomical structure | Hemisphere | MNI coordinates (x,y,z) | Max. t-value |
Corrected cluster p-value | Cluster size | ||
|---|---|---|---|---|---|---|---|
| Striatum | R | 28 | –10 | 12 | 5.52 | < 0.001 | 460 |
| (Putamen) | R | 28 | –2 | –8 | 5.27 | ||
| Thalamus | R | 24 | –28 | 14 | 4.63 | ||
| (Pulvinar/ VLN) | R | 16 | –14 | 10 | 4.10 | ||
| Pre-/ postcentral | L | –24 | –18 | 30 | 5.38 | < 0.001 | 521 |
| Gyrus | L | –22 | –28 | 48 | 5.08 | ||
| L | –10 | –28 | 62 | 4.07 | |||
| L | –38 | –10 | 38 | 3.96 | |||
| Thalamus | L | –20 | –18 | 10 | 5.26 | < 0.001 | 404 |
| (Pulvinar/ VLN) | L | –8 | –14 | –2 | 4.80 | ||
| Striatum | L | –22 | 0 | 12 | 4.47 | ||
| (Putamen) | L | –24 | 4 | 2 | 3.85 | ||
| Precentral gyrus | R | 18 | –24 | 50 | 4.15 | < 0.05 | 53 |
| Hippocampus | L | –38 | –26 | –2 | 4.84 | < 0.005 | 83 |
| Hippocampus | R | 34 | –14 | –20 | 4.15 | < 0.05 | 58 |
| OFC | L | –14 | 40 | –14 | 4.95 | < 0.01 | 81 |
| OFC | R | 20 | 44 | –12 | 3.89 | < 0.05 | 55 |
| IFG | L | –36 | 10 | 28 | 5.86 | < 0.001 | 131 |
Abbreviations: IFG, inferior frontal gyrus; OFC, orbitofrontal cortex; VLN, ventrolateral nucleus of the thalamus.
For the SPM analyses, stereotactic coordinates for voxels with maximum t-values within significant activation clusters are reported in MNI standard space using an auxiliary voxel-level threshold of p < 0.001 (uncorrected) with a minimum cluster-size criterion of 50 contiguous voxels and subsequent cluster-level correction for multiple testing at p < 0.05 (FWE-corrected). Data were visualized using the MRIcron software package (http://www.mccauslandcenter.sc.edu/mricro/mricron/).
3. Results
3.1. Behavioral results
Reaction times, correct responses and false alarms (see Table 3) were analyzed by RANOVAs with the within-subject factor session and the between-subject factor group. These analyses revealed no significant main effects or interactions neither for the reaction times (session: F(1,26) = 0.6, p > 0.4; group: F(1,26) = 2.9, p = 0.1; group × session: F(1,26) = 0.2, p > 0.6), nor for the correct responses (session: F(1,26) = 1.8, p > 0.1; group: F(1,26) = 1.1, p > 0.2; group × session: F(1,26) = 0.6, p > 0.4), or for the false alarm rates (session: F(1,26) = 2.9, p = 0.1; group: F(1,26) = 0.2, p > 0.6; group × session: F(1,26) = 0.3, p > 0.5) of the study participants. Direct comparison across sessions (paired t-tests) also showed no significant differences for any of the behavioral measures of the patients (reaction times: T(1,13) = 0.8, p > 0.4; correct responses: T(1,13) = 1.1, p > 0.2; false alarms: T(1,13) = 0.8, p > 0.4), or controls (reaction times: T(1,13) = 0.2, p > 0.8; correct responses: T(1,13) = 1.1, p > 0.2; false alarms: T(1,13) = 1.6, p > 0.1). Taken together, the behavioral data showed no significant differences between patients and controls and also no significant alterations over scanning sessions within each of the two groups.
Table 3.
Behavioral data from the fMRI experiment.
| ALS patients |
Healthy controls |
|||
|---|---|---|---|---|
| 1st session | 2nd session | 1st session | 2nd session | |
| Reaction times [ms] | 629 ± 27 | 619 ± 21 | 577 ± 16 | 575 ± 18 |
| Correct responses [%] | 99.2 ± 0.3 | 98.7 ± 0.5 | 98.9 ± 0.6 | 97.1 ± 1.5 |
| False alarms [%] | 0.7 ± 0.2 | 0.5 ± 0.2 | 0.9 ± 0.2 | 0.5 ± 0.1 |
All data denote the mean ± standard error of the mean.
3.2. fMRI results
For the healthy controls we observed no differences in motor- or novelty-related activity across sessions (data not shown).
3.2.1. Motor-related activations in ALS patients
The “Targets > Non-Targets” contrasts from both sessions revealed activity in a variety of regions associated with the motor-system, including the bilateral primary motor cortex (M1), bilateral cerebellum, supplementary motor area, bilateral inferior frontal gyrus/ anterior insula, striatum, and portions of the thalamus (see Fig. 2A, as well as the upper and middle rows of Table 4). Note that maximum t-values and cluster-sizes of these activations are considerably higher during the 1st than during the 2nd session, indicative of a decrease in motor-related activity across sessions. This assumption was validated by a paired t-test showing that motor-related activity in the left M1 and bilateral cerebellum was in fact significantly higher during the 1st than during the 2nd measurement (see Fig. 2B and bottom rows of Table 4).
Fig. 2.
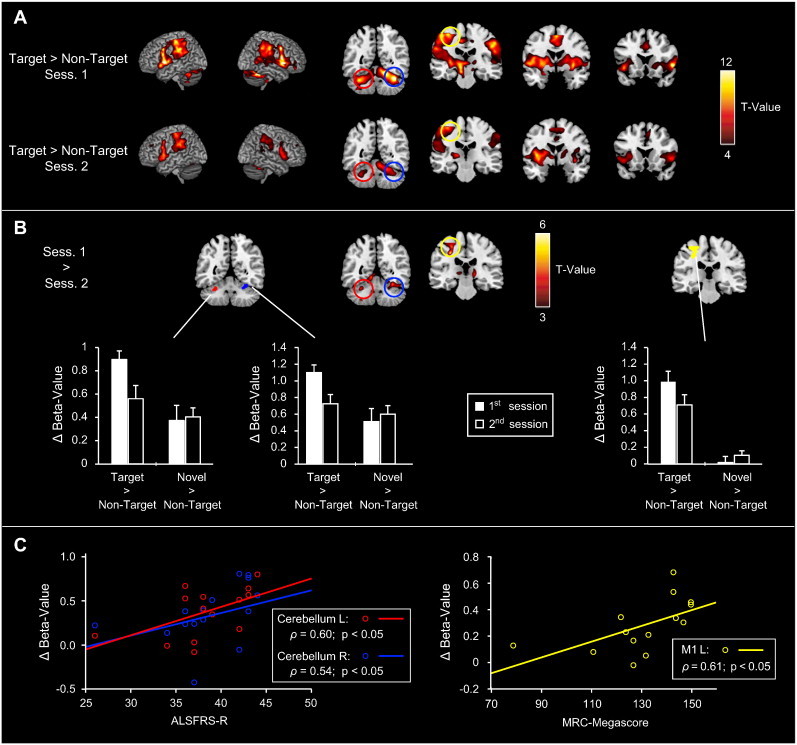
Functional changes in motor regions related to ALS disease-progression. A) Motor activity (“Targets > Non-Targets”) from the 1st and 2nd fMRI sessions. Motor-related activations were observed in the bilateral primary motor cortex, cerebellum, inferior frontal gyrus/ anterior insula, striatum, thalamus, and in the supplementary motor area. Note that maximum t-values and the extent of activations are considerably higher for the 1st than for the 2nd session. B) Direct comparison of motor-related activity across sessions. A decrease in motor-related activity from the 1st to the 2nd measurement was evident in the left primary motor cortex and bilateral cerebellum, which was confirmed in a ROI-analysis (see bar graphs). C) Correlation of ROI-results and the patients' clinical data. The decrease in motor-related activity correlated with the patients' ALSFRS-R scores for both cerebellar ROIs, while in the primary motor cortex it correlated with their MRC-Megascores.
Table 4.
Peak activation foci for the comparisons of Targets > Non-Targets.
| Anatomical structure | Hemisphere | MNI coordinates (x,y,z) | Max. t-value |
FWE-corrected cluster p-value | Cluster size | ||
|---|---|---|---|---|---|---|---|
| Targets > Non-Targets — 1st session | |||||||
| Anterior insula | L | –52 | 6 | 2 | 16.34 | <0.001 | 11,389 |
| R | 56 | 10 | 14 | 16.19 | |||
| IFG | L | –58 | 10 | 36 | 11.63 | ||
| R | 52 | 6 | 38 | 13.32 | |||
| Thalamus | L | –14 | –14 | 2 | 12.78 | ||
| R | 6 | –12 | 4 | 8.60 | |||
| SMG/Pre- / postcentral gyrus | L | –54 | –34 | 36 | 11.90 | ||
| STN | L | –10 | –20 | –6 | 11.37 | ||
| Precentral gyrus | L | –48 | –24 | 54 | 10.95 | ||
| Striatum | L | –20 | 2 | –2 | 9.73 | ||
| R | 20 | 8 | 8 | 10.42 | |||
| Cerebellum | L | –34 | –54 | –32 | 11.47 | <0.001 | 4303 |
| R | 34 | –52 | –28 | 15.08 | |||
| SMA | − | 2 | –2 | 56 | 11.52 | <0.001 | 1180 |
| SMG/Pre- / postcentral gyrus | R | 56 | –22 | –40 | 10.32 | <0.001 | 2356 |
| Cuneus | − | 0 | –92 | 14 | 7.63 | <0.001 | 389 |
| Targets > Non-Targets — 2nd session | |||||||
| Anterior insula | L | –36 | 4 | 4 | 11.66 | <0.001 | 2750 |
| IFG | L | –56 | 12 | 24 | 8.33 | ||
| Striatum | L | –16 | 6 | –2 | 7.03 | ||
| Thalamus | L | –14 | –20 | 4 | 8.36 | ||
| SMG/ pre-/ postcentral gyrus | L | –48 | –36 | 28 | 9.76 | <0.001 | 2067 |
| Anterior insula | R | 36 | 2 | –6 | 8.39 | <0.001 | 597 |
| Cerebellum | R | 20 | –48 | –24 | 8.33 | <0.001 | 909 |
| SMA | − | –10 | –8 | 56 | 8.05 | <0.001 | 274 |
| SMG/ pre-/ postcentral gyrus | R | 60 | –38 | 44 | 6.68 | <0.001 | 266 |
| Cerebellum | L | –30 | –56 | –30 | 6.31 | <0.05 | 77 |
| Striatum | R | 16 | 6 | 2 | 5.99 | <0.05 | 89 |
| (Targets > Non-Targets — 1st session) > (Targets > Non-Targets — 2nd session) | |||||||
| Lingual gyrus | L | –10 | –62 | –6 | 8.11 | <0.001 | 5769 |
| R | 10 | –66 | –4 | 5.05 | |||
| Calcarine | L | –10 | –72 | 8 | 6.70 | ||
| R | 8 | –78 | 8 | 5.83 | |||
| Cuneus | L | –10 | –96 | 30 | 5.25 | ||
| R | 12 | –94 | 26 | 6.15 | |||
| Cerebellum | R | 28 | –58 | –18 | 4.70 | ||
| Precentral gyrus | L | –30 | –24 | 42 | 5.27 | <0.01 (SVC) | 387 |
| Cerebellum | L | –30 | –52 | –26 | 4.20 | <0.05 (SVC) | 57 |
| Thalamus | L | –10 | –20 | 6 | 4.46 | <0.05 (SVC) | 130 |
| R | 16 | –20 | 8 | 4.53 | <0.05 (SVC) | 159 | |
| Striatum | L | –12 | 8 | –2 | 3.47 | <0.05 (SVC) | 48 |
| R | 10 | 12 | –4 | 4.03 | <0.05 (SVC) | 91 | |
Abbreviations: IPS, intraparietal sulcus; MOG, middle occipital gyrus; PHG, parahippocampal gyrus; SOG, superior occipital gyrus; SVC, small-volume correction.
To further corroborate this finding, contrast-estimates from ROIs located in the left M1 and bilateral hippocampus were subjected to RANOVAs with the factor contrast and session. These analyses showed a significant main effect for the factor contrast for the left M1 (F(1,13) = 37.8, p < 0.0001) and the left cerebellum (F(1,13) = 5.5, p < 0.05), as well as a significant contrast × session interaction for all 3 ROIs (left M1: F(1,13) = 32.9, p < 0.0001; left cerebellum: F(1,13) = 8.5, p < 0.05; right cerebellum: F(1,13) = 25.7, p < 0.001). Post hoc comparisons indicated that these effects were due to higher estimates for the contrast “Targets > Non-Targets” of the 1st in comparison to the 2nd measurement (see Fig. 2B; left M1: T(1,13) = 5.2, p < 0.001; left cerebellum: T(1,13) = 3.7, p < 0.005; right cerebellum: T(1,13) = 4.9, p < 0.001).
To investigate the relationship between the activation decrease within 3 months of disease-progression and the patients' clinical status, we correlated the magnitude of the activity reduction with the patients' ALSFRS-R and MRC-Megascores (see Fig. 2C). Therein, we observed a significant correlation between the motor-related activation decrease and the patients' ALSFRS-R scores for both cerebellar ROIs (left cerebellum: ρ = 0.60, p < 0.05; right cerebellum: ρ = 0.54, p < 0.05), and with the patients' MRC-Megascores for the left M1 (ρ = 0.61, p < 0.05).
3.2.2. Novelty-related activations in ALS patients
For both sessions, the comparison “Novels > Non-Targets” showed activations within multiple ventral occipital and temporal regions, including the middle/superior occipital, fusiform, lingual and parahippocampal gyri (see Fig. 3A and upper/middle rows of Table 5). In addition, stimulus novelty significantly activated the bilateral hippocampus, but due to the chosen threshold of p < 0.001 only during the 2nd measurement. Direct comparison between sessions confirmed that in the bilateral hippocampus the novelty-related activity was higher during the 2nd in comparison to the 1st session (Fig. 3B; bottom rows of Table 5).
Fig. 3.
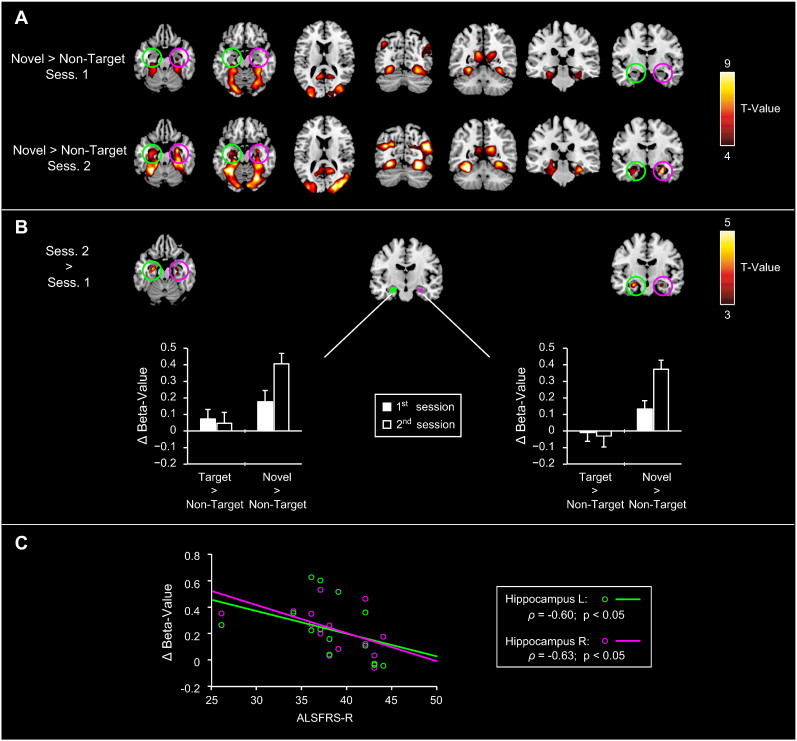
Functional alterations in novelty processing related to ALS disease-progression. A) Novelty-related activity (“Novels > Non-targets”) from the 1st and 2nd fMRI sessions. Novelty-related activity was observed across multiple ventral occipital and temporal regions, including the middle/superior occipital, fusiform, lingual and parahippocampal gyri. In addition, significant hippocampal novelty-related activations were evident during the 2nd measurement (compare activation maps between the upper and lower rows). B) Direct comparison of novelty-related activity across sessions. A decrease in hippocampal novelty-related activity occurred from the 1st to the 2nd measurement, which was confirmed by a subsequent ROI-analysis (see bar plots). C) Correlation of hippocampal ROI-results and the patients' clinical data. The hippocampal activation-increase showed a negative correlation with the patients' ALSFRS-R scores for both ROIs.
Table 5.
Peak activation foci for the comparison of Novels > Non-Targets.
| Anatomical structure | Hemisphere | MNI coordinates (x,y,z) | Max. t-value |
FWE-corrected cluster p-value | Cluster size | ||
|---|---|---|---|---|---|---|---|
| Novels > Non-Targets — 1st session | |||||||
| Fusiform gyrus | R | 28 | –66 | –12 | 9.22 | <0.001 | 1096 |
| PHG | R | 36 | –38 | –14 | 8.23 | ||
| Lingual gyrus | R | 24 | –76 | –6 | 6.87 | ||
| Fusiform gyrus | L | –28 | –64 | –10 | 8.75 | <0.001 | 2447 |
| MOG | L | –32 | –98 | 14 | 8.48 | ||
| Lingual gyrus | L | –26 | –76 | –8 | 7.92 | ||
| PHG | L | –26 | –38 | –18 | 6.81 | ||
| Anterior lingual gyrus/ precuneus | L | –10 | –54 | 20 | 7.74 | <0.005 | 210 |
| Anterior lingual gyrus/ precuneus | R | 16 | –54 | 18 | 6.44 | <0.05 | 111 |
| Mog/ SOG | R | 32 | –78 | 12 | 7.41 | <0.001 | 1006 |
| Novels > Non-Targets — 2nd session | |||||||
| Fusiform gyrus | L | –26 | –76 | –8 | 15.28 | <0.001 | 11,244 |
| R | 26 | –74 | –8 | 11.51 | |||
| Mog/ SOG | L | –28 | –92 | 22 | 9.59 | ||
| R | 18 | –86 | 28 | 14.34 | |||
| L | –34 | –70 | 24 | 10.86 | |||
| R | 44 | –72 | 22 | 13.91 | |||
| Anterior fusiform gyrus | L | –28 | –52 | –22 | 12.03 | ||
| R | 30 | –46 | –12 | 9.20 | |||
| PHG | L | –34 | –36 | –12 | 9.86 | ||
| R | 32 | –36 | –18 | 7.85 | |||
| Anterior lingual gyrus/ precuneus | L | –10 | –44 | 8 | 6.32 | ||
| R | 14 | –54 | 18 | 8.28 | |||
| Hippocampus | L | –28 | –8 | 24 | 9.87 | ||
| Hippocampus | R | –32 | –12 | –18 | 6.83 | <0.001 | 258 |
| R | –32 | –20 | –22 | 5.38 | <0.05 (SVC) | 250 | |
| Hippocampus | L | 26 | –24 | –14 | 3.85 | <0.05 (SVC) | 41 |
| L | 28 | –14 | –22 | 3.66 | <0.05 (SVC) | 53 | |
Abbreviations: IPS, intraparietal sulcus; MOG, middle occipital gyrus; PHG, parahippocampal gyrus; SOG, superior occipital gyrus; SVC, small-volume correction.
Direct comparison of these activation changes by RANOVAs with the factor contrast and session for the bilateral hippocampal ROI data showed a significant main effect for the factor contrast (left hippocampus: F(1,13) = 11.5, p < 0.005; right hippocampus: F(1,13) = 41.3, p < 0.05) and a significant contrast-by-session interaction (left hippocampus: F(1,13) = 6.7, p < 0.05; right hippocampus: F(1,13) = 8.2, p < 0.05). Post hoc comparisons revealed that these interactions were due to higher novelty-related activity during the 2nd in comparison to the 1st session (see Fig. 3B; left hippocampus: T(1,13) = 5.0, p < 0.001; right hippocampus: T(1,13) = 3.9, p < 0.005). Finally, these novelty-related activation differences showed a negative correlation with the patients' ALSFRS-R scores for both hippocampal ROIs (see Fig. 3C for graphical illustration; left hippocampus: ρ = −0.60, p < 0.05; right hippocampus: ρ = −0.63, p < 0.05).
3.2.3. Motor- and novelty-related activations in patients relative to controls
The within-subject analyses presented so far revealed a decrease of motor-related and an increase of novelty-evoked activity in patients during the 3-month interval. These data on their own, however, did not allow inferring about the relative course of these changes compared to functionally intact neural activations. To overcome this limitation, beta-estimates from the ROIs covering the left M1 and bilateral hippocampus were also extracted from the control subjects' functional data and compared to those of the patients'.
For both the hippocampal and motor-related activations analyses by RANOVAS revealed a significant main effect for the factor session (left M1: F(1,26) = 8.8; p < 0.01; hippocampus: F(1,26) = 11.6; p < 0.005) and a group-by-session interaction (left M1: F(1,26) = 4.4; p < 0.05; hippocampus: F(1,26) = 4.6; p < 0.05). For the left M1, post hoc analyses indicated that the interaction effect was due to a significantly higher motor-related activity in patients compared to controls (see Fig. 4A) during the first (T(1,13) = 2.3, p < 0.05), but not during the second session (T(1,13) = 0.7, p > 0.5). This pattern was also reflected by a significant decrease of motor-related activity in patients between the 1st and 2nd sessions (T(1,13) = 5.2, p < 0.001; see also Fig. 2), which was absent in controls (T(1,13) = 0.5, p > 0.6). For the hippocampal data (Fig. 4B), in contrast, the post hoc analyses did not show significant differences in novelty-evoked activity between groups for any of the two sessions (1st session: T(1,13) = –0.5, p > 0.5; 2nd session: T(1,13) = 1.6, p > 0.1). Within each group, however, direct comparisons between sessions revealed a significant increase of novelty-evoked activity in the patients (T(1,13) = 5.1, p < 0.001), but not in controls (T(1,13) = 0.7, p > 0.4).
Fig. 4.
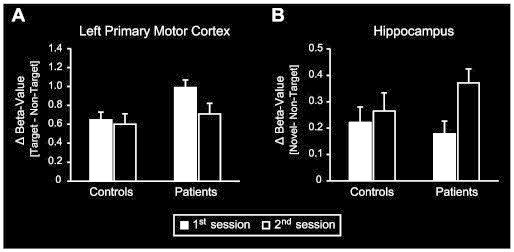
Comparison of motor- and novelty-related activations between patients and controls. Values denote differences in beta-estimates between A) target and non-target trials or between B) novel and non-target trials. Black and white bars depict values for the 1st and 2nd scanning sessions, respectively. Control subjects' data are shown on the left and the patients' data on the right. Values represent the mean ± standard error of the mean. A) ROI-analysis comparing motor-related activity across sessions and groups. Patients displayed higher motor-related activity in the left primary motor cortex during the 1st scanning session and a significant decrease between sessions, which was absent in controls. B) ROI-analysis comparing novelty-evoked activity across sessions and groups. For both sessions there were no significant differences in hippocampal novelty-evoked activity between groups. Direct within-subject comparisons, however, revealed that – in contrast to controls – the patients' novelty-related hippocampal activity increased from the 1st to the 2nd session.
3.3. VBM results
The between-group VBM analysis revealed several clusters of significantly reduced magnetization transfer ratio (MTR) in ALS patients compared to healthy controls (see Fig. 5) indicative of neurodegenerative processes leading to substance loss/alterations in these regions. The reduced MTRs were located in the bilateral pre-/postcentral gyrus, orbitofrontal cortex, hippocampus, thalamus, striatum, and left inferior frontal gyrus (see Table 6 for MNI-coordinates and maximum t-values).
Fig. 5.
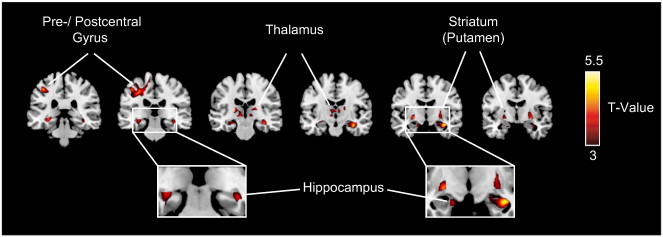
Regional atrophy in ALS patients in comparison to controls. Results of the between-group VBM analysis are superimposed on a standard MNI template thresholded at p < 0.001 (uncorrected). Clusters of significantly reduced MTR (ALS < controls) were detected within the bilateral precentral gyrus and several subcortical regions, including the bilateral hippocampus, thalamus and striatum (see Table 6 for MNI-coordinates and maximum t-values).
To assess a putative relationship between these structural changes and the patients' clinical state, we performed regression analyses using their clinical measures as covariates (ALSFRS-R scores, MRC-Megascores, disease duration and disease progression rate). In addition, we assessed putative correlations between the clinical data and the patients' mean MTR-values extracted from spherical ROIs centered at the local activation maxima of the between-group analysis. Using these two approaches we did not observe significant correlations between the patients' MTR-values and their disease state as indexed by any of the clinical measures employed in our analyses (ALSFRS-R scores, MRC-Megascores, disease duration and disease progression rate).
3.4. Comparison of fMRI and VBM results
The fMRI part of the current study aimed at investigating how motor- and novelty-related regions are functionally affected within the short interval of 3 months of ALS-progression. The volumetric analyses aimed at identifying regions that display alterations of brain tissue in socio-demographically comparable patients at similar disease stages. Therefore, we superimposed the statistical maps obtained for the functional differences between measurements with those indicating the structural alterations onto an anatomical template image. By this means we observed a considerable overlap between the structural alterations identified by the VBM analysis and the functional reduction in motor-related activity in the course of ALS disease-progression within the left M1 (illustrated in magenta in Fig. 6). In addition, the motor-related functional alterations within the striatum and thalamus lay in close proximity to the structural alterations affecting these regions (compare red and blue maps in Fig. 6 and activation maxima in Table 4 and bottom rows of Table 5). Similarly, a comparison between the functional changes in novelty processing across sessions and our VBM results revealed an overlap (shown in yellow in Fig. 6), or at least a very close proximity (compare red and green maps in Fig. 6) between structural and functional changes in the bilateral hippocampus (the corresponding activation maxima are shown in Table 4 and bottom rows of Table 6).
Fig. 6.
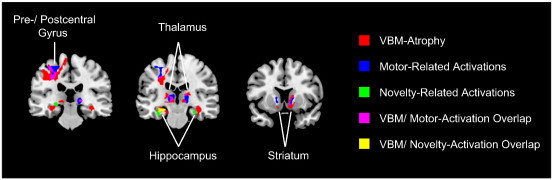
Overlap between structural and functional alterations. Results from the VBM analysis (illustrated in red) and for changes in motor- (blue) and novelty-related (green) activity were superimposed onto an anatomical template image. Direct overlap of functional motor-related (fMRI) and structural (VBM) alterations is shown in magenta, while overlap between functional novelty-related and structural alterations is illustrated in yellow.
4. Discussion
Using a longitudinal within-subject design, the current study revealed motor- and memory-related functional alterations emerging within only 3 months of ALS disease-progression. Importantly, motor activity decreased during the 3-month interval, while novelty-evoked hippocampal activity increased at the same time. In addition, these functional changes displayed opposite correlations with clinical measures: While the motor-evoked activity correlated positively with the patients' clinical status (ALSFRS-R and MRC-Megascores), the hippocampal activations showed an inverse pattern. These results indicate that hippocampal and motor-system lesions emerge at different disease stages: The relative decrease in motor activity might reflect a breakdown of compensatory mechanisms due to ongoing progressive neural loss, while the hippocampal activation increase, in contrast, most likely constitutes the initial built-up of compensatory processes to overcome dysfunctions typically observed at the beginning of lesions (Bookheimer et al., 2000; Dickerson and Sperling, 2008; Woodard et al., 2009). Finally, our additional cross-sectional voxel-based morphometric (VBM) analyses in an independent sample of patients identified structural alterations at the same locations where changes in hemodynamic activity were observed. Thus, our findings indicate a close relationship between functional and structural changes and provide important insights into the temporal dynamics of functional changes during ALS disease-progression.
4.1. Functional motor-system alterations during ALS disease-progression
In line with most previous studies (Kew et al., 1993; Kollewe et al., 2011; Konrad et al., 2002; Mohammadi et al., 2011; Schoenfeld et al., 2005), our ALS patients displayed an increased motor activity compared to controls during the initial measurement. Such increased activity-levels or recruitments of additional regions have previously been interpreted as functional compensation or reorganization within the motor-system. This network showing increased or exclusive motor-related activity in patients relative to controls comprised regions in the primary sensorimotor and premotor cortices, supplementary motor area, dorsal anterior cingulate cortex, cerebellar motor regions and parts of the striatum and thalamus (Kollewe et al., 2011; Konrad et al., 2002; Mohammadi et al., 2011; Schoenfeld et al., 2005). These findings were attributed to an ALS-related cortical hyperexcitability due to the loss of inhibitory interneurons (Maekawa et al., 2004), accompanied by reduced short-interval intracortical inhibition (Ziemann et al., 1997) and lower binding rates of the GABA-A receptor ligand flumazenil (Turner et al., 2005). Importantly, however, at later disease-stages decreased activations in the sensorimotor and premotor areas have also been described (Mohammadi et al., 2011; Tessitore et al., 2006). The most plausible explanation for this pattern of changes was that after an initial compensatory hyperactivation or recruitment of additional areas, ongoing neurodegeneration during disease progression causes a breakdown of the compensatory mechanisms, finally resulting in decreased activity levels compared to earlier (within-subject) measurements or relative to controls.
Our data fully support this view. For one, the pattern of motor-related activations closely resembled that described in previous studies on motor-network functions in ALS (Kollewe et al., 2011; Konrad et al., 2002; Mohammadi et al., 2011; Schoenfeld et al., 2005) and within this network we observed a hyperactivation in patients compared to controls during the initial measurement. Beyond that, we observed a relative (within-subject) reduction in the patients' motor-related activity in the left primary sensorimotor cortex and bilateral cerebellum after only 3 months, which is consistent with the idea that degenerative changes in motor regions start long before clinical signs are apparent (Schoenfeld et al., 2005). Further support is provided by the observation that the magnitude of the activity reductions correlated with the patients' clinical status: Higher ALSFRS-R or MRC scores (less disability/ earlier disease stage) were accompanied by more pronounced decreases in motor activity during the 3-month interval. Taken together, these data corroborate the idea of a continuously changing motor-network function in ALS, indicating that activity changes in the motor-system caused by progressive neurodegeneration are most pronounced at early stages of the disease, while the breakdown of functional compensatory processes occurs later.
4.2. Functional changes in the hippocampus during ALS disease-progression
Traditionally considered as a neurodegenerative disease selectively affecting the motor-system, ALS is now conceptualized as a multisystem disorder also affecting other cognitive domains. While only a proportion of ALS patients develop actual clinical signs of frontotemporal dementia (Lomen-Hoerth et al., 2002), milder cognitive and behavioral impairments occur in up to 50% of the patients (Hammer et al., 2011; Lomen-Hoerth et al., 2002; Phukan et al., 2012; Raaphorst et al., 2010). In agreement with these data, we observed cognitive deficits in more than 40% of our patients – predominantly but not exclusively in the form of executive dysfunctions. Moreover, comparable to earlier studies (Hammer et al., 2011; Mantovan et al., 2003; Phukan et al., 2012; Raaphorst et al., 2010), 14–21% also exhibited deficits in the memory domain.
However, although memory dysfunctions and concordant hippocampal neurodegeneration (Anderson et al., 1995; Grosskreutz et al., 2006; Kato et al., 1997; Neumann et al., 2006; Takeda et al., 2009; Takeda et al., 2007; Wightman et al., 1992) have repeatedly been described, no study so far directly addressed a potential functional affection of the hippocampus in ALS. Particularly, it is not clear how the hippocampal lesions evolve over time and how they translate into hemodynamic activity changes. To bridge this gap, the current task-design comprised the presentation of task-irrelevant novel stimuli shown to elicit robust hippocampal activations (Bunzeck and Duzel, 2006; Stoppel et al., 2009). Beyond this robust activation of the hippocampus, the novelty-processing network activated by this task-design comprised occipital vision-related (fusiform and lingual gyrus) and temporal memory-related (parahippocampal gyrus and hippocampus) regions (Bunzeck and Duzel, 2006; Stoppel et al., 2009), which showed no overlap to the classical motor-network described above. In contrast to the activity in this motor network – which was initially higher than in controls and decreased in the 3-month interval − the hippocampal activations were higher in the second measurement and not different from that in healthy controls. Such increased hippocampal responses have previously been described in mild cognitive impairment and interpreted as a compensatory recruitment of neural resources to overcome early disease stage dysfunctions (Bookheimer et al., 2000; Dickerson and Sperling, 2008; Woodard et al., 2009). Moreover, similar hyperactivations across different brain areas indicating fresh lesions were observed in other early-stage neurodegenerative disorders such as pre-manifest Parkinsonism or Huntington's disease (Buhmann et al., 2005; Kloppel et al., 2009). Given that most of our patients showed no or only slight memory impairments, the hippocampal hyperactivity in the second measurement might indeed reflect such compensation processes to overcome early lesions (Agosta et al., 2010; Anderson et al., 1995; Takeda et al., 2009; Tsermentseli et al., 2012). Consequently, the present results suggest that hippocampal dysfunctions develop at later disease stages than the motor-system lesions. This is further supported by the inverse correlation between the hippocampal activity increase and the patients' ALSFRS-R scores (i.e. a more pronounced enhancement was evident at later stages of the disease).
In this context it has to be noted that an increase of hippocampal novelty-related activity only was observed in the patient group, while no significant differences were observed in comparison to controls or within the control group across the 3 months. This is most likely due to the fact that the relative increase of hemodynamic activity in patients is a rather small effect and therefore not significantly different from the stable activity level of controls (that probably lies in between the activation level of the first and second measurements in ALS patients). This points out to the importance of longitudinal designs for studying disease-related neurodegenerative changes and provides a convincing explanation why previous studies that compared ALS patients with controls did not find hemodynamic activity-differences in the hippocampus. Strong decreases of activity in this region are certainly present at later stages of the disease, while early stages seem to be rather indexed by a compensatory activity-increase as observed in the present study.
4.3. Structural alterations in ALS patients relative to controls
Several studies described structural neurodegenerative alterations in ALS not only within motor areas, but also across multiple frontotemporal, limbic or subcortical structures (Agosta et al., 2010; Anderson et al., 1995; Grosskreutz et al., 2006; Kato et al., 1997; Neumann et al., 2006; Takeda et al., 2009; Tsermentseli et al., 2012; Wightman et al., 1992). As for the functional results, the pattern of changes was quite inconsistent across studies, probably due to differences in the disease stages of the patient populations. In addition, early-stage neurodegeneration is primarily indexed by microstructural alterations as e.g. intra- or extracellular matrix alterations, gliosis and axonal density-changes (Douaud et al., 2013; Khandelwal et al., 2011; Robberecht and Philips, 2013), which are not well detected by VBM based on T1-weighted brain volumes (Kabani et al., 2002; van der Flier et al., 2002). To address this problem, we employed magnetization transfer imaging, which detects not only volumetric changes (as e.g. neuronal loss or tissue shrinkage) but also microstructural alterations dependent of tissue myelination, axonal density, or gliosis (Grossman et al., 1994; Hanyu et al., 2000; van Waesberghe et al., 1999; Wolff and Balaban, 1994). This analysis is therefore sensitive to lesions present at early stages of neurodegeneration, as it has previously been demonstrated for several other diseases (Eckert et al., 2004; Kiefer et al., 2009; Perez-Torres et al., 2014; Ridha et al., 2007). Using a cross-sectional design, we thereby identified MTR-reductions in most previously described regions evident in T1-based volumetric analyses, including the precentral gyrus, frontal/orbitofrontal cortex, hippocampus, thalamus, and striatum. For most of these regions, however, results were inconsistent across previous investigations on T1-weighted images. Beyond that, most previous studies employing MTR to investigate structural differences related to ALS only focused on changes within the corticospinal tract (da Rocha et al., 2004; El Mendili et al., 2014; Kato et al., 1997; Tanabe et al., 1998; Verstraete et al., 2014) and to date only two studies analyzed MTR on whole-brain data in ALS using a ROI-based approach (Cosottini et al., 2011) or voxel-based volumetric analyses (Cosottini et al., 2013). These two studies also revealed changes in MTR across several motor/premotor and extra-motor regions, which is in good agreement with the current results. Importantly, beyond these previously described differences at cortical sites our analyses also revealed MTR reductions across several subcortical areas (hippocampus, thalamus and striatum). While previous imaging analyses (which mainly relied on T1-weighted brain volumes) failed to demonstrate ALS-related structural changes in these regions, histopathological investigations did show their affection during the course of the disease. Thus, our current results suggest that whole-brain VBM analyses based on magnetization transfer imaging are potentially more sensitive to early structural damage in rapid progressive neurodegenerative disorders.
4.4. Relationship between structural and functional changes in ALS
The fMRI part of the current study sought to investigate how motor- and novelty related regions are functionally affected within the short interval of 3 months of ALS progression, while the volumetric analyses aimed at identifying regions showing alterations of brain tissue in another group of socio-demographically comparable patients at similar disease stages using a cross-sectional design. Although the fMRI study was performed in a different patient sample than the VBM analysis, we sought to look roughly for commonalities between the functional alterations during disease progression and the structural changes obtained by means of our cross-sectional design. For this aim, we superimposed the statistical maps obtained for the functional differences between fMRI measurements from the first sample with those indexing the ALS related tissue differences from the larger second sample. Despite this rather coarse approach we observed a high degree of overlap between the disease-related changes in hemodynamic activity and those regions that are subject to structural damage (see Fig. 6). This was the case not only for functional alterations in motor regions, but also for those in the limbic system. Being aware that structural changes are the result of neural degeneration on a longer time scale, while hemodynamic measures reflect changes on a much shorter one, the high degree of overlap indicates that in ALS the functional changes occur in the same regions that are subject to structural damage.
Given that our structural and functional data were acquired using two separate cohorts on two different scanners, we acknowledge that no hard conclusions should be drawn despite the high degree of overlap between the structural and functional results. Thus, future within-subject comparisons clarifying to which extent the structural and functional changes in fact overlap are mandatory. Despite this fact, we nevertheless believe that our results are of rather high reliability, since the high degree of spatial overlap was achieved not because, but although the data were acquired under conditions of rather high variability (different scanners/ different cohorts).
4.5. Conclusions
The current longitudinal study revealed functional alterations in motor- and memory-related regions within only 3 months of ALS disease-progression. Moreover, we observed ALS related tissue differences at the same anatomical locations in a second patient sample studied cross-sectionally. These results indicate that ALS is a multisystem disorder, in which the hippocampus also is affected. Moreover, the dynamics of the observed fMRI changes suggest that the functional affection of motor- and memory-related regions emerges at different stages of ALS: While the motor-system lesions develop rather early, the hippocampal dysfunctions arise later in the course of the disease.
The knowledge of the progression-related dynamics within different functional systems (motor, memory etc.) during the course of ALS is essential for understanding the nature and development of the disease and provides a tremendous potential for fMRI to become a diagnostic tool in the future. The present data highlight the value of longitudinal fMRI investigations designed to specifically address particular functional alterations emerging during the progression of ALS and signify their potential usefulness as a diagnostic tool for neurodegenerative disorders.
Conflict of interest
The authors declare that they have no conflict of interest.
Source of funding
This work was supported by the Deutsche Forschungsgemeinschaft (Scho 1217/1-2 and SFB 779-A1 to M.A.S.).
Acknowledgments
The authors thank Dr. Michael Scholz for the technical advice.
References
- Great Lakes ALS Study Group A comparison of muscle strength testing techniques in amyotrophic lateral sclerosis. Neurology. 2003;61:1503–1507. doi: 10.1212/01.wnl.0000095961.66830.03. 14663032 [DOI] [PubMed] [Google Scholar]
- Agosta F., Chiò A., Cosottini M., De Stefano N., Falini A., Mascalchi M., Rocca M.A., Silani V., Tedeschi G., Filippi M. The present and the future of neuroimaging in amyotrophic lateral sclerosis. AJNR. American Journal of Neuroradiology. 2010;31:1769–1777. doi: 10.3174/ajnr.A2043. 20360339 [DOI] [PMC free article] [PubMed] [Google Scholar]
- Anderson V.E., Cairns N.J., Leigh P.N. Involvement of the amygdala, dentate and hippocampus in motor neuron disease. Journal of the Neurological Sciences. 1995;129(Suppl.):75–78. doi: 10.1016/0022-510x(95)00069-e. 7595627 [DOI] [PubMed] [Google Scholar]
- Andres P.L., Finison L.J., Conlon T., Thibodeau L.M., Munsat T.L. Use of composite scores (megascores) to measure deficit in amyotrophic lateral sclerosis. Neurology. 1988;38:405–408. doi: 10.1212/wnl.38.3.405. 3347344 [DOI] [PubMed] [Google Scholar]
- Aschenbrenner S., Tucha O., Lange K. Regensburger Wortfluessigkeits-Test. Hogrefe; Göttingen: 2000. [Google Scholar]
- Bookheimer S.Y., Strojwas M.H., Cohen M.S., Saunders A.M., Pericak-Vance M.A., Mazziotta J.C., Small G.W. Patterns of brain activation in people at risk for Alzheimer's disease. New England Journal of Medicine. 2000;343:450–456. doi: 10.1056/NEJM200008173430701. 10944562 [DOI] [PMC free article] [PubMed] [Google Scholar]
- Brett M., Anton J.-L., Valabregue R., Poline J.-B. Region of interest analysis using an SPM toolbox8th International Conference on Functional Mapping of the Human Brain, Sendai, Japan. 2002 [Google Scholar]
- Brickenkamp R., Zillmer E. The d2 Test of Attention. 1st ed. Hogrefe & Huber; Seattle, WA.: 1998. [Google Scholar]
- Brooks B.R., Miller R.G., Swash M., Munsat T.L. El Escorial revisited: revised criteria for the diagnosis of amyotrophic lateral sclerosis. Amyotrophic Lateral Sclerosis and Other Motor Neuron Disorders: Official Publication of the World Federation of Neurology, Research Group on Motor Neuron Diseases. 2000;1:293–299. doi: 10.1080/146608200300079536. 11464847 [DOI] [PubMed] [Google Scholar]
- Buhmann C., Binkofski F., Klein C., Büchel C., van Eimeren T., Erdmann C., Hedrich K., Kasten M., Hagenah J., Deuschl G., Pramstaller P.P., Siebner H.R. Motor reorganization in asymptomatic carriers of a single mutant Parkin allele: a human model for presymptomatic Parkinsonism. Brain: A Journal of Neurology. 2005;128:2281–2290. doi: 10.1093/brain/awh572. 15947065 [DOI] [PubMed] [Google Scholar]
- Bunzeck N., Düzel E. Absolute coding of stimulus novelty in the human substantia nigra/VTA. Neuron. 2006;51:369–379. doi: 10.1016/j.neuron.2006.06.021. 16880131 [DOI] [PubMed] [Google Scholar]
- Cedarbaum J.M., Stambler N., Malta E., Fuller C., Hilt D., Thurmond B., Nakanishi A. The ALSFRS-R: a revised ALS functional rating scale that incorporates assessments of respiratory function. BDNF ALS Study Group (Phase III) Journal of the Neurological Sciences. 1999;169:13–21. doi: 10.1016/s0022-510x(99)00210-5. 10540002 [DOI] [PubMed] [Google Scholar]
- Cosottini M., Cecchi P., Piazza S., Pesaresi I., Fabbri S., Diciotti S., Mascalchi M., Siciliano G., Bonuccelli U. Mapping cortical degeneration in ALS with magnetization transfer ratio and voxel-based morphometry. PloS One. 2013;8:e68279. doi: 10.1371/journal.pone.0068279. 23874570 [DOI] [PMC free article] [PubMed] [Google Scholar]
- Cosottini M., Pesaresi I., Piazza S., Diciotti S., Belmonte G., Battaglini M., Ginestroni A., Siciliano G., De Stefano N., Mascalchi M. Magnetization transfer imaging demonstrates a distributed pattern of microstructural changes of the cerebral cortex in amyotrophic lateral sclerosis. AJNR. American Journal of Neuroradiology. 2011;32:704–708. doi: 10.3174/ajnr.A2356. 21436337 [DOI] [PMC free article] [PubMed] [Google Scholar]
- da Rocha A.J., Oliveira A.S., Fonseca R.B., Maia A.C., Jr., Buainain R.P., Lederman H.M. Detection of corticospinal tract compromise in amyotrophic lateral sclerosis with brain MR imaging: relevance of the T1-weighted spin-echo magnetization transfer contrast sequence. AJNR. American Journal of Neuroradiology. 2004;25:1509–1515. 15502129 [PMC free article] [PubMed] [Google Scholar]
- Dickerson B.C., Sperling R.A. Functional abnormalities of the medial temporal lobe memory system in mild cognitive impairment and Alzheimer's disease: insights from functional MRI studies. Neuropsychologia. 2008;46:1624–1635. doi: 10.1016/j.neuropsychologia.2007.11.030. 18206188 [DOI] [PMC free article] [PubMed] [Google Scholar]
- Douaud G., Menke R.A., Gass A., Monsch A.U., Rao A., Whitcher B., Zamboni G., Matthews P.M., Sollberger M., Smith S. Brain microstructure reveals early abnormalities more than two years prior to clinical progression from mild cognitive impairment to Alzheimer’s disease. Journal of Neuroscience: the Official Journal of the Society for Neuroscience. 2013;33:2147–2155. doi: 10.1523/JNEUROSCI.4437-12.2013. 23365250 [DOI] [PMC free article] [PubMed] [Google Scholar]
- Eckert T., Sailer M., Kaufmann J., Schrader C., Peschel T., Bodammer N., Heinze H.J., Schoenfeld M.A. Differentiation of idiopathic Parkinson's disease, multiple system atrophy, progressive supranuclear palsy, and healthy controls using magnetization transfer imaging. NeuroImage. 2004;21:229–235. doi: 10.1016/j.neuroimage.2003.08.028. 14741660 [DOI] [PubMed] [Google Scholar]
- El Mendili M.M., Cohen-Adad J., Pelegrini-Issac M., Rossignol S., Morizot-Koutlidis R., Marchand-Pauvert V., Iglesias C., Sangari S., Katz R., Lehericy S., Benali H., Pradat P.F. Multi-parametric spinal cord MRI as potential progression marker in amyotrophic lateral sclerosis. PloS One. 2014;9:e95516. doi: 10.1371/journal.pone.0095516. 24755826 [DOI] [PMC free article] [PubMed] [Google Scholar]
- Ellis C.M., Simmons A., Jones D.K., Bland J., Dawson J.M., Horsfield M.A., Williams S.C., Leigh P.N. Diffusion tensor MRI assesses corticospinal tract damage in ALS. Neurology. 1999;53:1051–1058. doi: 10.1212/wnl.53.5.1051. 10496265 [DOI] [PubMed] [Google Scholar]
- Grosskreutz J., Kaufmann J., Frädrich J., Dengler R., Heinze H.J., Peschel T. Widespread Sensorimotor and Frontal Cortical Atrophy in Amyotrophic Lateral Sclerosis. BMC; Neurol 6: 2006. p. 17.16638121 [DOI] [PMC free article] [PubMed] [Google Scholar]
- Grossman R.I., Gomori J.M., Ramer K.N., Lexa F.J., Schnall M.D. Magnetization transfer: theory and clinical applications in neuroradiology. Radiographics: A Review Publication of the Radiological Society of North America, Inc. 1994;14:279–290. doi: 10.1148/radiographics.14.2.8190954. 8190954 [DOI] [PubMed] [Google Scholar]
- Hammer A., Vielhaber S., Rodriguez-Fornells A., Mohammadi B., Münte T.F. A neurophysiological analysis of working memory in amyotrophic lateral sclerosis. Brain Research. 2011;1421:90–99. doi: 10.1016/j.brainres.2011.09.010. 21963313 [DOI] [PubMed] [Google Scholar]
- Hanyu H., Asano T., Iwamoto T., Takasaki M., Shindo H., Abe K. Magnetization transfer measurements of the hippocampus in patients with Alzheimer's disease, vascular dementia, and other types of dementia. AJNR. American Journal of Neuroradiology. 2000;21:1235–1242. 10954274 [PMC free article] [PubMed] [Google Scholar]
- Kabani N.J., Sled J.G., Chertkow H. Magnetization transfer ratio in mild cognitive impairment and dementia of Alzheimer's type. NeuroImage. 2002;15:604–610. doi: 10.1006/nimg.2001.0992. 11848703 [DOI] [PubMed] [Google Scholar]
- Kato Y., Matsumura K., Kinosada Y., Narita Y., Kuzuhara S., Nakagawa T. Detection of pyramidal tract lesions in amyotrophic lateral sclerosis with magnetization-transfer measurements. AJNR. American Journal of Neuroradiology. 1997;18:1541–1547. 9296197 [PMC free article] [PubMed] [Google Scholar]
- Kew J.J., Leigh P.N., Playford E.D., Passingham R.E., Goldstein L.H., Frackowiak R.S., Brooks D.J. Cortical function in amyotrophic lateral sclerosis. A positron emission tomography study. Brain. 1993;116(3):655–680. doi: 10.1093/brain/116.3.655. [DOI] [PubMed] [Google Scholar]
- Khandelwal P.J., Herman A.M., Moussa C.E. Inflammation in the early stages of neurodegenerative pathology. Journal of Neuroimmunology. 2011;238:1–11. doi: 10.1016/j.jneuroim.2011.07.002. 21820744 [DOI] [PMC free article] [PubMed] [Google Scholar]
- Kiefer C., Brockhaus L., Cattapan-Ludewig K., Ballinari P., Burren Y., Schroth G., Wiest R. Multi-parametric classification of Alzheimer's disease and mild cognitive impairment: the impact of quantitative magnetization transfer MR imaging. Neuroimage. 2009;48:657–667. doi: 10.1016/j.neuroimage.2009.07.005. 19607926 [DOI] [PubMed] [Google Scholar]
- Klöppel S., Draganski B., Siebner H.R., Tabrizi S.J., Weiller C., Frackowiak R.S. Functional compensation of motor function in pre-symptomatic Huntington's disease. Brain: A Journal of Neurology. 2009;132:1624–1632. doi: 10.1093/brain/awp081. 19369489 [DOI] [PMC free article] [PubMed] [Google Scholar]
- Kollewe K., Münte T.F., Samii A., Dengler R., Petri S., Mohammadi B. Patterns of cortical activity differ in ALS patients with limb and/or bulbar involvement depending on motor tasks. Journal of Neurology. 2011;258:804–810. doi: 10.1007/s00415-010-5842-7. 21128080 [DOI] [PubMed] [Google Scholar]
- Konrad C., Henningsen H., Bremer J., Mock B., Deppe M., Buchinger C., Turski P., Knecht S., Brooks B. Pattern of cortical reorganization in amyotrophic lateral sclerosis: a functional magnetic resonance imaging study. Experimental Brain Research. 2002;143:51–56. doi: 10.1007/s00221-001-0981-9. 11907690 [DOI] [PubMed] [Google Scholar]
- Lezak M.D., Howieson D.B., Loring D.W. Neuropsychological Assessment. fourth edition. Oxford University Press; New York: 2004. [Google Scholar]
- Lomen-Hoerth C., Anderson T., Miller B. The overlap of amyotrophic lateral sclerosis and frontotemporal dementia. Neurology. 2002;59:1077–1079. doi: 10.1212/wnl.59.7.1077. 12370467 [DOI] [PubMed] [Google Scholar]
- Maekawa S., Al-Sarraj S., Kibble M., Landau S., Parnavelas J., Cotter D., Everall I., Leigh P.N. Cortical selective vulnerability in motor neuron disease: a morphometric study. Brain: A Journal of Neurology. 2004;127:1237–1251. doi: 10.1093/brain/awh132. 15130949 [DOI] [PubMed] [Google Scholar]
- Mantovan M.C., Baggio L., Dalla Barba G., Smith P., Pegoraro E., Soraru G., Bonometto P., Angelini C. Memory deficits and retrieval processes in ALS. European Journal of Neurology: the Official Journal of the European Federation of Neurological Societies. 2003;10:221–227. doi: 10.1046/j.1468-1331.2003.00607.x. 12752394 [DOI] [PubMed] [Google Scholar]
- Mohammadi B., Kollewe K., Samii A., Dengler R., Münte T.F. Functional neuroimaging at different disease stages reveals distinct phases of neuroplastic changes in amyotrophic lateral sclerosis. Human Brain Mapping. 2011;32:750–758. doi: 10.1002/hbm.21064. 20836159 [DOI] [PMC free article] [PubMed] [Google Scholar]
- Müller-Vahl K.R., Kaufmann J., Grosskreutz J., Dengler R., Emrich H.M., Peschel T. Prefrontal and Anterior Cingulate Cortex Abnormalities in Tourette Syndrome: Evidence from Voxel-based Morphometry and Magnetization Transfer Imaging. BMC; Neurosci 10: 2009. p. 47.19435502 [DOI] [PMC free article] [PubMed] [Google Scholar]
- Neary D., Snowden J.S., Gustafson L., Passant U., Stuss D., Black S., Freedman M., Kertesz A., Robert P.H., Albert M., Boone K., Miller B.L., Cummings J., Benson D.F. Frontotemporal lobar degeneration: a consensus on clinical diagnostic criteria. Neurology. 1998;51:1546–1554. doi: 10.1212/wnl.51.6.1546. 9855500 [DOI] [PubMed] [Google Scholar]
- Neumann M., Sampathu D.M., Kwong L.K., Truax A.C., Micsenyi M.C., Chou T.T., Bruce J., Schuck T., Grossman M., Clark C.M., McCluskey L.F., Miller B.L., Masliah E., Mackenzie I.R., Feldman H., Feiden W., Kretzschmar H.A., Trojanowski J.Q., Lee V.M. Ubiquitinated TDP-43 in frontotemporal lobar degeneration and amyotrophic lateral sclerosis. Science (New York, N.Y.) 2006;314:130–133. doi: 10.1126/science.1134108. 17023659 [DOI] [PubMed] [Google Scholar]
- Pérez-Torres C.J., Reynolds J.O., Pautler R.G. Use of magnetization transfer contrast MRI to detect early molecular pathology in Alzheimer's disease. Magnetic Resonance in Medicine: Official Journal of the Society of Magnetic Resonance in Medicine / Society of Magnetic Resonance in Medicine. 2014;71:333–338. doi: 10.1002/mrm.24665. 23413044 [DOI] [PubMed] [Google Scholar]
- Phukan J., Elamin M., Bede P., Jordan N., Gallagher L., Byrne S., Lynch C., Pender N., Hardiman O. The syndrome of cognitive impairment in amyotrophic lateral sclerosis: a population-based study. Journal of Neurology, Neurosurgery, and Psychiatry. 2012;83:102–108. doi: 10.1136/jnnp-2011-300188. 21836033 [DOI] [PubMed] [Google Scholar]
- Raaphorst J., de Visser M., Linssen W.H., de Haan R.J., Schmand B. The cognitive profile of amyotrophic lateral sclerosis: a meta-analysis. Amyotrophic Lateral Sclerosis: Official Publication of the World Federation of Neurology Research Group on Motor Neuron Diseases. 2010;37:27–37. doi: 10.3109/17482960802645008. 19180349 [DOI] [PubMed] [Google Scholar]
- Ridha B.H., Symms M.R., Tozer D.J., Stockton K.C., Frost C., Siddique M.M., Lewis E.B., MacManus D.G., Boulby P.A., Barker G.J., Rossor M.N., Fox N.C., Tofts P.S. Magnetization transfer ratio in Alzheimer disease: comparison with volumetric measurements. AJNR. American Journal of Neuroradiology. 2007;28:965–970. 17494679 [PMC free article] [PubMed] [Google Scholar]
- Robberecht W., Philips T. The changing scene of amyotrophic lateral sclerosis. Nature Reviews. Neuroscience. 2013;14:248–264. doi: 10.1038/nrn3430. 23463272 [DOI] [PubMed] [Google Scholar]
- Ruff R.M., Light R.H., Evans R.W. The Ruff Figural Fluency Test: a normative study with adults. Developmental Neuropsychology. 1987;3:3751. [Google Scholar]
- Schoenfeld M.A., Tempelmann C., Gaul C., Kühnel G.R., Düzel E., Hopf J.M., Feistner H., Zierz S., Heinze H.J., Vielhaber S. Functional motor compensation in amyotrophic lateral sclerosis. Journal of Neurology. 2005;252:944–952. doi: 10.1007/s00415-005-0787-y. 15750701 [DOI] [PubMed] [Google Scholar]
- Shin M.S., Park S.Y., Park S.R., Seol S.H., Kwon J.S. Clinical and empirical applications of the Rey–Osterrieth Complex Figure Test. Nature Protocols. 2006;1:892–899. doi: 10.1038/nprot.2006.115. 17406322 [DOI] [PubMed] [Google Scholar]
- Soukup V.M., Ingram F., Grady J.J., Schiess M.C. Trail Making Test: issues in normative data selection. Applied Neuropsychology. 1998;5:65–73. doi: 10.1207/s15324826an0502_2. 16318456 [DOI] [PubMed] [Google Scholar]
- Stoppel C.M., Boehler C.N., Strumpf H., Heinze H.J., Hopf J.M., Düzel E., Schoenfeld M.A. Neural correlates of exemplar novelty processing under different spatial attention conditions. Human Brain Mapping. 2009;30:3759–3771. doi: 10.1002/hbm.20804. 19434602 [DOI] [PMC free article] [PubMed] [Google Scholar]
- Strong M.J., Grace G.M., Freedman M., Lomen-Hoerth C., Woolley S., Goldstein L.H., Murphy J., Shoesmith C., Rosenfeld J., Leigh P.N., Bruijn L., Ince P., Figlewicz D. Consensus criteria for the diagnosis of frontotemporal cognitive and behavioural syndromes in amyotrophic lateral sclerosis. Amyotrophic Lateral Sclerosis: Official Publication of the World Federation of Neurology Research Group on Motor Neuron Diseases. 2009;10:131–146. doi: 10.1080/17482960802654364. 19462523 [DOI] [PubMed] [Google Scholar]
- Takeda T., Uchihara T., Arai N., Mizutani T., Iwata M. Progression of hippocampal degeneration in amyotrophic lateral sclerosis with or without memory impairment: distinction from Alzheimer disease. Acta Neuropathologica. 2009;117:35–44. doi: 10.1007/s00401-008-0447-2. 19002475 [DOI] [PubMed] [Google Scholar]
- Takeda T., Uchihara T., Mochizuki Y., Mizutani T., Iwata M. Memory deficits in amyotrophic lateral sclerosis patients with dementia and degeneration of the perforant pathway A clinicopathological study. Journal of the Neurological Sciences. 2007;260:225–230. doi: 10.1016/j.jns.2007.05.010. 17561122 [DOI] [PubMed] [Google Scholar]
- Tanabe J.L., Vermathen M., Miller R., Gelinas D., Weiner M.W., Rooney W.D. Reduced MTR in the corticospinal tract and normal T2 in amyotrophic lateral sclerosis. Magnetic Resonance Imaging. 1998;16:1163–1169. doi: 10.1016/s0730-725x(98)00129-5. 9858272 [DOI] [PMC free article] [PubMed] [Google Scholar]
- Tessitore A., Esposito F., Monsurrò M.R., Graziano S., Panza D., Russo A., Migliaccio R., Conforti F.L., Morrone R., Quattrone A., Di Salle F., Tedeschi G. Subcortical motor plasticity in patients with sporadic ALS: an fMRI study. Brain Research Bulletin. 2006;69:489–494. doi: 10.1016/j.brainresbull.2006.01.013. 16647577 [DOI] [PubMed] [Google Scholar]
- Tsermentseli S., Leigh P.N., Goldstein L.H. The anatomy of cognitive impairment in amyotrophic lateral sclerosis: more than frontal lobe dysfunction. Cortex; a Journal Devoted to the Study of the Nervous System and Behavior. 2012;48:166–182. doi: 10.1016/j.cortex.2011.02.004. 21396632 [DOI] [PubMed] [Google Scholar]
- Turner M.R., Hammers A., Al-Chalabi A., Shaw C.E., Andersen P.M., Brooks D.J., Leigh P.N. Distinct cerebral lesions in sporadic and ‘D90A’ SOD1 ALS: studies with [11C]flumazenil PET. Brain: A Journal of Neurology. 2005;128:1323–1329. doi: 10.1093/brain/awh509. 15843422 [DOI] [PubMed] [Google Scholar]
- van der Flier W.M., van den Heuvel D.M., Weverling-Rijnsburger A.W., Bollen E.L., Westendorp R.G., van Buchem M.A., Middelkoop H.A. Magnetization transfer imaging in normal aging, mild cognitive impairment, and Alzheimer's disease. Annals of Neurology. 2002;52:62–67. doi: 10.1002/ana.10244. 12112048 [DOI] [PubMed] [Google Scholar]
- van Waesberghe J.H., Kamphorst W., De Groot C.J., van Walderveen M.A., Castelijns J.A., Ravid R., Lycklama a Nijeholt G.J., van der Valk P., Polman C.H., Thompson A.J., Barkhof F. Axonal loss in multiple sclerosis lesions: magnetic resonance imaging insights into substrates of disability. Annals of Neurology. 1999;46:747–754. doi: 10.1002/1531-8249(199911)46:5<747::aid-ana10>3.3.co;2-w. 10553992 [DOI] [PubMed] [Google Scholar]
- Verstraete E., Polders D.L., Mandl R.C., Van Den Heuvel M.P., Veldink J.H., Luijten P., Van Den Berg L.H., Hoogduin J. Multimodal tract-based analysis in ALS patients at 7 T: a specific white matter profile? Amyotrophic Lateral Sclerosis & Frontotemporal Degeneration. 2014;15:84–92. doi: 10.3109/21678421.2013.844168. 24325276 [DOI] [PubMed] [Google Scholar]
- Wightman G., Anderson V.E., Martin J., Swash M., Anderton B.H., Neary D., Mann D., Luthert P., Leigh P.N. Hippocampal and neocortical ubiquitin-immunoreactive inclusions in amyotrophic lateral sclerosis with dementia. Neuroscience Letters. 1992;139:269–274. doi: 10.1016/0304-3940(92)90569-s. 1376881 [DOI] [PubMed] [Google Scholar]
- Wolff S.D., Balaban R.S. Magnetization transfer imaging: practical aspects and clinical applications. Radiology. 1994;192:593–599. doi: 10.1148/radiology.192.3.8058919. 8058919 [DOI] [PubMed] [Google Scholar]
- Woodard J.L., Seidenberg M., Nielson K.A., Antuono P., Guidotti L., Durgerian S., Zhang Q., Lancaster M., Hantke N., Butts A., Rao S.M. Semantic memory activation in amnestic mild cognitive impairment. Brain: A Journal of Neurology. 2009;132:2068–2078. doi: 10.1093/brain/awp157. 19515831 [DOI] [PMC free article] [PubMed] [Google Scholar]
- Ziemann U., Winter M., Reimers C.D., Reimers K., Tergau F., Paulus W. Impaired motor cortex inhibition in patients with amyotrophic lateral sclerosis. Evidence from paired transcranial magnetic stimulation. Neurology. 1997;49:1292–1298. doi: 10.1212/wnl.49.5.1292. 9371911 [DOI] [PubMed] [Google Scholar]