

Abstract
The laboratory mouse is increasingly a subject for visual system investigation, but there has been no comprehensive evaluation of this species’ visual projections. Here, projections were visualized and mapped following intraocular injection of cholera toxin B subunit. Tissue was processed using standard procedures applied to 30 Am free floating sections with diaminobenzidine as the chromogen. The mouse retina projects to approximately 46 brain regions, including 14 not previously described in this species. These include two amygdaloid nuclei, the horizontal limb of the diagonal band, the paraventricular hypothalamic nucleus, several visual thalamic nuclei, the paranigral nucleus, several pretectal nuclei, and the dorsal cortex of the inferior colliculus. Dense retinal patches were also observed in a narrow portion of the ipsilateral intermediate layer of the superior colliculus. The superior fasciculus of the accessory optic tract, which innervates the medial terminal nucleus, was also determined to be a terminal zone throughout its length. The results are compared with previous descriptions of projections from mouse intrinsically photoreceptive retinal ganglion cells, and with data from the hamster, Nile grass rat and laboratory rat. The retinal projection patterns are similar in all four species, although there are many differences with respect to the details. The specific visual functions of most retinorecipient areas are unknown, but there is substantial convergence of retinal projections onto regions concerned with olfaction and audition.
Keywords: visual system, non-image forming, melanopsin, retinorecipient, subcortical, auditory, olfactory, JAX:000664
The visual system has been extensively studied for many decades (e.g., Pemberton (1891); see Dhande and Huberman (2014) for an insightful review). Most of the research has focused on the classical visual system with the retina capturing photic signals which are sent to the brain where they are processed into image representations. A distinction between a ‘non-image forming’ visual system and a classical system devoted to higher order visual processing was suggested by Pickard and elaborated by Cooper and colleagues (Pickard, 1985; Cooper et al., 1993). This perspective has been strengthened by the discovery of melanopsin-containing, intrinsically photoreceptive retinal ganglion cells (ipRGCs; (Provencio et al., 1998; Berson et al., 2002)). Studies of these cells have provided new impetus to the evaluation of structure and function of both image and non-image forming visual systems (Hattar et al., 2002; Panda et al., 2002; Hattar et al., 2003; Dacey et al., 2005; Ecker et al., 2010; Schmidt et al., 2011).
Much of the recent research on the non-image forming visual system has been performed with transgenic mice. Ironically, the laboratory mouse is notably absent from the list of species for which the general pattern of retinal projections have been broadly described. This list includes several small rodents, including the California ground squirrel (Major et al., 2003) and, most recently, the Nile grass rat (Gaillard et al., 2013). The anatomy of the rat visual system has been the subject of many studies and a comprehensive review (Sefton and Dreher, 1995). There is also abundant, but incomplete documentation of the hamster visual system (Morin and Blanchard, 1997; Ling et al., 1998; Morin and Blanchard, 1999; Horowitz et al., 2004). A thorough review of the comparative literature on the anatomy of the visual pathways has been provided by Gaillard et al. (2013).
The most extensive neuroanatomical description of mouse retinal projections has been obtained from two strains engineered to permit identification of ipRGC centripetal pathways (Hattar et al., 2006; Ecker et al., 2010). These studies identified 27 mouse brain regions innervated by ipRGCs. Careful evaluation of the suprachiasmatic nucleus (SCN), subparaventricular area (sPa), intergeniculate leaflet (IGL), dorsal lateral geniculate (DLG), olivary pretectal nucleus (OPT) and superior colliculus (SC) has shown that each area is innervated jointly by retinal ganglion cells that do not contain melanopsin and by those that do (although the details of the terminal field patterns differ). Neither investigation documented the retinorecipient brain areas that did not receive input from ipRGCs (Hattar et al., 2006; Ecker et al., 2010).
The present investigation was conducted to obtain a more complete description of mouse retinorecipient brain regions and to compare them with the patterns demonstrated for other rodent species. (Morin and Blanchard, 1997; 1999; Horowitz et al., 2004). The visual projection patterns of the mouse are generally similar to those of other diurnal or nocturnal, rodent species, but there are numerous differences with respect to the details of such innervation.
METHODS
Intraocular Injections
Adult 8–10 wk old, male mice of the C57BL/6J strain (JAX:000664, Jackson Labs, Bar Harbor, ME) were deeply anesthetized with a mix of ketamine (100 mg/kg; Butler Supply, Dublin, OH) and xylazine (10 mg/kg, Lloyd Laboratories, Shenandoah, IA). Each animal’s left eyelid was gently retracted with fingers, allowing the eyeball to protrude. A 32 gauge needle with a 45 degree bevel was attached to a Hamilton syringe and used to make a unilateral intra-ocular injection of 4 μg cholera toxin β subunit (CTB; #103B, List Laboratories, Campbell, CA) in 2 μl 0.9% saline with 2% DMSO. The needle was inserted nasally at the level of the ora serrata and advanced into the posterior chamber under visual control. It remained in place for 2 minutes after each injection and was slowly retracted. The eyelid was then released, allowing the eyeball to retract into the orbit. Seven (N=5) or 14 (N=2) days were allowed for tracer transport. All experimental procedures were approved by the Institutional Animal Care and Use Committee of Stony Brook University.
Immunohistochemistry
The injected animals were re-anesthetized with the ketamine/xylazine mixture and perfused with physiological saline and 4% paraformaldehyde in 0.1 M phosphate buffer, pH 7.4. Each brain was removed, post-fixed overnight at 4°C, cryoprotected in 20% sucrose for 24–48 hr, then sectioned in the coronal plane at 30 μm on a freezing stage microtome. Four series of free floating sections were cut through the inferior colliculus, collected in 0.1 M phosphate-buffered saline with 0.05% sodium azide, pH 7.4 (PBS). The primary antibody was goat anti-CTB (List Biological Labs., Inc; Campbell, CA) and the secondary antibody was biotinylated donkey anti-goat (# 705-065-147, Jackson ImmunoResearch, West Grove, PA). Brain sections were incubated in the primary antiserum diluted 1:40,000 in a phosphate buffered saline (PBS) containing 0.01% Triton-X 100 and 0.01% thimerosal (‘PBS solution’) for 48h at 4°C. The sections were then washed with PBS and incubated in the secondary antiserum diluted 1:500 in PBS solution for 90 minutes at room temperature. Sections were again rinsed with PBS and the CTB localization was visualized using the ABC technique (Hsu et al., 1981). Briefly, the sections were incubated in ABC solution (Vector Labs, Burlingame, CA) for 90 minutes, rinsed with 0.05M Tris pH 7.2 buffer, reacted with diaminobenzidine (#D5637, Sigma-Aldrich, Inc., St. Louis, MO), and mounted on gelatin-coated glass slides. After being air dried, the tissue was coverslipped with Krystalon (EMD Millipore, Billerica, MA). The source of the CTB and anti-CTB were the same as in previous intracranial retrograde tract tracing studies (Morin and Blanchard, 1998; Horowitz et al., 2004) and in studies of retinal projections (Goz et al., 2008; Gaillard et al., 2013). Stained retinal projections were not evident in sections from brains of animals not injected with CTB.
Brain sections with retinal projections showing immunoreactivity (IR) to CTB received preliminary assessment using darkfield microscopy. The two brains with the most robust retinal projections were selected for further analysis. Drawings of the projections in each brain series were made using a camera lucida.
Brightfield photomicrographs were obtained with a Zeiss AxioCam attached to a Zeiss Axioplan 2 microscope controlled by AxioVision v4.6 (Carl Zeiss, Oberkochen, Germany). Most images were shot at 10 or 20x magnification, with composites created using Adobe Photoshop CS5 (Adobe Systems, Inc., San Jose, CA) and multiple stitched images. Darkfield photomicrographs were obtained with a Spot camera (http://www.spotimaging.com/) mounted on a Nikon Optiphot microscope. Individual images were adjusted for brightness, contrast and sharpness with Corel Photo-Paint X6, then assembled and labeled using CorelDraw X6 (Corel Corp., Ottawa, Ontario, Canada).
RESULTS
MOUSE
Retinal projections of the mouse present a pattern of innervation generally typical of other small rodent species, with the best known retinorecipient nuclei, those of the subcortical visual shell, containing dense terminal fields on the side contralateral to the injected eye. Many other regions (Fig. 1; Table 1) also receive retinal input and are described below in greater detail. Two week transport time did not improve the signal level beyond that seen after one week.
Figure 1.


Map of retinal projections in c57bl\6j mouse after a left eye injection of CT-B. Tracings from 30 μm thick brain sections (A–R) were made using a camera lucida. Labeling of structures was guided by reference to the Paxinos and Franklin (2004) mouse brain atlas and the Morin and Wood (2001) hamster brain atlas. Arrowheads in levels M and mm (level mm is approximately 60 μm caudal to level M) point at labeled ipsi- and contralateral projections medial to the MT. Closed circles shown in the oculomotor nucleus (labeled ‘3’) in levels N and O identify retrogradely labeled cell bodies.
Table 1.
Retinorecipient regions in the mouse brain
| Mouse (contra/ipsi) | Mouse a ipRGC proj. | Hamster b | Grass Rat c | Rat | |
|---|---|---|---|---|---|
| Basal Forebrain | |||||
| AAV | +/− | − | + | − | + g |
| ACo | − | ± d | |||
| HDB | +/± | ± | ± d | + q | |
| LOT | −/− | − | + | − | − g |
| MeA | +/+ | + | + | ± | + q |
| MePV | +/+ | + d | + q | ||
| Pir | − | − | + | − | − g |
| PRh | − | − | + | − | − g |
| SI | ++/− | ± | − d | − | |
| Tu | − | − | + | − | + q |
| Hypothalamus | |||||
| AH | +/+ | + | +++ | ++ | + g |
| DA | − | − | + 1 | − | |
| DM | − | − | + | − | + m |
| LA | +/+ | + | + | ++ | + g |
| LH | ++/+ | + | ++ | ++ | + e,g |
| LPO | +/− | + | ++ d | − | + m |
| MPA | ±/− | + | − | + | + q |
| MPO | − | − | − | ++ | + q |
| Pa | ±/± | − | ± | ± | + q |
| Pe | − | ± d | ++ | + q | |
| pSON | +++/++ | +++ | +++ d | +++ | + e,g |
| RCh | ++/++ | + | ++ | ++ | + g |
| SCN | +++++/+++++ | +++++ | +++++ | ++++ | + g |
| SON | ++ | ± | ± | + p,q | |
| sPa | ++/++ | + | ++ | ± | + g |
| VLPO | ±/± | + | ++ | + | + e,n |
| VMH | − | + | + | − | DtN + m |
| Thalamus and Subthalamus | |||||
| AD | +/− | ± | + | ± | + h |
| AV | − | + h | |||
| BSTPI | − | − | +++ | − | |
| BSTPL | − | − | − | ± | |
| BSTPM | +/− | ± | +++ | + | + h,q |
| DLG | +++++/+++ | ++ | ++++ | +++++ | + f |
| IGL | ++++/+++ | ++++ | +++ | +++ | + f |
| IMA | ±/− | − | ++ | ||
| CL | D ++/+ | + | + | ± | |
| LP | ++/+ | − | +++ | ++ | + f |
| PHb | +++/± | +++ | ++ d | ± | + p |
| PP | ++++/+ | ++++ d | |||
| PVA | − | − | − d | ± | |
| Re | − | − | ± | ± | |
| SG | +/− | − | + d | ++ | |
| SubG | ++/− | + | ++ | ||
| VLG | ++++/++ | +++ | ++++ | +++++ | + f |
| ZI | +/− | ± | + | ± | + s |
| Pretectum | |||||
| APT(dorsal) | +++/± | − | + | +++ | − o |
| CPT | +++/+ | ++ | + | + | + e |
| MPT | +++/++ | − | ++ | ++ | + q |
| NOT | +++++/+ | − | ++++ | +++++ | + f |
| OPT | ++++/+++ | ++++ | ++++ | ++++ | + e,f |
| PLi | ++/+ | +++ | +++ | ++ | + f |
| PPT | +++++/+++ | +++ | +++ | ++++ | + f |
| Accessory Optic Nuclei | |||||
| DT | ++++/++ | − | ++++ d | +++++ | + r |
| LT | ++/+ | − | ++++ | ++ | + r |
| MT | +++++/+++ | − | +++++ | +++++ | + r |
| tzSF | +++++/+++ | +++++ | |||
| Superior Colliculus | |||||
| Zo | +++++/++ | +/− | +++++ | +++++ | + e |
| SuG | +++++/+ | + | +++++ d | +++++ | + e |
| Op | +++++/+++ | ++ | +++++ d | +++++ | + e |
| InG | +++/+ 2 | − | +++ d | + | + e |
| InWh | − | + d | |||
| Other Midbrain | |||||
| DCIC | +/− | − | ++ d | ± | + i |
| DR | − | +/− | − d | − | + j,k |
| LPB | − | − | − | − | + l |
| MRF | − | − d | ± | ||
| PAG | − | +/− | + d | ± | + j |
| PN | ±/− | ± d | |||
Estimated Density: extremely dense +++++; dense ++++; moderate +++; modest ++; sparse +; very sparse ±; none −; an empty cell indicates no data available; for the rat, ‘+’ indicates ‘present’);D – dorsal part; DtN – dorsal to the nucleus.
(Morin and Blanchard, unpub. data);
(Fleming et al., 2006);
(Itaya et al., 1981);
(Itaya and Vanhoesen, 1982);
(Shen and Semba, 1994);
(Fite et al., 1999);
(Fite and Janusonis, 2002);
(Canteras et al., 2011);
(Lu et al., 1999);
(Qu et al., 1996);
(Levine et al., 1991);
Basal Forebrain and Hypothalamus
Labeled retinal projections are visible rostrally in the basal hypothalamus at the level of the anterior commissure. Fibers are very sparse (Fig. 1A,B) and are found near the optic chiasm in the basal medial preoptic area (MPA) and ventrolateral preoptic area (VLPO; Figs. 1A,B; 2A). Caudal to the VLPO, a small plexus of scattered fibers and terminal is found in the horizontal limb of the diagonal band (HDB). It extends caudally (Fig. 1C–E), continuing, largely contralaterally, into the substantia innominata (SI; Figs. 1G–J; 3A). Ventrolaterally, at the same brain levels, retinal projections with terminals are evident in a sparse field extending caudally from the ventral anterior amygdaloid area (AAV) into the anteroventral medial amygdala (MeAV), persisting into the anterior medial amygdala (MeA; Figs. 1C–J; 2B; 3) before ending caudally in the contralateral posteroventral medial amygdala (MePV; Fig. 1J).
Figure 2.
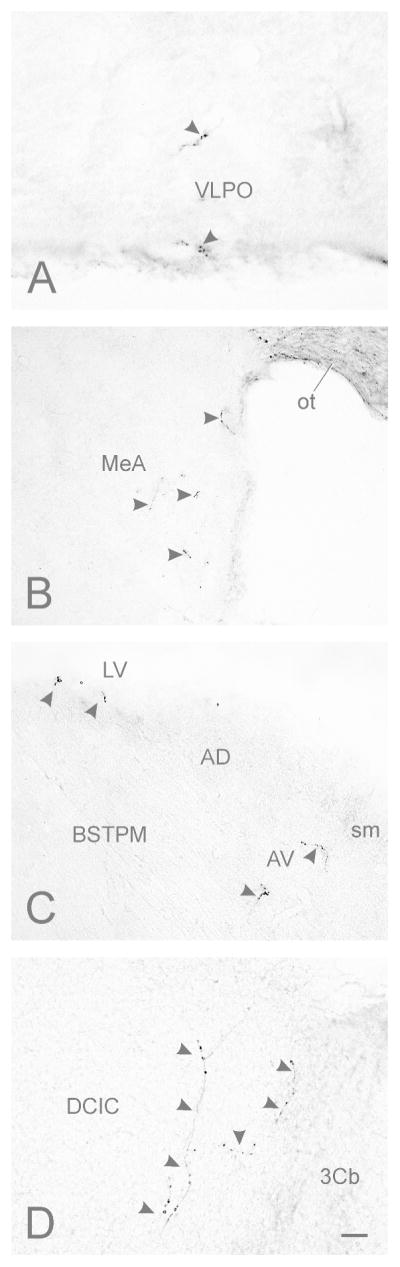
Photomicrographs of contralateral retinorecipient regions in mouse brain. (A) Ventrolateral preoptic area (VLPO; density = ±); (B) Anterior medial amygdala (MeA; density = +); (C) bed nucleus of the stria terminalis, posteromedial division (BSTPM; density = ±); (D) dorsal cortex of the inferior colliculus (DCIC; density = +). Arrowheads indicate terminals and fibers originating from retinal ganglion cells. No ipsilateral projections were seen in the inferior colliculus. Bar in (H) = 10 μm.
Figure 3.

Darkfield photomicrograph showing retinal projections in the substantia innominata (SI; density = ++; arrowheads) at the level of Fig. 1H. Projections are also evident in adjacent anterior medial amygdala (MeA; arrows). Bar = 100 μm.
Medially, the rostral pole of the suprachiasmatic nucleus (SCN) receives substantial retinal input and at least partially defines the rostral aspect of this structure. The SCN terminal field encompasses the entire nucleus (Figs. 1D–F; 4A). Fibers extend dorsally and laterally from the SCN and terminate in much of adjacent anterior hypothalamus (AH; Fig. 1D–G; 4A,B). Fibers with terminals are present in a zone extending dorsolaterally from the SCN across central AH toward the fornix (Fig. 1E,F; 4A). A portion of this loose terminal field extends dorsally from the midline retrochiasmatic region into the sPa, with a few projections found in the magnocellular division of the paraventricular hypothalamus (Pa) and the posterior paraventricular hypothalamic nucleus (PaPo; Figs. 1G,H; 4A,B). Directly caudal to the SCN, sparse retinal innervation is present in the ventral and medial AH, sPa and very sparsely in the periventricular hypothalamus (Pe).
Figure 4.

Brightfield photomicrographs showing contralateral projections to the mid-level mouse suprachiasmatic nucleus (SCN) and adjacent hypothalamus. (A) Projections to the SCN are very dense (density = +++++), with moderately dense projections extending dorsally into the subparaventricular hypothalamus (sPa; density = ++) and medial anterior hypothalamus (AH; density = +; asterisk). Dorsolaterally, very sparse projections are found in close proximity to the fornix (arrow; cf. Fig. 1E–G). Very sparse innervation (density = ±) is present in the periventricular hypothalamus (arrowhead). (B) In a plane of section caudal to the SCN, sparse innervation is visible in the retrochiasmatic area (RCh; density = +), medial AH and sPa, with very sparse innervation (density = ±) present in the Pa (arrowhead). In this image, moderately dense innervation is seen in the peri-supraoptic nucleus (pSON; density = +++) and modestly dense innervation in the lateral hypothalamus (LH; density = ++). Bars = 200 μm.
Laterally, retinal projections are moderately dense in the supraoptic (SON) and peri-supraoptic regions (pSON; Figs. 1E–G; 4A,B). Small numbers of fibers with terminals are scattered lateral to the SCN and ventrally through the lateroanterior hypothalamic (LA) and lateral hypothalamic nuclei (LH), Further caudally, very sparse projections are also present lateral to the ventromedial hypothalamic nucleus (VMH) in tuberal hypothalamus (Fig. 1I).
Bed Nucleus and Thalamus
At the level of the rostral anterior paraventricular thalamic nucleus (PVA), sparse fibers extend medially from near the stria terminalis into the vicinity of the posteromedial bed nucleus of the stria terminalis (BSTPM; Figs. 1D; 2C). The fibers project ventromedially in the BSTPM. A few fibers with terminals are slightly more dorsal, apparently in, or at the interface of, the anteroventral thalamic nucleus (AV).
A separate terminal field, here designated the para-habenular zone (PHb), is evident about 300–400 μm caudally in dorsal thalamus. It arises from fibers extending medially along the superficial laterodorsal thalamic nucleus (LD; Fig. 1G), terminating in a small, dense superficial plexus. Rostrally, the plexus is found in the dorsomedial anterodorsal thalamic nucleus (AD; Fig. 1G–H). The PHb is fairly long and extends superficially within the AD and centrolateral thalamic nucleus (CL) for approximately 400 Am caudally along the borders of the habenular commissure, stria medullaris and lateral habenula (LHb; Figs. 1I–K; 5A,B). The caudal extension of the LHb continues beyond the thalamus and is contiguous with a corresponding, but broader, more ventral, loose terminal field in the commissural pretectal nucleus (CPT; Figs. 1L; 5C).
Figure 5.

Darkfield photomicrographs showing retinal innervation in nuclei of the mouse subcortical visual shell. Level (A) is the most rostral and corresponds to Fig. 1J. Level (B) is about 60 μm caudal to Fig. 1J and level (C) is about 120 μm further caudal, between Fig. 1K and L. (A, B) Arrowheads and brackets delineate moderate retinal innervation in portions of the elongated para-habenular zone (PHb; density = +++). Fibers extend into the dorsal part of the centrolateral (CL) thalamic nucleus from the brachium of the superior colliculus (bsc). (B), * identifies a ventromedial sector of the DLG that is spatially distinct from the remainder of the nucleus. (C, Inset) is a brightfield enlargement of the CPT region delineated by the dashed rectangle. Retinal innervation is sparse (density = +), but broadly distributed across the CPT. Bar in (B) = 500 μm and applies to the darkfield images (A–C).
The most rostral IGL (Fig. 1I) appears as labeled fibers emerging from the optic tract immediately dorsal to the dorsolateral reticular thalamic nucleus (Rt) where they form a small dense plexus. The entire IGL is densely innervated by the contralateral retina, but also receives substantial ipsilateral input. Mid-rostrally, the IGL assumes a triangular shape (Figs. 1J; 5A) that gives way to the classical “leaflet” formation, with the middle level IGL intercalated between the DLG and ventrolateral geniculate nucleus (VLG; Figs. 1K,L; 5B,C). Caudally, the retinal terminal field in the IGL extends ventrally and medially (Fig. 5C), eventually extending ventromedially below the medial geniculate nucleus (MG; Fig. 1L), arcing along the curvature of MGV (Figs. 1M; 8B1).
Figure 8.

Darkfield photomicrographs showing retinal projections to the accessory optic terminal nuclei and adjacent structures in the mouse. (A) Dorsal terminal nucleus (DT; contralateral; density = ++++); (B1,B2) Lateral terminal nucleus (LT; density = ++) at two contralateral levels (B1; rostral) and (B2; caudal); and (D) Medial terminal nuclei (MT; bilateral; density = +++++/+++ contra/ipsi). In (A), the DT is superficially present at the juncture of midbrain and thalamus. Ventral to it are projections (arrowheads) that lie in the caudal PLi or MG/SG (see Discussion). In (B1), the LT is evident immediately below the MGV and the most caudal IGL, at the dorsal boundary of the cerebral peduncle and the most caudal remnant of the optic tract (cf., Fig. 1M). Slightly more caudally (B2), neither the optic tract nor the IGL is present. In (B2), the Arrowhead points at retinal fibers crossing the caudal MGV. In (C), the MT is visible bilaterally. A small medial extension of the contralateral MT is indicated by the arrow, and arrowheads point at very sparse projections in the paranigral nucleus (PN; cf., Fig. 1M,mm; density = ±). Bars for A, C = 200 μm; bars for B1–2 = 100 μm.
At the mid-rostral level of the IGL, moderately dense retinal projections are seen terminating in the subgeniculate nucleus (SubG; Figs. 1K; 6A), ventral to the VLG. This terminal field is contiguous with the small, rostrally dense plexus in the peripeduncular nucleus (PP), immediately dorsal to the cerebral peduncle (Figs. 1K,L; 6A,B). Sparse retinal projections can be seen extending ventromedially from the PP area into the lateral aspect of the ventral zona incerta. Projections into the lateral part of the dorsal zona incerta (ZID) extend ventromedially from the adjacent IGL (Fig. 1L). It should be noted that the boundary distinguishing caudal IGL and VLG from adjacent zona incerta is not obvious.
Figure 6.

Darkfield photomicrographs showing retinal projections to the mouse VLG and sub-geniculate region (as in Fig. 1K). (A) Modestly dense fibers and terminals are present in the subgeniculate nucleus (SubG; density = ++), ventral to the ventrolateral geniculate region, with dense innervation evident in the central part of the peripeduncular nucleus (PP; density = ++++). Arrowheads identify sparse projections in the dorsolateral part of the ventral zona incerta (ZIV; density = +). (B) Retinal projections in the caudal PP and extending further ventromedially in the ZIV (arrowheads). Bars = 200 μm.
The area of the DLG is substantially delineated by the dense terminal field contralateral to the injected eye. Within the dorsal part is a zone containing few projections from the contralateral eye, but which receives dense ipsilateral innervation (Figs. 1K; 5B). There is also a laminar appearance to some parts of the DLG with one such feature being a ventromedial retinorecipient sector that, in the coronal plane, is spatially separated from the rest of the DLG (Fig. 5B, asterisk).
Dorsomedial to the DLG, a modest terminal plexus is present in divisions of the rostral thalamic lateral posterior nucleus (LPMR; LPLR; Figs. 1J,K; 5A,B). Sparse innervation of the contralateral intramedullary area (IMA) is also observed (Fig. 1K).
The precise border between the MG and the caudal posterior limitans nucleus (PLi) of the pretectum is difficult to determine. The PLi extends far caudally and laterally along the lateral border of the APT (Figs. 1L,M) and scattered, retinal projections extend laterally into the adjacent suprageniculate nucleus (SG; Figs. 1M; 8A). Retinal projections to this region may also arrive via the more dorsally located, dorsal terminal nucleus (DT). A few retinal projections are also scattered along much of the medial border of the MG (Fig. 1M).
Visual Midbrain
Labeled retinal axons extend dorsomedially from the optic tract in the superficial brachium of the superior colliculus, terminating superficially in a small, dense plexus in the PHb. More caudally, the terminal field expands ventrally as a broader, loose plexus in the CPT (Figs. 1K,L; 5C). Projections are also found in the dorsal part of the anterior pretectal nucleus (APT; Fig. 1K) and in the PLi (Fig. 1K–M). These midbrain nuclei, along with the OPT (and to a lesser extent, the more dorsal posterior pretectal nucleus (PPT)), extend obliquely from rostromedial locations to caudolateral locations. Retinal innervation of the OPT has a single, roughly circular distribution rostrally, but gives way to dorsal and ventral divisions caudally (Figs. 1K–M; 5C). The nucleus of the optic tract (NOT; Figs. 1K,L; 5C), lying dorsal to the APT, is densely retinorecipient. Retinal projections also terminate densely in the dorsal PLi, but are sparser ventrally along the lateral APT border (Figs. 1K–M; 5C). The MPT and PPT of the dorsal midbrain are densely innervated by the retina (Figs. 1K,L; 5C).
In the mouse SC, the contralateral zonal (Zo), superficial gray (SuG) and optic (Op) layers are densely innervated, with modest innervation present in the intermediate gray (InG) layer (Figs. 1L–P; 7A–C). Ipsilaterally, there is generally sparse innervation of the Zo, Op and InG layers, but scattered loose patches of modestly dense retinal innervation are also evident, especially in the Op (Fig. 7A–C). Unexpectedly, large, fairly discrete patches of moderately dense to dense innervation are also present at one specific level of the InG (Fig. 7B). These are found in the ipsilateral InG, but not the contralateral side where the innervation is much more homogeneous. No projections were seen elsewhere in the SC.
Figure 7.

Darkfield photomicrographs showing retinal innervation in several layers of the mouse superior colliculus. (A–C) Images are from consecutively mounted tissue sections corresponding to the levels shown in Fig. 1M, mm and N (about 60 μm apart). “Patches” of terminals are evident in the ipsilateral mouse Op (A–C), but also in one level (B) of the ipsilateral InG. Bars = 200 μm.
There are sparse labeled retinal projections in the brachium of the inferior colliculus. These innervate the medial dorsal cortex of the inferior colliculus (DCIC; Figs. 1R,S; 2D). Retrogradely labeled cells are found in the oculomotor nucleus (Fig. 1N,O).
The dorsal raphe nucleus (DR), lateral parabrachial nucleus (LPB), mesencephalic reticular formation (MRF) and periaqueductal gray (PAG) of the mouse were examined for retinal projections and none were found.
Accessory Optic Nuclei
The contralateral DT is a moderately dense to dense superficial plexus dorsal to the caudal PLi and SG/MG (Figs. 1M,N; 8A; 9A1). Innervation is modest ipsilaterally. The lateral terminal nucleus (LT) is evident bilaterally at the level of the MGV where it abuts the dorsal pole of the cerebral peduncle. Although innervation is largely from the contralateral retina, the density is modest at best (Figs. 1M,mm,N; 8B1,8B2; 9A2). At the juncture with the mammillary complex, the medial terminal nucleus (MT) hooks dorsolaterally from its ventromedial location. It forms an elongated, dense terminal field medial to the substantia nigra reticulata (SNR) that extends dorsolaterally to the ventrolateral border of the medial lemniscus (Fig. 1M,mm; 8C; 9A6). There is also a small medial extension of the ventral MT which provides sparse fibers to the area between the MT proper and the paranigral nucleus (PN) medially (Figs. 1M,mm; 8C). Retinal innervation of the MT is very dense contralaterally and modestly dense ipsilaterally.
Figure 9.

Retinal projections with “chains” of terminal-like varicosities in the terminal zone of the superior fasciculus (tzSF) of the mouse accessory optic system. (A,B) Low magnification images showing the superior fasciculus at of two levels of the mouse brain. Image (A) corresponds to Fig. 1mm and image (B) corresponds to Fig. 1M. The circles in (A) and (B) identify the location of the images (A1–A5) and (B1–B4), respectively. (A2) illustrates terminals in the LT of image (A) at the same level as Figs. 1mm and 7B2. (A6) shows the dorsal MT in image (A). In images (A1–5; B1–4), arrowheads point at chains of terminal varicosities. In images (A1, A2, B1), arrows indicate loosely scattered fibers and terminals. The pointers in (A3,A4) are directed at identical locations in the two images, but in one (A3), the external part of the terminal zone is in the focal plane, whereas in the other (A4), the internal part is in focus. (A,B) Bars = 500 μm. (B1) Bar = 20 μm and applies to images (A1–A6; B1–B4).
The superior fasciculus of the accessory optic system extends along the surface of the cerebral peduncle, between the lateral and medial terminal nuclei (Fig. 1mm,N; Fig. 9A,B). Close examination of this structure reveals the retinal projections as bundles of fibers that are not ordinarily parallel to the brain surface. Rather, they are commonly seen below the surface, angling within a terminal zone 10–15 μm deep (e.g., Fig. 9A1,A3–A5, 9B1–B4). Within this terminal zone of the superior fasciculus (tzSF), the bundles are generally covered with “chains” of terminal-like, large varicosities which are evident along the entire length of the superior fasciculus. Such chains of terminals are not seen in the LT (Fig. 9A2). A small, dense set of terminal chains occupies a similar terminal zone above or in the dorsal DT (Fig. 9A1).
DISCUSSION
The present data show the retinorecipient regions of a standard laboratory mouse to be very similar to those described for the diurnal Nile grass rat, Arvicanthis niloticus (Gaillard et al., 2013). To date, the most comprehensive studies of retinal projections in the laboratory mouse have focused on brain regions receiving input from melanopsin-containing ipRGCs (Hattar et al., 2006; Ecker et al., 2010). The present study describes the projections from all ganglion cells to approximately 46 retinorecipient areas in the mouse brain. As shown in Table 1, about 30% of these do not appear to receive input from ipRGCs. Table 1 also provides a comparison of the present mouse results with previous data from the hamster, grass rat and rat (Pickard and Silverman, 1981; Morin and Blanchard, 1997; 1999; Horowitz et al., 2004; Gaillard et al., 2013).
Technical issues
The tracer, cholera toxin β subunit (CTB), has been widely used to demonstrate retinorecipient brain regions (Mikkelsen, 1992; Morin and Blanchard, 1997; Nakagawa et al., 1998; Morin and Blanchard, 1999; Major et al., 2003; Matteau et al., 2003; Muscat et al., 2003; Gaillard et al., 2013). For unknown reasons, immunohistochemistry with DAB as the chromogen, the method employed here, is more sensitive than one which relies on intravitreal injection of CTB conjugated to a fluorescent label (Muscat et al., 2003; Gaillard et al., 2013). The present results using the CTB tracing method suggest that there is reduced labeling of fibers and terminals in the mouse brain, compared to that of the hamster, in virtually all areas evaluated (Morin and Blanchard, 1997; 1999). The reason for this is unknown, but could be the result of a smaller number of cells taking up and transporting the label or to unknown factors relating to reduced transport efficiency.
The present study counted 46 mouse brain regions receiving retinal projections (Table 1). The actual number depends upon the specific definitions of the regions and the willingness of investigators to “lump” or “split” regions. In addition, there are interpretational decisions such as whether the observed sparse projections in the dorsal MG are in the SG or a caudal extension of the PLi (discussed further below). There have also been changes in nomenclature which influence the count of retinorecipient regions. Pertinent to the present analysis, several sectors of the hypothalamus have been re-drawn and re-named. For example, the former anteroventral preoptic area (Paxinos and Watson, 1986) occupies an area overlapping the more recently delineated ventral MPA and VLPO in both the mouse and more recent rat atlases (Paxinos and Watson, 1998; Paxinos and Franklin, 2004).
Similarly, certain adjacent brain regions that are differentially identified atlases (Morin and Wood, 2001; Paxinos and Franklin, 2004) may be difficult to distinguish in the actual histology. Two such locations are the SubG and PP which are situated in a context that includes closely adjacent IGL, VLG and LT, all of which are retinorecipient. Analysis and discussion of these areas is also hindered by the fact that there is significant disagreement regarding the identity of the mouse PP and LT (discussed below).
Issues such as the foregoing are likely to account for many of the between-species differences in the number of counted retinorecipient regions. Nevertheless, the present mouse results show 46 such regions; the hamster has between 31 (Ling et al., 1998) and 57 (Morin and Blanchard, unpub. data; Morin and Blanchard, 1997, 1999; Horowitz et al., 2004), while the grass rat has 45 (Gaillard et al., 2013). Less information is available for rat (Table 1) because there has not yet been a single comprehensive study of retinal projections in this species..
Projections to basal forebrain, rostral hypothalamus and bed nucleus of the stria terminalis
Retinal projections to the olfactory tubercle have been observed in numerous species, including rat and hamster (Cooper et al., 1989; Levine et al., 1991; Morin and Blanchard, 1999), but not the mouse (present data). Innervation of the mouse basal forebrain is limited to sparse fibers extending laterally from the optic chiasm into the AAV, MeA, MePV, HDB and SI. The extent of this projection appears to be somewhat greater than in the grass rat (Gaillard et al., 2013) and is approximately equal to that seen in the hamster. In the latter species, however, the sparse projections are more widely distributed and also extend to the nucleus of the lateral olfactory tract, piriform cortex and perirhinal cortex, but are not present in the SI (Pickard and Silverman, 1981; Ling et al., 1998; Morin and Blanchard, 1999).
In the rostral hypothalamus, direct retinal projections to the ventrolateral preoptic hypothalamus have been described in mouse, rat, hamster and grass rat (Johnson et al., 1988; Lu et al., 1999; Morin and Blanchard, 1999; Hattar et al., 2006; Gaillard et al., 2013). The present data affirm the presence of direct retinal projections to the mouse VLPO, but they are very sparse, supporting the possibility that they originate exclusively from the few ipRGCs that also project to the VLPO.
Very dense retinohypothalamic tract input to the mouse SCN appears to innervate the entire nucleus (Hattar et al., 2006; Morin et al., 2006), as has been described for the hamster (Johnson et al., 1988; Morin and Blanchard, 1999). Innervation of the rat SCN appears to differ from mouse and hamster to the extent that the density of innervation is much greater in the central and ventrolateral parts (Johnson et al. (1988); Moore et al., 2002). The grass rat, which has a vertically elongated SCN similar in profile to that of the mouse and hamster, has a retinal innervation pattern more like that of the rat, with a very dense ventral plexus below a dorsal region of modest innervation (Gaillard et al., 2013). Adjacent AH and sPa receive fairly broad retinal projections in all species studied (present data; (Johnson et al. (1988); Goel et al. (1999); Morin and Blanchard (1999); Smale and Boverhof (1999); Abrahamson and Moore (2001); Major et al. (2003); Hattar et al. (2006); Canteras et al. (2011); Gaillard et al. (2013))).
The dorsal posterior bed nucleus of the stria terminalis receives retinal projections, but the exact subdivision is ambiguous and may be species-specific. In all species examined, the region of innervation is small and positioned caudal to the level of the anterior commissure, but rostral to the level of the reticular thalamic nucleus (as in Fig. 33 in Paxinos and Franklin, 2004, and Fig. 21 in Morin and Wood, 2001). The zone of innervation has variously been identified as the anterodorsal thalamic nucleus (Johnson et al., 1988), the “encapsulated” part of the bed nucleus of the stria terminalis (Cooper et al., 1994) or BSTPM (Morin and Blanchard, 1999; Gaillard et al., 2013). The latter terminology, as applied to the mouse, is consistent with the identity and description provided by Gaillard et al. for the grass rat and referred to as the “bed nucleus of the stria terminalis, medial, posteromedial division,” in the Paxinos and Franklin (2004) atlas. Gaillard et al. (2013) describe retinal projections as lying within the “BNST/AV transition zone,” with a trajectory that provides innervation to the BSTPM ventral to the AD. This view is consistent with the present mouse and hamster (Morin and Blanchard, 1999) data, although the hamster has a few projections evident in the BSTPL, as well. The projections to the bed nucleus of the stria terminalis arrive through a slender pathway extending rostrally from the optic tract at the level of the more caudal lateral geniculate complex (Morin and Blanchard, 1999).
With respect to function, the RHT provides photic information to the SCN for phase control of rhythmicity generated by the circadian clock (Johnson et al., 1988). In addition, it is likely that the photic information arriving in the SCN, or an immediately adjacent area, acts to suppress nocturnal locomotion, lower body temperature and simultaneously induce sleep (Li et al., 2005; Morin, 2013b; Studholme et al., 2013). Light could act via the direct retina to VLPO projection to activate sleep circuits (Saper et al., 2010). However, the paucity of terminals in the mouse VLPO (present data; (Hattar et al., 2006)) provokes the question of how such little direct retinal input might adequately control light-induced sleep or thermoregulatory responses (Altimus et al., 2008; Studholme et al., 2013).
Alternatively, the effect of light on the VLPO might be largely indirect, arriving from second or third order sources. Second order sources include modest projections from the retinorecipient nuclei, sPa and SCN (Novak and Nunez, 2000; Chou et al., 2002). Third order sources include substantial projections originating in nuclei receiving robust input from the SCN. These potential relay nuclei include the MPA, dorsomedial hypothalamic nucleus, RCH, sPa and perifornical posterior hypothalamus (Deurveilher et al., 2002; Deurveilher and Semba, 2003; 2005). Any of these could act as relay stations for transmission of photic information modulating sleep (Altimus et al., 2008; Lupi et al., 2008; Morin and Studholme, 2009; Saper et al., 2010; Studholme et al., 2013). Projections to lateral hypothalamic orexin neurons from a number of retinorecipient regions, including the HDB, BSTPM, SCN, AH, LA, LPO, Pa, sPa, VLPO also offer the possibility of indirect photic input to the sleep regulatory system (Abrahamson et al., 2001; Sakurai et al., 2005; Ohno and Sakurai, 2008). Cells in the main and accessory olfactory bulb project to several portions of the hamster basal forebrain and hypothalamus that also receive retinal projections (Cooper et al., 1994). These include the Tu, Pir, MeA, LH and posterior BNST which are also targets of IGL; the medial amygdala and posterior BNST are innervated by the SCN, as well (Morin and Blanchard, 1999). The function of such converging pathways is not known, although the suggestion has been made that they modulate gonadotropin levels and light-mediated aspects of reproduction (Cooper et al., 1994). Lesions of the posterior BNST complex in hamsters block gonadal regression induced by exposure to short photoperiod (Raitiere et al., 1995), as does olfactory bulb ablation (Pieper et al., 1984; Clancy et al., 1986). The BNST has also been implicated in the regulation of light-enhanced acoustic startle in rats (Walker and Davis, 1997) (see discussion of visual/auditory system relationships below).
Projections to para-habenular region and visual thalamus
The elongated PHb terminal region encompasses several nuclei, including the dorsal AD and CL, as well as zones along the borders of the stria medullaris, habenular commissure and lateral habenula. Retinal projections to the PHb are moderately robust in both hamster and mouse (present data; (Hattar et al., 2006)), but are not noteworthy in the grass rat. The immediately adjacent LHb receives sparse retinal innervation in this species (Gaillard et al., 2013).
The function of the retinal projection to the PHb is unclear, although it might regulate some facet of circadian rhythmicity or reproductive seasonality. Basal forebrain cells synthesizing gonadotropin releasing hormone project to the SCN and to the habenula (Morin, 2013a) and habenular neurons contain reproductively modulated estradiol receptors (Wagner et al., 1998). Lesions of the major habenular output pathway lengthen the hamster circadian period and alter the pattern of locomotion (Paul et al., 2011). LHb neurons exhibit autonomous circadian clock-like activity with respect to both gene expression and neurophysiological activity (Zhao and Rusak, 2005; Guilding et al., 2010). A high percentage of habenular neurons also respond to light stimuli (Zhao and Rusak, 2005) and conceivably require photic input for entrainment of their native oscillatory activity.
The retinal innervation of the mouse DLG and VLG described here is consistent with previous results (Jaubert-Miazza et al., 2005; Hattar et al., 2006; Ecker et al., 2010) and with numerous reports from several other species, including the rat, hamster and grass rat (Sefton and Dreher, 1995; Muscat et al., 2003; Fleming et al., 2006; Gaillard et al., 2013). Lateral geniculate organization of ground squirrels is considerably more complex because of the clearly laminar terminal field structure (Agarwala et al., 1989; Major et al., 2003).
An “unknown” retinorecipient part of dorsolateral thalamus has been described in the grass rat as a thin lamination extending rostrally from the medial DLG. A spatially distinct ventromedial part of the DLG observed here in the mouse may be a homologous structure with its appearance dependent on the exact plane and orientation of the histological sections used for evaluation. Horizontal sections through the hamster brain (Morin and Blanchard, unpubl. data) suggest that the “unknown” grass rat structure may be a ventral extension from the medial DLG. The fact that such segregated retinorecipient thalamic regions are observed in mouse, hamster and grass rat brains invokes the possibility that each may have a specialized, but unknown, function.
Function of the LP as a visual nucleus is not well understood, but its positioning and connections support the view that it is a higher order nucleus for cortico-cortical communication (Sherman and Guillery, 1996). Some neurons in the LP respond to both visual and somatosensory input (Mooney et al., 1984) and it receives projections from the MPT, OPT and PPT (Morin and Blanchard, 1998), as well as the documented direct retinal projections.
One unusual influence of light is its exacerbating effect on migraine headache. A putative pathway by which this can occur is through a direct retinal projection from ipRGCs to posterior thalamic nuclei, including the LP (Noseda et al., 2010). Cells in the LP are sensitive to both photic input and stimulation of the dura. In addition, projections from the HDB, a retinorecipient site (present data), to the posterior thalamic circuitry might also contribute to the light-exacerbated migraine response (Noseda and Burstein, 2011; Kagan et al., 2013). A common characteristic of migraine is photophobia (or its converse, dark preference). The visual input pathway for this response is not known, although it appears to be mediated by classical photoreceptors, rather than ipRGCs (Morin and Studholme, 2011) and could be related to the effects of light on migraine.
Retinal innervation of the mouse IGL has been described (Hattar et al., 2006) and is substantially similar to that of hamster (Muscat et al., 2003). In particular, the nucleus is quite long, originating slightly rostral, and extending caudal, to the DLG (Botchkina and Morin, 1995). Identity of the IGL has been determined from the location of projections from the entire population of retinal ganglion cells, from ipRGCs, of the location of neurons afferent to the SCN, and the location of neuropeptide Y (NPY) - or enkephalin (ENK) - IR neurons in the lateral geniculate region (Morin et al., 1992; Morin and Blanchard, 1997; 1999; 2001; Hattar et al., 2006). Other investigators do not consider the rostral, NPY-IR neuron-bearing region to be part of the IGL (Moore and Card, 1994), nor is it recognized in the Paxinos and Watson (2004) atlas. Nevertheless, additional anatomical criteria related to the migration of glia and NPY-IR neurons to the IGL during development support the broader definition (Botchkina and Morin, 1995; Delaunay et al., 2009).
Functions of the DLG, IGL and VLG have been discussed at length. The role of the DLG in higher order vision is well established (Sherman and Guillery, 1996; Rodieck, 1998). A clear functional distinction between VLG and IGL has been difficult to establish because of their proximity and interconnectivity (Morin, 1994; Harrington, 1997; Morin and Blanchard, 1998; Morin and Allen, 2006). Function of the IGL has been pursued largely in the context of circadian rhythm regulation by a projection, via the geniculohypothalamic tract, to the SCN (Morin, 2013a). However, many IGL cells do not project to the SCN, but send axons to other retinorecipient nuclei of the visual midbrain (Morin and Blanchard, 1998; 2001). IGL activity would, therefore, indirectly influence function of these locations, such as the OPT which receives innervation from NPY or ENK cells located in the IGL. In addition, the anatomical evidence from IGL efferent and afferent projections suggests a role for this nucleus in the regulation of eye movements during sleep (Morin and Blanchard, 2005; Morin, 2013a).
The use of retinal projections alone for identification of the IGL is difficult, in part, because of the contiguity of the retinorecipient LT, PP, SubG and caudal VLG. The SubG is easily recognized and retinorecipient in mouse, hamster and grass rat (present data; Gaillard et al., 2013; Morin and Blanchard, 1999). The small, densely retinorecipient PP is evident at the dorsal pole of the cerebral peduncle ventral to the SubG. A medially adjacent visual sector of the lateral rat ZIV has also been reported in the mouse, rat, grass rat and hamster (present data; (Morin and Blanchard, 1999; Power et al., 2001; Hattar et al., 2006; Gaillard et al., 2013).
A difficult to define, retinorecipient zone is evident in the dorsal MG. The retinal projections to this locale may represent a caudolateral extension of fibers arriving from the PLi which is positioned along the lateral border of the APT. It is also possible that the dorsal MG or SG receive retinal projections extending ventrally through the DT. In addition, fibers may arrive from the ventrally located MT and terminate in or along the medial border of the MG and SG. Well-defined labeled fibers are found between the SG and MT in the grass rat (Gaillard et al., 2013).
Posterior limitans nucleus and pretectum
Retinal input to the pretectal region has been previously described in detail for the rat, hamster and grass rat (Scalia and Arango, 1979; Morin and Blanchard, 1997; Gaillard et al., 2013). There are two major differences between the more recent studies and those of Scalia. The first, as described below, has been reconsideration of NOT identity relative to PLi. The second is the addition of a relatively large area dorsolateral to the posterior commissure as a pretectal nucleus, the CPT. Retinal projections to the CPT have now been described in hamster, grass rat and mouse (present data and (Morin and Blanchard, 1997; Gaillard et al., 2013)). The function of retinal projections to most pretectal regions, including the CPT, is not understood, although one principle of pretectal organization may relate to the fact that many cells in several nuclei are multimodal with respect to their activation by sensory stimuli (see (Morin and Blanchard, 1998) for discussion of the function of each nucleus).
The OPT is the best understood of the pretectal nuclei with respect to function and its role as a mediator of the pupillary light reflex is well documented. This response is controlled jointly by ipRGC and classical photoreceptor inputs which arrive in distinctly different parts of the OPT (Guler et al., 2008; Hatori et al., 2008; Ecker et al., 2010; Allen et al., 2011; Chen et al., 2011; Gooley et al., 2012). In addition, the OPT has reciprocal connections with the interconnected IGL and VLG (Morin and Blanchard, 1998), suggesting that each nucleus influences function of the others.
The PLi has received little attention and appears to have been overlooked in favor of, and/or confused with, the adjacent NOT (see Morin and Blanchard, 1997, for references and discussion about function). Identification of IGL efferent projections together with immunohistochemistry for NPY or ENK provide a complex picture of a retinorecipient PLi in the hamster that differs from the NOT. In addition to its lateral efferent and afferent connections with the IGL, the PLi is intimately connected with the PHb, rostromedially (Morin and Blanchard, 1995; 1997; 1998; 1999). The continuity of the anatomical features (retinorecipiency, NPY/ENK-IR and connectivity patterns) provided the original rationale for accepting a liberal definition of the PLi which included the PHb described as ‘rostral PLi’ (Morin and Blanchard, 1997). Given the length of the long, narrow retinorecipient PHb, the number of contiguous nuclei along its length, and the need to minimize confusion with the remainder of the PLi, ‘PHb’ is here preferred to ‘rostral PLi.’ This designation is also consistent with previous descriptions of retinal projections to the same region (Hattar et al., 2006).
The mouse PLi is similar to that in the hamster. It has a “head” region dorsolateral to the APT which receives relatively dense retinal innervation and there is a less well innervated “tail” extending ventrally along the lateral APT border. Scattered retinal projections are present directly below the caudal DT in a narrow, vertically oriented region along the border of the MG. Whether this zone is within the MG, is a separate nucleus or is caudal PLi remains to be determined. Regardless, one interpretation is that features of the PLi are evident in the MG and SG, as has suggested for the grass rat (Gaillard et al., 2013).
Superior colliculus
The structure and function of the SC has been extensively investigated, especially with respect to the multimodal sensory responses necessary for orientation and localization (Stein and Merideth, 1991; May, 2006; Stein and Rowland, 2011; Krauzlis et al., 2013). In general, the observations in the present studies match those obtained from several other rodent species (Frost et al., 1979; Vercelli et al., 2000; Gaillard et al., 2013). Most notably, the contralateral projections to the Zo, SuG and Op layers are very dense. The mouse results reveal a moderately dense projection to the contralateral InG greater than has been commonly reported, but comparable to that for the hamster (Table 1; Morin and Blanchard, unpub. data) and grass rat (Gaillard et al., 2013), probably because studies of those species also employed CTB, the most sensitive tracer available.
The present data affirm the presence of fairly discrete superficial areas in the Op layer of the ipsilateral SC that receive sparse to dense retinal projections (Upton et al., 1999). The concept of “patchy” terminal fields in the ipsilateral SC has received significant attention (Chalupa and Rhoades, 1979; Wiener, 1986; Chevalier and Mana, 2000; Fleming et al., 2006) with most of the discussion focused on the Op (Chalupa and Rhoades, 1979; Frost et al., 1979; Upton et al., 1999; Lyckman et al., 2005). Such patches are greatly diminished in the albino compared to the pigmented rat (Fleming et al., 2006). Here, we provide evidence that patches are also distributed within the mouse InG layer, a feature previously documented in the Japanese vole (Uchiumi et al., 1995). However, such patches are quite limited to the extent that they are present only in one or two adjacent histological sections through the mid-level SC and are not seen caudal or rostral to this location. Similar patches are not seen in the hamster InG layer (Morin and Blanchard, unpub. data).
Dorsal raphe, parabrachial nucleus and inferior colliculus
The dorsal raphe nucleus has been well investigate with respect retinal innervation and retinal ganglion cell projections to the DR have been demonstrated in rat (nocturnal), gerbil (diurnal) and cat (nocturnal or diurnal) (Foote et al., 1978; Shen and Semba, 1994; Fite et al., 1999; Ren et al., 2013). However, none are evident in mouse (present data; nocturnal) or hamster (Morin and Blanchard, unpub. data; nocturnal) brains, or in brains of gray squirrel (diurnal) and grass rat (nocturnal or diurnal capability) (Major et al., 2003; Gaillard et al., 2013).
Retinal projections have also been observed in the lateral parabrachial nucleus in rat, gerbil and Octodon degus (Fite and Janusonis, 2002). Such projections have not seen in either mouse (present data) or hamster (Morin and Blanchard, unpub. data) brains.
The retinal projections to the DCIC are sparse in both the mouse (present results) and hamster (Morin and Blanchard, unpub. data). Similar projections have been previously noted in rat and monkey inferior colliculus (Itaya and Vanhoesen, 1982), although they may retract during development in pigmented rats (Cooper and Cowey, 1990). In mouse, the density of retinal projections to the inferior colliculus has been reported as moderate early post-natally, diminishing to sparse in adulthood (Godement et al., 1984).
Relationship of retinal projections to the auditory system
There is an intimate relationship between visual and auditory systems, as indicated by the convergence of direct retinal projections onto major auditory components, including the inferior colliculus and SG, both of which project to the primary auditory cortex (Budinger et al., 2000; Budinger and Scheich, 2009). A reciprocal projection from auditory cortex overlaps the retinorecipient zone in the DCIC (Budinger et al., 2000). Similarly, projections from auditory cortex are evident in retinorecipient nuclei of the thalamus (LP, DLG, PP, SubG and ZI); and of the midbrain (SC and PLi) (Budinger et al., 2000); see Budinger and Scheich (2009) for a review). One important locus of this relationship occurs in multimodal cells of the pretectum and tectum (e.g., PLi and InG; (Lee and Winer, 2008; Stein and Rowland, 2011)).
Terminal nuclei
The terminal nuclei of the accessory optic system are heavily interconnected and demonstrate functions related to eye and head movements (see Giolli et al. (2006) for a review). In addition, the several accessory optic nuclei appear to function in a coordinate organizational system similar to that of the extraocular muscles and vestibular semicircular canals (Simpson et al., 1988; Soodak and Simpson, 1988; Tan et al., 1993). Gaillard et al. (2013), consistent with the terminology of Giolli et al. (2006), have distinguished ventral and dorsal divisions of the grass rat MT. These divisions also exhibit functional differences (Yonehara et al., 2009). The basic MT description is similar across a variety of small rodents including the mouse, hamster, rat and ground squirrel (present data; (Pickard and Silverman, 1981; Ribak et al., 1997; Major et al., 2003; Horowitz et al., 2004; Giolli et al., 2006)). In each species, there is a short, dense medial extension of the ventral MT division (present data; (Bai et al., 2001; Major et al., 2003; Horowitz et al., 2004)). In mouse (present results) and hamster (Morin and Blanchard, unpub. data), this appears to give rise to a previously undescribed bilateral set of sparse, longer fibers that terminate dorsomedially in the PN. The hamster (Morin and Blanchard, unpub. data) also has sparse fibers extending across the substantia nigra between the cerebral peduncle and the dorsal MT, as reported for the grass rat (Gaillard et al., 2013).
Gaillard et al. (2013) suggest that fibers also arrive in the dorsal MT from a fascicle that extends ventrally, possibly from the NOT, through the SG area and along the medial border of the MG. In the mouse, retinal projections are present in a similar region (see the above PLi discussion), but they do not appear to extend ventrally it into the MT. Many more labeled fibers are found in the region of the hamster SG (Morin and Blanchard, unpub. data) than are evident in the mouse, as well as more medially in the deep mesencephalic nucleus, a characteristic more consistent with the grass rat pattern (Gaillard et al., 2013). Labeled fibers are also found dorsolateral to the hamster MT, dorsal part, and may arrive from a more dorsal location. However, it is impossible to exclude arrival from a more ventral source, such as has been reported during development of the rat accessory visual system (Bai et al., 2001).
The hamster MT is more complex than most other species. Its dorsal division is an elongated, bifurcated terminal field extending dorsomedially to the ventral tegmental area and dorsolaterally into the pararubral area to which it provides numerous scattered projections (Pickard and Silverman, 1981; Ling et al., 1998; Horowitz et al., 2004). This pattern is unlike the simpler version evident in other species, including that shown here for the mouse, although hamster-like MT complexity may be present during development in the rat (Bai et al., 2001). The functional and species-specific implications of this organizational difference are unknown.
The LT has an identity problem to the extent that its existence in the mouse has been questioned (Uchiumi et al., 1995; Dhande et al., 2013). In the hamster, the LT is clearly evident as a small, dense terminal field located at the dorsal pole of the cerebral peduncle, but below the MG, as illustrated in the hamster atlas (Morin and Blanchard, 1997; Morin and Wood, 2001). This small, roughly triangular plexus is continuous with a similar, densely innervated area that is more rostral and evident at the dorsal pole of the cerebral peduncle, at the level of the ZIV and SubG. The area of dense innervation, here labeled as PP, appears distinct from the more scattered retinal terminal field in the SubG. This designation differs from the ‘LT’ as indicated in the Paxinos and Franklin (2004) mouse atlas. The mouse LT location is similar to that reported for other small rodents, above the cerebral peduncle at the level of the caudal MG, almost directly ventral to the DT (Pickard and Silverman, 1981; Cooper et al., 1993; Ling et al., 1998; Bai et al., 2001; Major et al., 2003; Horowitz et al., 2004; Gaillard et al., 2013), a location labeled ‘PP’ in the Paxinos and Franklin atlas. In the mouse, unlike the hamster, the rostral PP is not continuous with the more caudal LT, there being two distinct retinorecipient zones separated by a 30–60 μm break (between Figs. 1L and 1M). In addition, the mouse LT terminal field is relatively sparse and much less dense than that of the hamster (Morin and Blanchard, unpub. data).
It should also be noted that the LT in the rat has also been identified as an elongated superficial bulge of the superior fasciculus of the accessory optic tract caudal to the MG (Figure 1 in Giolli et al. (2006)). The lack of clarity regarding this nucleus is further emphasized by the interpretation that the mouse LT actually consists of anterior and posterior groups embedded in the anterior division of the superior fasciculus of the accessory optic system (Pak et al., 1987).
In the present studies, abundant chains of terminal-like varicosities are evident within a narrow terminal zone extending the length of the superior fasciculus (tzSF). To our knowledge, this has not been previously reported, although it may simply be an extension of the above suggestion that the LT is actually a discrete terminal zone within the superior fasciculus (Pak et al., 1987; Giolli et al., 2006). The present results indicate that the tzSF does not have the structure of a typical brain nucleus and suggests the possibility of a larger, integrative role for the superior fasciculus in addition to its simpler function as a fiber tract. A section of the tzSF, known as the interstitial nucleus of the superior fasciculus, posterior (inSFp), has previously been identified as, and considered to be, one of the terminal nuclei, along with the classic DT, LT and MT (Giolli et al., 1984; Ribak et al., 1997). Retinal projections and scattered terminals are present in a slightly bulging part of the mouse superior fasciculus and may correspond to the inSFp. In the hamster, however, a region corresponding to the bulge in the mouse superior fasciculus is not evident, despite there being an obvious tzSF (Morin and Blanchard, unpub. data). Therefore, it may be preferable to refer to the entire superior fasciculus, rather than just one subsection, as the fourth terminal nucleus.
Acknowledgments
Supported by: NINDS grant NS061804 to LPM. We thank Pablo Vivanco for his technical assistance.
Anatomical Abbreviations
- 3
oculomotor n.
- 3Cb
cerebellar lobule 3
- 3V
third ventricle
- AAV
anterior amygdaloid area, ventral
- ac
anterior commissure
- ACo
anterior cortical amygdaloid n.
- AD
anterodorsal thalamic n.
- AH
anterior hypothalamic area
- AM
anteromedial thalamic n.
- APT
anterior pretectal n.
- Aq
cerebral aqueduct
- Arc
arcuate n.
- AV
anteroventral thalamic n.
- bic
brachium of the inferior colliculus
- BIC
n. brachium of the inferior colliculus
- bsc
brachium of the superior colliculus
- BSTPI
bed n. stria terminalis, posterointermediate
- BSTPL
bed n. stria terminalis, posterolateral
- BSTPM
bed n. stria terminalis, posteromedial
- cic
commissure of the inferior colliculus
- CIC
central n. inferior colliculus
- CL
centrolateral thalamic n.
- CLi
caudal linear raphe n.
- CM
central medial thalamic n.
- cp
cerebral peduncle
- CPT
commissural pretectal n.
- csc
commissure of the superior colliculus
- DA
dorsal hypothalamic area
- DCIC
dorsal cortex of the inferior colliculus
- DLG
dorsolateral geniculate n.
- DM
dorsomedial hypothalamic n.
- DpG
deep gray layer, superior colliculus
- DpMe
deep mesencephalic n.
- DpWh
deep white layer, superior colliculus
- DR
dorsal raphe n.
- DT
dorsal terminal n.
- ECIC
external cortex of the inferior colliculus
- eml
external medullary lamina
- f
fornix
- fr
fasciculus retroflexus
- hbc
habenular commissure
- HDB
n. diagonal band, horizontal limb
- IAD
interanterodorsal thalamic n.
- ic
internal capsule
- IF
interfascicular n.
- IGL
intergeniculate leaflet
- IMA
intramedullary thalamic n.
- InG
intermediate gray layer, superior colliculus
- InWh
intermediate white layer, superior colliculus
- IP
interpeduncular n.
- IPF
interpeduncular fossa
- LA
lateroanterior hypothalamic n.
- LD
laterodorsal thalamic n.
- LH
lateral hypothalamic n.
- LHb
lateral habenula
- LM
lateral mammillary n.
- LOT
n. lateral olfactory tract
- LP
lateral posterior thalamic n.
- LPB
lateral parabrachial n.
- LPMR
lateral posterior thalamic n., mediorostral
- LPLR
lateral posterior thalamic n., laterorostral
- LPO
lateral preoptic area
- LT
lateral terminal n.
- MD
mediodorsal thalamic n.
- MeA
medial amygdala, anterior
- MeAD
medial amygdala, anterodorsal
- MeAV
medial amygdala, anteroventral
- MePD
medial amygdala, posterodorsal
- MePV
medial amygdala, posteroventral
- MG
medial geniculate n.
- MGD
medial geniculate n., dorsal
- MGM
medial geniculate n., medial
- MGP
medial globus pallidus
- MGV
medial geniculate n., ventral
- MHb
medial habenula
- ml
medial lemniscus
- mlf
medial longitudinal fasciculus
- MM
medial mammillary n., medial
- MPA
medial preoptic area
- MPO
medial preoptic n.
- MPOM
medial preoptic n., medial
- MPT
medial pretectal n.
- MRe
mammillary recess
- MRF
mesencephalic reticular formation
- mt
mammillothalamic tract
- MT
medial terminal n.
- MTu
medial tuberal n.
- NOT
nucleus of the optic tract
- Op
optic layer, superior colliculus
- OPT
olivary pretectal n.
- ot
optic tract
- ox
optic chiasm
- Pa
paraventricular hypothalamic n.
- PAG
periaqueductal gray
- PaPo
paraventricular hypothalamic n., posterior
- PaR
pararubral n.
- PBG
parabigeminal n.
- PBP
parabrachial pigmented n.
- pc
posterior commissure
- Pe
periventricular hypothalamic n.
- PH
posterior hypothalamic n.
- PHb
para-habenular zone
- Pir
piriform cortex
- PLi
posterior limitans n.
- pm
principle mammillary tract.
- PMV
premammillary n., ventral
- PN
paranigral n.
- PP
peripeduncular n.
- PPT
posterior pretectal n.
- PR
prerubral field
- PRh
perirhinal cortex
- pSON
peri-supraoptic n.
- PVA
paraventricular thalamus, anterior
- PVP
paraventricular thalamic n., posterior
- RCh
retrochiasmatic area
- Re
n. reuniens
- RLi
rostral linear raphe n.
- RMC
red n., magnocellular
- RPC
red n., parvocellular
- RRF
retrorubral field
- Rt
reticular thalamic n.
- SC
superior colliculus
- SCN
suprachiasmatic n.
- SG
suprageniculate n.
- SI
substantia innominata
- sm
stria medullaris
- SNC
substantia nigra, compacta
- SNR
substantia nigra, reticulata
- SON
supraoptic n.
- sox
supraoptic commissures
- sPa
subparaventricular zone
- st
stria terminalis
- STh
subthalamic n.
- SubG
subgeniculate n.
- SubI
subincertal n.
- SuG
superficial gray, superior colliculus
- SuMM
supramammillary n., medial
- Tu
olfactory tubercle
- tzSF
terminal zone of the superior fasciculus
- VA
ventral anterior thalamic n
- VLG
ventrolateral geniculate n.
- VLPO
ventrolateral preoptic area
- VM
ventromedial thalamic n.
- VMH
ventromedial hypothalamic n.
- VPL
ventral posterolateral thalamic n.
- ZID
zona incerta, dorsal
- ZIV
zona incerta, ventral
- Zo
zonal layer, superior colliculus
Footnotes
Conflict of Interest Statement
None of the authors has any known or potential conflict of interest including any financial, personal, or other relationships with other people or organizations within 3 years of beginning the study submitted that could inappropriately influence, or be perceived to influence, their work.
Role of the Authors
All authors had full access to all the data in the study and take responsibility for the integrity of the data and the accuracy of the data analysis. Study concept and design: LPM. Acquisition of data: LPM. Analysis and interpretation of data: LPM and KMS. Drafting of the manuscript: LPM. Critical revision of the manuscript for important intellectual content: LPM and KMS.
References
- Allen AE, Brown TM, Lucas RJ. A distinct contribution of short-wavelength-sensitive cones to light-evoked activity in the mouse pretectal olivary nucleus. J Neurosci. 2011;31(46):16833–16843. doi: 10.1523/JNEUROSCI.2505-11.2011. [DOI] [PMC free article] [PubMed] [Google Scholar]
- Berson DM, Dunn FA, Takao M. Phototransduction by retinal ganglion cells that set the circadian clock. Science. 2002;295(5557):1070–1073. doi: 10.1126/science.1067262. [DOI] [PubMed] [Google Scholar]
- Budinger E, Heil P, Scheich H. Functional organization of auditory cortex in the Mongolian gerbil (Meriones unguiculatus). IV. Connections with anatomically characterized subcortical structures. Eur J Neurosci. 2000;12(7):2452–2474. doi: 10.1046/j.1460-9568.2000.00143.x. [DOI] [PubMed] [Google Scholar]
- Budinger E, Scheich H. Anatomical connections suitable for the direct processing of neuronal information of different modalities via the rodent primary auditory cortex. Hear Res. 2009;258(1–2):16–27. doi: 10.1016/j.heares.2009.04.021. [DOI] [PubMed] [Google Scholar]
- Chen SK, Badea TC, Hattar S. Photoentrainment and pupillary light reflex are mediated by distinct populations of ipRGCs. Nature. 2011;476(7358):92. doi: 10.1038/nature10206. [DOI] [PMC free article] [PubMed] [Google Scholar]
- Clancy AN, Goldman BD, Bartke A, Macrides F. Reproductive effects of olfactory bulbectomy in the syrian-hamster. Biol Reprod. 1986;35(5):1202–1209. doi: 10.1095/biolreprod35.5.1202. [DOI] [PubMed] [Google Scholar]
- Cooper AM, Cowey A. Development and retraction of a crossed retinal projection to the inferior colliculus in neonatal pigmented rats. Neuroscience. 1990;35(2):335–344. doi: 10.1016/0306-4522(90)90087-k. [DOI] [PubMed] [Google Scholar]
- Cooper HM, Herbin M, Nevo E. Visual system of a naturally microphthalmic mammal: The blind mole rat, Spalax ehrenbergi. J Comp Neurol. 1993;328:313–350. doi: 10.1002/cne.903280302. [DOI] [PubMed] [Google Scholar]
- Cooper HM, Parvopassu F, Herbin M, Magnin M. Neuroanatomical pathways linking vision and olfaction in mammals. Psychoneuroendocrinology. 1994;19:623–639. doi: 10.1016/0306-4530(94)90046-9. [DOI] [PubMed] [Google Scholar]
- Dacey DM, Liao HW, Peterson BB, Robinson FR, Smith VC, Pokorny J, Yau KW, Gamlin PD. Melanopsin-expressing ganglion cells in primate retina signal colour and irradiance and project to the LGN. Nature. 2005;433(7027):749–754. doi: 10.1038/nature03387. [DOI] [PubMed] [Google Scholar]
- Dhande OS, Estevez ME, Quattrochi LE, El-Danaf RN, Nguyen PL, Berson DM, Huberman AD. Genetic Dissection of Retinal Inputs to Brainstem Nuclei Controlling Image Stabilization. J Neurosci. 2013;33(45):17797–17813. doi: 10.1523/JNEUROSCI.2778-13.2013. [DOI] [PMC free article] [PubMed] [Google Scholar]
- Dhande OS, Huberman AD. Retinal ganglion cell maps in the brain: implications for visual processing. Current Opinion in Neurobiology. 2014;24:133–142. doi: 10.1016/j.conb.2013.08.006. [DOI] [PMC free article] [PubMed] [Google Scholar]
- Ecker JL, Dumitrescu ON, Wong KY, Alam NM, Chen SK, LeGates T, Renna JM, Prusky GT, Berson DM, Hattar S. Melanopsin-expressing retinal ganglion-cell photoreceptors: cellular diversity and role in pattern vision. Neuron. 2010;67(1):49–60. doi: 10.1016/j.neuron.2010.05.023. [DOI] [PMC free article] [PubMed] [Google Scholar]
- Gaillard F, Karten HJ, Sauve Y. Retinorecipient areas in the diurnal murine rodent Arvicanthis niloticus: A disproportionally large superior colliculus. J Comp Neurol. 2013;521(8):1699–1726. doi: 10.1002/cne.23303. [DOI] [PubMed] [Google Scholar]
- Giolli RA, Blanks RHI, Lui F. The accessory optic system: basic organization with an update on connectivity, neurochemistry, and function. Neuroanatomy of the Oculomotor System. 2006;151:407–440. doi: 10.1016/S0079-6123(05)51013-6. [DOI] [PubMed] [Google Scholar]
- Gooley JJ, Ho Mien I, St Hilaire MA, Yeo SC, Chua EC, van Reen E, Hanley CJ, Hull JT, Czeisler CA, Lockley SW. Melanopsin and rod-cone photoreceptors play different roles in mediating pupillary light responses during exposure to continuous light in humans. J Neurosci. 2012;32(41):14242–14253. doi: 10.1523/JNEUROSCI.1321-12.2012. [DOI] [PMC free article] [PubMed] [Google Scholar]
- Goz D, Studholme K, Lappi DA, Rollag MD, Provencio I, Morin LP. Targeted destruction of photosensitive retinal ganglion cells with a saporin conjugate alters the effects of light on mouse circadian rhythms. PLoS ONE. 2008;3:e3153. doi: 10.1371/journal.pone.0003153. [DOI] [PMC free article] [PubMed] [Google Scholar]
- Guilding C, Hughes ATL, Piggins HD. CIRCADIAN OSCILLATORS IN THE EPITHALAMUS. Neuroscience. 2010;169(4):1630–1639. doi: 10.1016/j.neuroscience.2010.06.015. [DOI] [PMC free article] [PubMed] [Google Scholar]
- Guler AD, Ecker JL, Lall GS, Haq S, Altimus CM, Liao HW, Barnard AR, Cahill H, Badea TC, Zhao H, Hankins MW, Berson DM, Lucas RJ, Yau KW, Hattar S. Melanopsin cells are the principal conduits for rod-cone input to non-image-forming vision. Nature. 2008;453:102–105. doi: 10.1038/nature06829. [DOI] [PMC free article] [PubMed] [Google Scholar]
- Harrington ME. The ventral lateral geniculate nucleus and the intergeniculate leaflet: Interrelated structures in the visual and circadian systems. Neurosci Biobehav Rev. 1997;21(5):705–727. doi: 10.1016/s0149-7634(96)00019-x. [DOI] [PubMed] [Google Scholar]
- Hatori M, Le H, Vollmers C, Keding SR, Tanaka N, Schmedt C, Jegla T, Panda S. Inducible ablation of melanopsin-expressing retinal ganglion cells reveals their central role in non-image forming visual responses. PLoSONE. 2008;3(6):e2451. doi: 10.1371/journal.pone.0002451. [DOI] [PMC free article] [PubMed] [Google Scholar]
- Hattar S, Kumar M, Park A, Tong P, Tung J, Yau KW, Berson DM. Central projections of melanopsin-expressing retinal ganglion cells in the mouse. J Comp Neurol. 2006;497:326–349. doi: 10.1002/cne.20970. [DOI] [PMC free article] [PubMed] [Google Scholar]
- Hattar S, Liao HW, Takao M, Berson DM, Yau KW. Melanopsin-containing retinal ganglion cells: architecture, projections, and intrinsic photosensitivity. Science. 2002;295(5557):1065–1070. doi: 10.1126/science.1069609. [DOI] [PMC free article] [PubMed] [Google Scholar]
- Hattar S, Lucas RJ, Mrosovsky N, Thompson S, Douglas RH, Hankins MW, Lem J, Biel M, Hofmann F, Foster RG, Yau KW. Melanopsin and rod-cone photoreceptive systems account for all major accessory visual functions in mice. Nature. 2003;424(6944):76–81. doi: 10.1038/nature01761. [DOI] [PMC free article] [PubMed] [Google Scholar]
- Horowitz SS, Blanchard JH, Morin LP. Intergeniculate leaflet and ventral lateral geniculate nucleus afferent connections: an anatomical substrate for functional input from the vestibulo-visuomotor system. J Comp Neurol. 2004;474:227–245. doi: 10.1002/cne.20125. [DOI] [PubMed] [Google Scholar]
- Johnson RF, Moore RY, Morin LP. Loss of entrainment and anatomical plasticity after lesions of the hamster retinohypothalamic tract. Brain Res. 1988;460:297–313. doi: 10.1016/0006-8993(88)90374-5. [DOI] [PubMed] [Google Scholar]
- Kagan R, Kainz V, Burstein R, Noseda R. Hypothalamic and basal ganglia projections to the posterior thalamus: Possible role in modulation of migraine headache and photophobia. Neuroscience. 2013;248c:359–368. doi: 10.1016/j.neuroscience.2013.06.014. [DOI] [PMC free article] [PubMed] [Google Scholar]
- Krauzlis RJ, Lovejoy LP, Zenon A. Superior colliculus and visual spatial attention. Annu Rev Neurosci. 2013;36:165–182. doi: 10.1146/annurev-neuro-062012-170249. [DOI] [PMC free article] [PubMed] [Google Scholar]
- Lee CC, Winer JA. Connections of cat auditory cortex: I. Thalamocortical system. J Comp Neurol. 2008;507(6):1879–1900. doi: 10.1002/cne.21611. [DOI] [PMC free article] [PubMed] [Google Scholar]
- Li X, Gilbert J, Davis FC. Disruption of masking by hypothalamic lesions in Syrian hamsters. J Comp Physiol A NeuroetholSensNeural BehavPhysiol. 2005;191(1):23–30. doi: 10.1007/s00359-004-0569-5. [DOI] [PubMed] [Google Scholar]
- Ling C, Schneider GE, Jhaveri S. Target-specific morphology of retinal axon arbors in the adult hamster. Visual Neuroscience. 1998;15(3):559–579. doi: 10.1017/s0952523898153178. [DOI] [PubMed] [Google Scholar]
- Major DE, Rodman HR, Libedinsky C, Karten HJ. Pattern of retinal projections in the California ground squirrel (Spermophilus beecheyi): anterograde tracing study using cholera toxin. J Comp Neurol. 2003;463(3):317–340. doi: 10.1002/cne.10764. [DOI] [PubMed] [Google Scholar]
- Matteau I, Boire D, Ptito M. Retinal projections in the cat: a cholera toxin B subunit study. Visual Neuroscience. 2003;20(5):481–493. doi: 10.1017/s0952523803205022. [DOI] [PubMed] [Google Scholar]
- May PJ. The mammalian superior colliculus: laminar structure and connnections. ProgBrain Res. 2006;151:321–378. doi: 10.1016/S0079-6123(05)51011-2. [DOI] [PubMed] [Google Scholar]
- Mikkelsen JD. Visualization of efferent retinal projections by immunohistochemical identification of cholera toxin subunit B. Brain Res Bull. 1992;28:619–623. doi: 10.1016/0361-9230(92)90112-b. [DOI] [PubMed] [Google Scholar]
- Mooney RD, Fish SE, Rhoades RW. Anatomical and functional organization of pathway from superior colliculus to lateral posterior nucleus in hamster. J Neurophysiol. 1984;51:407–431. doi: 10.1152/jn.1984.51.3.407. [DOI] [PubMed] [Google Scholar]
- Morin LP. The circadian visual system. Brain ResRev. 1994;67:102–127. doi: 10.1016/0165-0173(94)90005-1. [DOI] [PubMed] [Google Scholar]
- Morin LP. Neuroanatomy of the extended circadian rhythm system. Exp Neurol. 2013a;243:4–20. doi: 10.1016/j.expneurol.2012.06.026. [DOI] [PMC free article] [PubMed] [Google Scholar]
- Morin LP. Nocturnal Light and Nocturnal Rodents: Similar regulation of disparate functions? J Biol Rhythms. 2013b;28:95–106. doi: 10.1177/0748730413481921. [DOI] [PubMed] [Google Scholar]
- Morin LP, Allen CN. The circadian visual system, 2005. Brain ResRev. 2006;51:1–60. doi: 10.1016/j.brainresrev.2005.08.003. [DOI] [PubMed] [Google Scholar]
- Morin LP, Blanchard JH. Neuropeptide Y and enkephalin immunoreactivity in retinorecipient nuclei of the hamster pretectum and thalamus. Visual Neuroscience. 1997;14:765–777. doi: 10.1017/s0952523800012712. [DOI] [PubMed] [Google Scholar]
- Morin LP, Blanchard JH. Interconnections among nuclei of the subcortical visual shell: The intergeniculate leaflet is a major constituent of the hamster subcortical visual system. J Comp Neurol. 1998;396:288–309. [PubMed] [Google Scholar]
- Morin LP, Blanchard JH. Forebrain connections of the hamster intergeniculate leaflet: comparison with those of ventral lateral geniculate nucleus and retina. Visual Neuroscience. 1999;16:1037–1054. doi: 10.1017/s0952523899166069. [DOI] [PubMed] [Google Scholar]
- Morin LP, Blanchard JH. Neuromodulator content of hamster intergeniculate leaflet neurons and their projection to the suprachiasmatic nucleus or visual midbrain. J Comp Neurol. 2001;437:79–90. doi: 10.1002/cne.1271. [DOI] [PubMed] [Google Scholar]
- Morin LP, Blanchard JH. Descending projections of the hamster intergeniculate leaflet: relationship to the sleep/arousal and visuomotor systems. J Comp Neurol. 2005;487:204–216. doi: 10.1002/cne.20546. [DOI] [PubMed] [Google Scholar]
- Morin LP, Studholme KM. Separation of function for classical and ganglion cell photoreceptors with respect to circadian rhythm entrainment and induction of photosomnolence. Neuroscience. 2011;199:213–224. doi: 10.1016/j.neuroscience.2011.09.057. [DOI] [PMC free article] [PubMed] [Google Scholar]
- Morin LP, Wood RI. A Stereotaxic Atlas of the Hamster Brain. New York: Academic; 2001. pp. 1–146. [Google Scholar]
- Muscat L, Huberman AD, Jordan CL, Morin LP. Crossed and uncrossed retinal projections to the hamster circadian system. JComp Neurol. 2003;466(4):513–524. doi: 10.1002/cne.10894. [DOI] [PubMed] [Google Scholar]
- Nakagawa S, Mizuma M, Kuchiiwa S. The retinal projections to the ventral and dorsal divisions of the medial terminal nucleus and mesencephalic reticular formation in the Japanese monkey (Macaca fuscata): a reinvestigation with cholera toxin B subunit as an anterograde tracer. Brain Res. 1998;809(2):198–203. doi: 10.1016/s0006-8993(98)00865-8. [DOI] [PubMed] [Google Scholar]
- Noseda R, Burstein R. Advances in understanding the mechanisms of migraine-type photophobia. Curr Opin Neurol. 2011;24(3):197–202. doi: 10.1097/WCO.0b013e3283466c8e. [DOI] [PMC free article] [PubMed] [Google Scholar]
- Noseda R, Kainz V, Jakubowski M, Gooley JJ, Saper CB, Digre K, Burstein R. A neural mechanism for exacerbation of headache by light. Nat Neurosci. 2010;13(2):239–245. doi: 10.1038/nn.2475. [DOI] [PMC free article] [PubMed] [Google Scholar]
- Panda S, Sato TK, Castrucci AM, Rollag MD, DeGrip WJ, Hogenesch JB, Provencio I, Kay SA. Melanopsin (Opn4) requirement for normal light-induced circadian phase shifting. Science. 2002;298(5601):2213–2216. doi: 10.1126/science.1076848. [DOI] [PubMed] [Google Scholar]
- Paul MJ, Indic P, Schwartz WJ. A role for the habenula in the regulation of locomotor activity cycles. Eur J Neurosci. 2011;34(3):478–488. doi: 10.1111/j.1460-9568.2011.07762.x. [DOI] [PMC free article] [PubMed] [Google Scholar]
- Paxinos G, Franklin KBJ. The mouse brain in stereotaxic coordinates. Amsterdam ; Boston: Elsevier Academic Press; 2004. [Google Scholar]
- Paxinos G, Watson C. The rat brain in stereotaxic coordinates. New York: Academic; 1986. [DOI] [PubMed] [Google Scholar]
- Paxinos G, Watson C. The Rat Brain in Stereotaxic Coordinates. New York: Academic Press; 1998. [Google Scholar]
- Pemberton HR. Recent investigations on the structure and relations of the optic thalami. J Comp Neurol. 1891;1:135–148. [Google Scholar]
- Pickard GE. Bifurcating axons of retinal ganglion cells terminate in the hypothalamic suprachiasmatic nucleus and the intergeniculate leaflet of the thalamus. Neurosci Lett. 1985;55:211–217. doi: 10.1016/0304-3940(85)90022-9. [DOI] [PubMed] [Google Scholar]
- Pickard GE, Silverman AJ. Direct retinal projections to hypothalamus, piriform cortex and accessory optic nuclei in the golden hamster as demonstrated by a sensitive anterograde horseradish peroxidase technique. J Comp Neurol. 1981;196:155–172. doi: 10.1002/cne.901960111. [DOI] [PubMed] [Google Scholar]
- Pieper DR, Tang YK, Lipski TP, Subramanian MG, Newman SW. Olfactory bulbectomy prevents the gonadal regression associated with short photoperiod in male golden-hamsters. Brain Res. 1984;321(1):183–186. doi: 10.1016/0006-8993(84)90699-1. [DOI] [PubMed] [Google Scholar]
- Power BD, Leamey CA, Mitrofanis J. Evidence for a visual subsector within the zona incerta. Visual Neuroscience. 2001;18(2):179–186. doi: 10.1017/s0952523801182027. [DOI] [PubMed] [Google Scholar]
- Provencio I, Jiang G, De Grip WJ, Hayes WP, Rollag MD. Melanopsin: An opsin in melanophores, brain, and eye. Proc Natl Acad Sci U S A. 1998;95(1):340–345. doi: 10.1073/pnas.95.1.340. [DOI] [PMC free article] [PubMed] [Google Scholar]
- Raitiere MN, Garyfallou VT, Urbanski HF. Lesions in the bed nucleus of the stria terminalis, but not in the lateral septum, inhibit short-photoperiod-induced testicular regression in Syrian hamsters. Brain Res. 1995;705(1–2):159–167. doi: 10.1016/0006-8993(95)01152-8. [DOI] [PubMed] [Google Scholar]
- Rodieck RW. The First Steps in Seeing. Sunderland, MA: Sinauer Associates; 1998. pp. 1–562. [Google Scholar]
- Saper CB, Fuller PM, Pedersen NP, Lu J, Scammell TE. Sleep State Switching. Neuron. 2010;68(6):1023–1042. doi: 10.1016/j.neuron.2010.11.032. [DOI] [PMC free article] [PubMed] [Google Scholar]
- Scalia F, Arango V. Topographic organization of the projections of the retina to the pretectal region in the rat. J Comp Neurol. 1979;186:271–292. doi: 10.1002/cne.901860210. [DOI] [PubMed] [Google Scholar]
- Schmidt TM, Do MTH, Dacey D, Lucas R, Hattar S, Matynia A. Melanopsin-Positive Intrinsically Photosensitive Retinal Ganglion Cells: From Form to Function. J Neurosci. 2011;31(45):16094–16101. doi: 10.1523/JNEUROSCI.4132-11.2011. [DOI] [PMC free article] [PubMed] [Google Scholar]
- Sefton AJ, Dreher B. Visual system. In: Paxinos G, editor. The rat nervous system. 2. New York: Academic; 1995. pp. 833–898. [Google Scholar]
- Sherman SM, Guillery RW. Functional organization of thalamocortical relays. J Neurophysiol. 1996;76:1367–1395. doi: 10.1152/jn.1996.76.3.1367. [DOI] [PubMed] [Google Scholar]
- Simpson JI, Leonard CS, Soodak RE. The accessory optic-system - analyzer of self-motion. NYAS. 1988;545:170–179. doi: 10.1111/j.1749-6632.1988.tb19562.x. [DOI] [PubMed] [Google Scholar]
- Soodak RE, Simpson JI. The accessory optic-system of rabbit .1. Basic visual response properties. J Neurophysiol. 1988;60(6):2037–2054. doi: 10.1152/jn.1988.60.6.2037. [DOI] [PubMed] [Google Scholar]
- Stein BE, Merideth MA. Functional organization of the superior colliculus. In: Leventhal AG, editor. The neural basis of visual function. Hampshire, UK: Macmillan Press; 1991. pp. 85–110. [Google Scholar]
- Stein BE, Rowland BA. Organization and plasticity in multisensory integration: early and late experience affects its governing principles. Prog Brain Res. 2011;191:145–163. doi: 10.1016/B978-0-444-53752-2.00007-2. [DOI] [PMC free article] [PubMed] [Google Scholar]
- Studholme KM, Gompf HS, Morin LP. Brief light stimulation during the mouse nocturnal activity phase simultaneously induces a decline in core temperature and locomotor activity followed by EEG¬-determined sleep. Am J Physiol Regul Integr Comp Physiol. 2013;304(6):R459–R471. doi: 10.1152/ajpregu.00460.2012. [DOI] [PMC free article] [PubMed] [Google Scholar]
- Tan HS, Vandersteen J, Simpson JI, Collewijn H. 3-Dimensional organization of optokinetic responses in the rabbit. J Neurophysiol. 1993;69(2):303–317. doi: 10.1152/jn.1993.69.2.303. [DOI] [PubMed] [Google Scholar]
- Uchiumi O, Sugita S, Fukuta K. Retinal projections to the subcortical nuclei in the japanese field vole (Microtus-montebelli) Exp Anim. 1995;44(3):193–203. doi: 10.1538/expanim.44.193. [DOI] [PubMed] [Google Scholar]
- Wagner CK, Silverman AJ, Morrell JI. Evidence for estrogen receptor in cell nuclei and axon terminals within the lateral habenula of the rat: Regulation during pregnancy. J Comp Neurol. 1998;392(3):330–342. [PubMed] [Google Scholar]
- Walker DL, Davis M. Double dissociation between the involvement of the bed nucleus of the stria terminalis and the central nucleus of the amygdala in startle increases produced by conditioned versus unconditioned fear. J Neurosci. 1997;17(23):9375–9383. doi: 10.1523/JNEUROSCI.17-23-09375.1997. [DOI] [PMC free article] [PubMed] [Google Scholar]
- Zhao H, Rusak B. Circadian firing-rate rhythms and light responses of rat habenular nucleus neurons in vivo and in vitro. Neuroscience. 2005;132(2):519–528. doi: 10.1016/j.neuroscience.2005.01.012. [DOI] [PubMed] [Google Scholar]