

Abstract
Growth hormone secretagogue receptor (GHSR) 1a is the only molecularly identified receptor for ghrelin, mediating ghrelin-related effects on eating, body weight and blood glucose control, among others. The expression pattern of GHSR within the brain has been assessed previously using several neuroanatomical techniques. However, inherent limitations to these techniques and the lack of reliable anti-GHSR antibodies and reporter rodent models that identify GHSR-containing neurons have prevented a more comprehensive functional characterization of ghrelin-responsive neurons. Here, we have systematically characterized the brain expression of an enhanced green fluorescence protein (eGFP) transgene controlled by the Ghsr promoter in a recently-reported GHSR reporter mouse. Expression of eGFP in coronal brain sections was compared with GHSR mRNA expression detected in the same sections by in situ hybridization histochemistry. eGFP-immunoreactivity was detected in several areas including the prefrontal cortex, insular cortex, olfactory bulb, amygdala and hippocampus, which showed no or low GHSR mRNA expression. In contrast, eGFP expression was low in several midbrain regions and in several hypothalamic nuclei – particularly the arcuate nucleus– where robust GHSR mRNA expression has been well-characterized. eGFP expression in several brainstem nuclei showed high to moderate degrees of co-localization with GHSR mRNA labeling. Further quantitative PCR and electrophysiological analyses of eGFP-labeled hippocampal cells confirmed faithful expression of eGFP within GHSR-containing, ghrelin-responsive neurons. In summary, the GHSR-eGFP reporter mouse model may be a useful tool to study GHSR function – particularly within the brainstem and hippocampus– however, it underrepresents GHSR expression in nuclei within the hypothalamus and midbrain.
Keywords: GHSR, Ghrelin, Reporter mouse model, eGFP, RRID: AB_10000240, IMSR_MMRRC:030942
Introduction
Ghrelin is a peptide hormone secreted primarily from gastrointestinal “ghrelin cells” (Date et al., 2000; Kojima et al., 1999; Sakata et al., 2009). Ghrelin is secreted in response to energy insufficiency and psychological stress and has many actions, including those that are orexigenic, antidepressant, proneurogenic, glucoregulatory, gastroprokinetic and rewarding (Asakawa et al., 2001; Castaneda et al., 2010; Chuang et al., 2011a; Delhanty and van der Lely, 2011; Dickson et al., 2011; Masuda et al., 2000; Spencer et al., 2012; Ueno et al., 2005). The hormone exists in acylated and des-acylated isoforms in circulation (Hosoda et al., 2000). Ghrelin O-acyl transferase (GOAT) is the unique enzyme that attaches octanoate to proghrelin, which is then cleaved to acyl-ghrelin within the ghrelin secreting cells before secretion (Gutierrez et al., 2008; Yang et al., 2008). Most studies demonstrate that this posttranslational modification is required for binding of ghrelin to its endogenous receptor, the growth hormone secretagogue receptor (GHSR; ghrelin receptor) (Bednarek et al., 2000; Hosoda et al., 2000; Kojima et al., 1999).
GHSR is a product of the Ghsr gene, which encodes two types of GHSR mRNA through alternative splicing – GHSR-1a and GHSR-1b (McKee et al., 1997; Petersenn et al., 2001). GHSR-1a encodes an identically-named seven transmembrane domain receptor of 366 amino acids that both binds ghrelin and has some degree of constitutive activity (Holst et al., 2003; Howard et al., 1996; McKee et al., 1997). GHSR-1b, a C-terminal truncated form of 289 amino acids that lacks the transmembrane domains 6 and 7, can neither bind to ghrelin nor has any known signal transduction activity (Howard et al., 1996; McKee et al., 1997). Interestingly, GHSR-1a and 1b receptors can form heterodimers within the endoplasmic reticulum and reduce constitutive activity by decreasing cell surface GHSR-1a receptor expression (Chow et al., 2012). GHSR-1a receptors (hereafter referred to as GHSRs), were first isolated from the pituitary and are also expressed in the brain, spinal cord and several peripheral organs including the pancreas, gastrointestinal tract, and testis (Baatar et al., 2011; Camina, 2006; Chuang et al., 2011b; Cruz and Smith, 2008; Howard et al., 1996; Papotti et al., 2000; Zigman et al., 2006). Most papers on ghrelin action and GHSR expression have focused on the brain, where GHSRs have been localized to several distinct regions including several sites in the hypothalamus, midbrain, caudal brainstem and raphe. GHSR expression in the brain has been studied in rodent and primate models using several techniques including in situ hybridization histochemistry (ISHH), immunohistochemistry (IHC), receptor binding studies, Western blot analysis, reverse transcriptase - polymerase chain reaction (RT-PCR) and ribonuclease protection assay (Bennett et al., 1997; Bron et al., 2013; Cabral et al., 2013; Gnanapavan et al., 2002; Guan et al., 1997; Howard et al., 1996; Kamegai et al., 1999; Sun et al., 2007; Tannenbaum et al., 1998; Tong et al., 2011; Zigman et al., 2006). Of these techniques, only the first three offer an in situ anatomical view of the protein or message within the different regions of the brain, and none allows for functional characterization of identified GHSR-containing neurons. Techniques such as ISHH are labor-intensive and not always sensitive, tending to underestimate actual gene expression levels, especially of cell surface receptors which, as a group, have relatively low mRNA abundance. Furthermore, cell surface receptors often lack adequate antigenicity to permit the generation of reliable antibodies for use in IHC, as seems to be the case for anti-GHSR antibodies (Reichenbach et al., 2012). These inherent limitations are further magnified when attempting dual-label histochemistry studies to further characterize neuronal populations. A reporter mouse for GHSR expression would facilitate identification of GHSR-expressing neurons and further characterization of their projections, inputs, chemical identities, electrophysiological properties, function and responses to behavioral or physiologic perturbation.
Genetically-engineered mouse models in which expression of a reporter gene is driven by transcriptional regulatory regions of a gene-of-interest have emerged as a powerful technique to mark cells expressing that gene-of-interest. Such reporter mice models have the potential to provide reliable and stable expression of the reporter transgene (Liu et al., 2003), and a small number have been generated to report GHSR-expressing cells. One such mouse model was generated by a targeted knock-in approach such that the GHSR coding region was replaced by that of β-galactosidase (Diano et al., 2006). While β-galactosidase activity or immunoreactivity can be assessed to localize cells that would otherwise normally express GHSR, this reporter model nonetheless lacks GHSR expression, limiting the utility of these mice for simultaneous functional studies. A second reporter mouse model contains an engineered GHSR gene modified by the addition of a tau green fluorescent protein (tauGFP) downstream of an internal ribosome entry site (IRES) (Jiang et al., 2006), thus theoretically allowing for both GHSR expression and expression of the more easily-detectable eGFP reporter. The IRES-mediated reporter system also has potential limitations because the downstream reporter gene is not always efficiently expressed as the upstream gene (Bouabe et al., 2008).
Recently, the Gene Expression Nervous System Atlas (GENSAT) project at Rockefeller University developed another GHSR reporter mouse model. This GHSR-eGFP transgenic mouse line contains presumed multiple copies of a modified GHSR gene-containing bacterial artificial chromosome (BAC RP23-358A16) in which an enhanced GFP coding sequence is inserted at the translational start site of GHSR. The GHSR-eGFP line has already generated interest, having been used as a reporter for GHSR expression in a limited subset of brain nuclei and spinal cord (Furness et al., 2011; Smith et al., 2013; Spencer et al., 2012), the pituitary (Reichenbach et al., 2012) and the kidney (Callaghan et al., 2012; Venables et al., 2011). However, the accuracy of the eGFP fluorescence expression in the transgenic reporter mouse model has not yet been systematically validated throughout the entire rostro-caudal extent of the brain.
The aim of the current study is to validate the GHSR-eGFP mouse model as an accurate reporter for GHSR-expressing neurons in the brain. Using dual-label in situ hybridization to detect expression of GHSR mRNA and immunohistochemistry to stably label eGFP, we comprehensively tested the accuracy of this model in reporting brain GHSR expression. We also used quantitative RT-PCR on fluorescence activated cell sorting (FACS)-separated hippocampal populations and electrophysiology on dispersed hippocampal neurons to further validate the model.
Materials and Methods
Animals
All animal experiments were approved by Institutional Animal Care and Use Committees of University of Texas Southwestern Medical Center and Multidisciplinary Institute of Cell Biology, Buenos Aires, Argentina. Mice were housed under a 12 h dark-light cycle in standard environmentally controlled conditions. GHSR-eGFP transgenic mice were obtained from the Mouse Mutant Regional Resource Center (MMRC) Repository at University of California at Davis [Tg(Ghsr-EGFP)KZ65Gsat; RRID:IMSR_MMRRC:030942]. The mouse line was generated on an FVB/N-Crl:CD1(ICR) genetic background. We backcrossed the hemizygous mice to C57BL/6 mice and N2 breeding heterozygote pairs were used to generate mice (N2F1) for the present study. Transgenic mice were identified by genotyping using forward 5’-GGACCTCCTCAGGGGACCAGAT-3’ and reverse 5’-GGTCGGGGTAGCGGCTGAA-3’ primers. Mice had free access to standard rodent chow diet (Teklad Global Diet- 16% protein diet [2016]; Harlan Teklad, Madison, WI) except where noted. Sixty percent caloric restriction was achieved by first monitoring and averaging daily food intake of six individually-housed, 12-to-16-week old mice, and then by providing 40% of the average daily feed intake at the start of the dark cycle, as described previously (Wang et al., 2014; Zhao et al., 2010).
Tissue preparation for histology
The mice were deeply anesthetized with intraperitoneal injection of chloral hydrate (500 mg/kg for mice) and transcardially perfused with diethylpyrocarbonate (DEPC)-treated 0.9% phosphate-buffered saline (PBS) followed by 10% neutral buffered formalin, as described previously (Zigman et al., 2006). Brains were removed immediately and stored in the same fixative for 4–6 h at 4°C, immersed in 20% sucrose in DEPC-treated PBS, pH 7.0 at 4°C overnight, and sectioned coronally into five equal series at a thickness of 25 μm on a sliding microtome. The sections were stored at −20°C in an antifreeze solution (Simmons et al., 1989) until further processing. To visualize endogenous eGFP, sections were mounted on to SuperFrost slides (Fisher Scientific, Pittsburgh, PA), dried overnight and cover slipped with Vectashield Hardset Mounting Media (Vector Labs, Burlingame, CA).
Antibody specificity
Details regarding the GFP primary antibody used in the study are provided in Table 1. The antibody has been validated in previously published studies for its specificity by immunohistochemical detection of GFP in samples from mice harboring eGFP transgenes, but not in wild type mice (Gautron et al., 2010; Zhao et al., 2008). We further confirmed the specificity of the antibody by demonstrating endogenous eGFP fluorescence pattern (Figure 1) similar to eGFP immunoreactivity using the primary antibody (Figure 2 and 3).
Table 1.
Primary Antibody Used in This Study
| Antibody | Immunizing Antigen | Host Species | Manufacturer/Catalog Number | RRID# | Dilution |
|---|---|---|---|---|---|
| Green fluorescent protein (GFP) | Recombinant GFP protein | Chicken (Polyclonal) | Aves laboratories, Tigard, OR; GFP-1020 | AB_10000240 | 1:5,000 |
Figure 1.
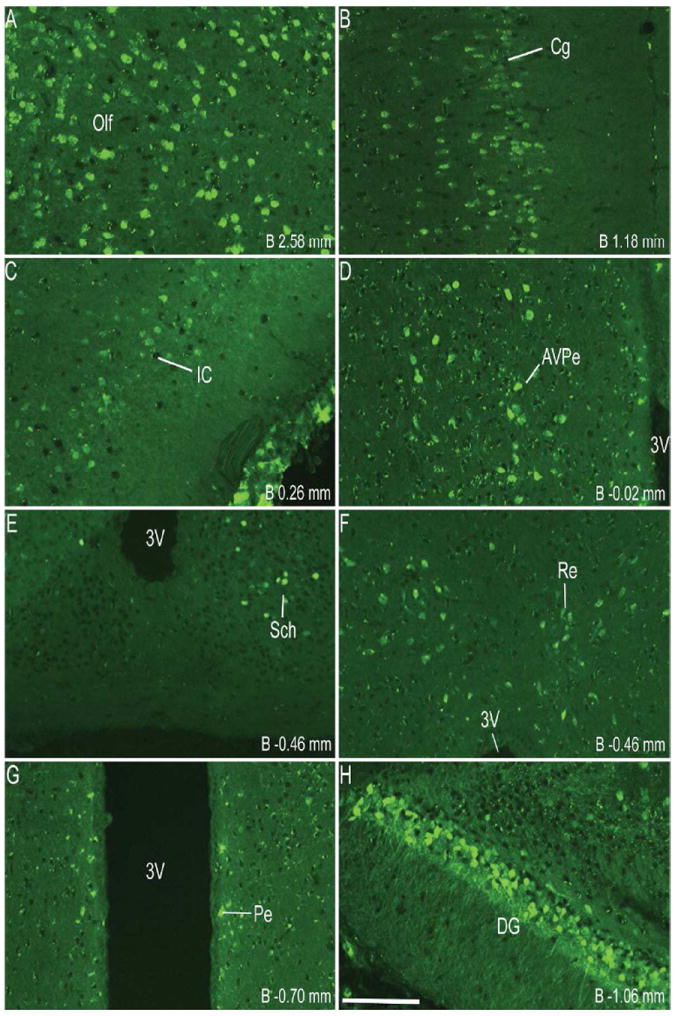
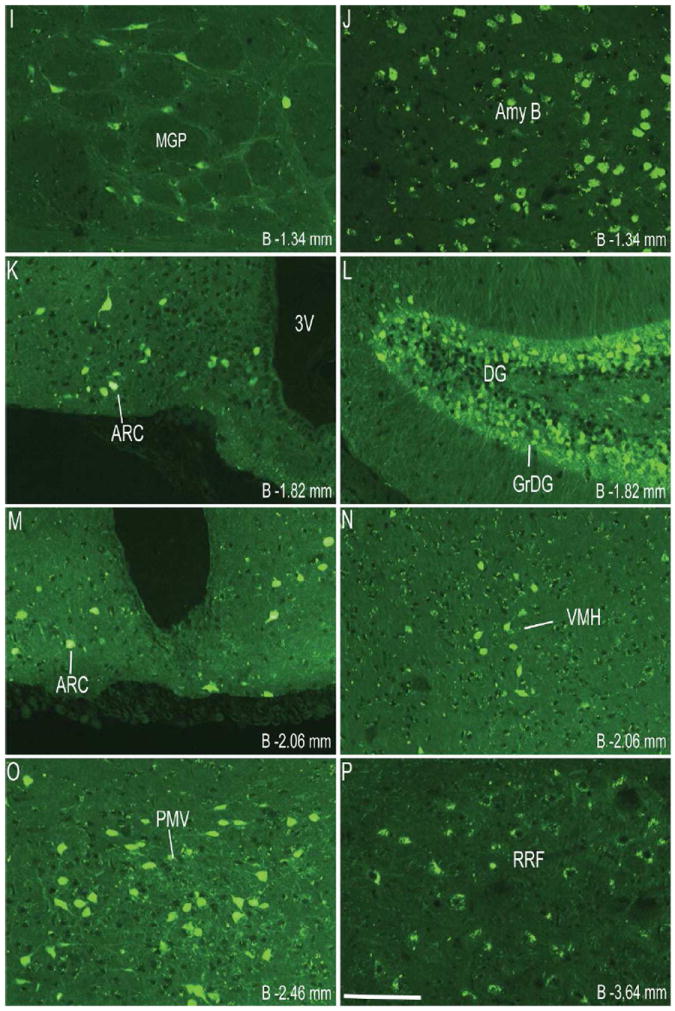
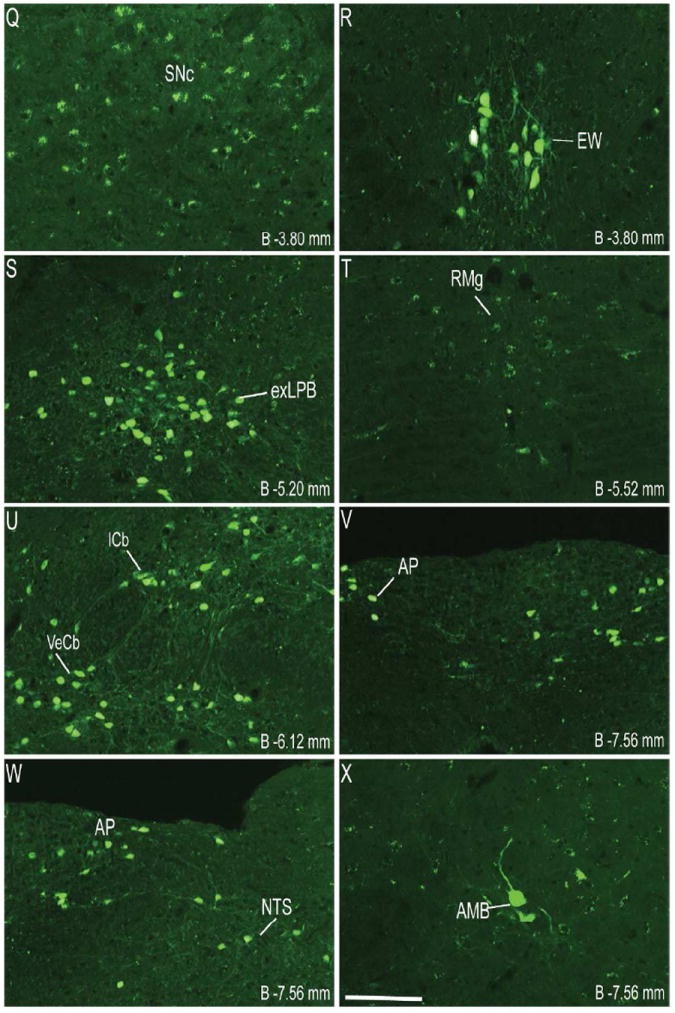
Series of representative photomicrographs demonstrating the endogenous fluorescence expression pattern in coronal sections of GHSR-eGFP mouse brain. Scale bars = 100 μm in A (applies to A–H), P (applies to I–P) and X (applies to Q–X). Approximate distance of the coronal section from bregma (B) is indicated in each photomicrograph. 3V- Third ventricle, GrDG- Granular layer of Dentate Gyrus. See Table 2 for explanation of other abbreviations.
Figure 2.
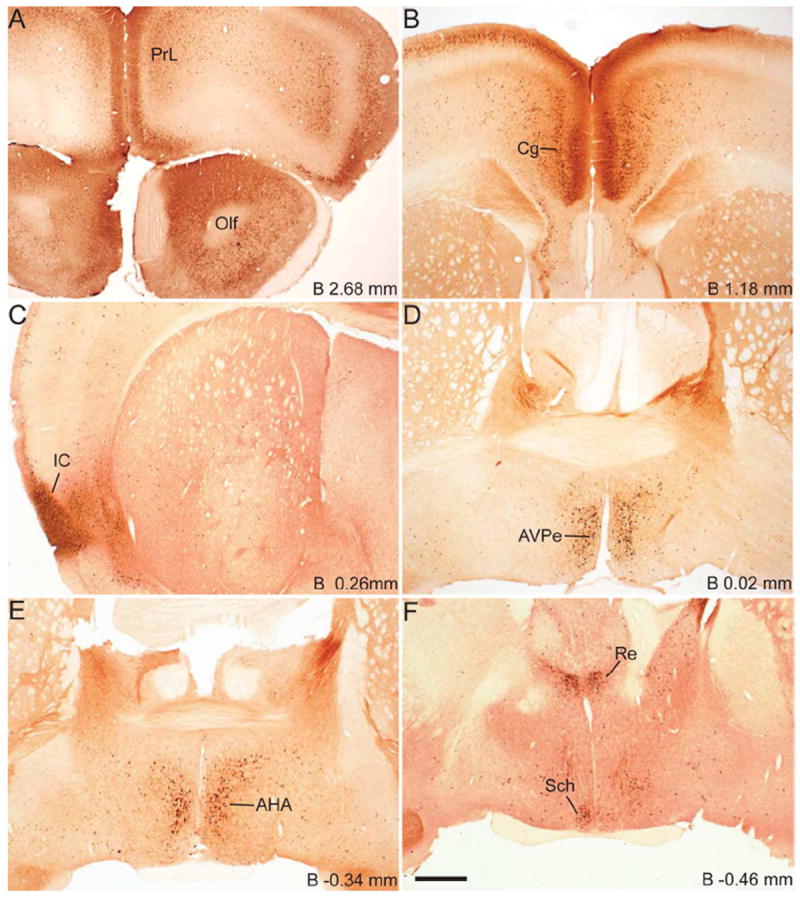
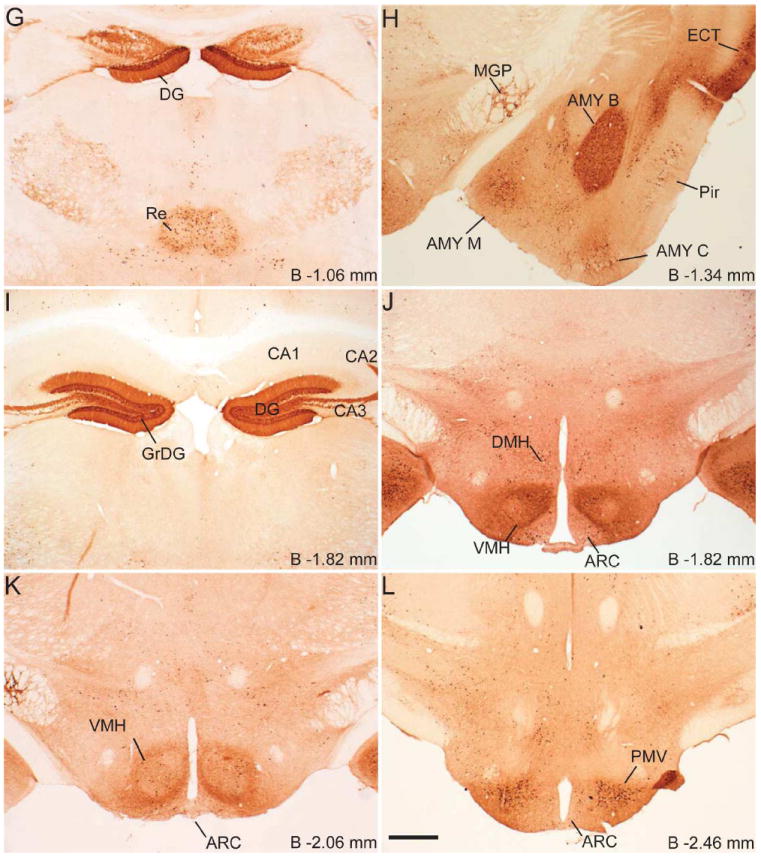
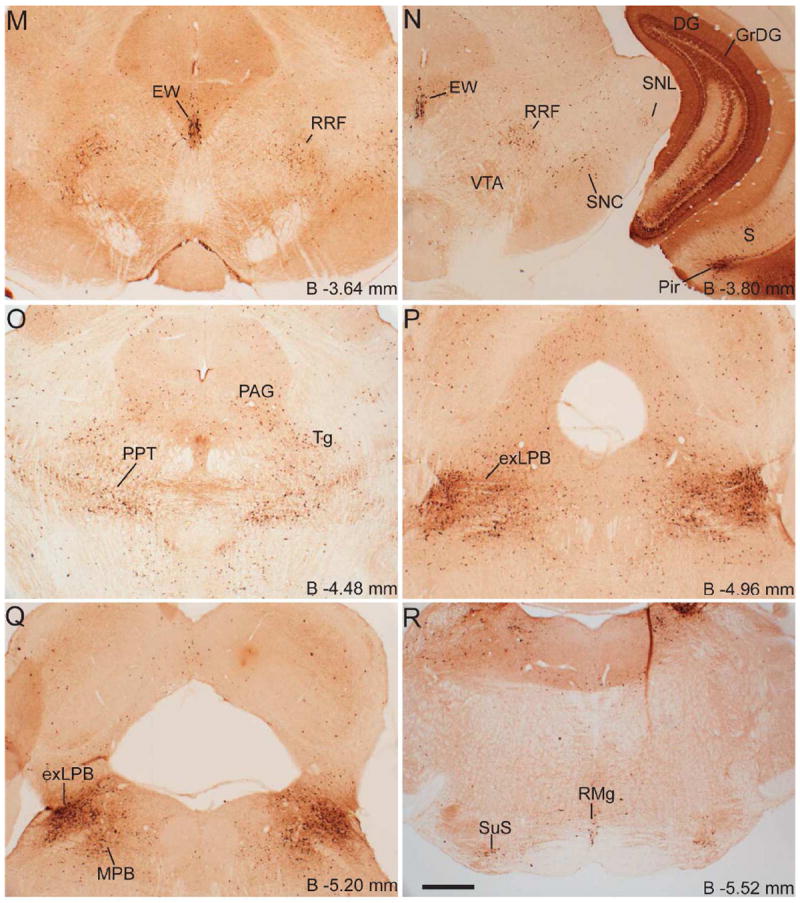
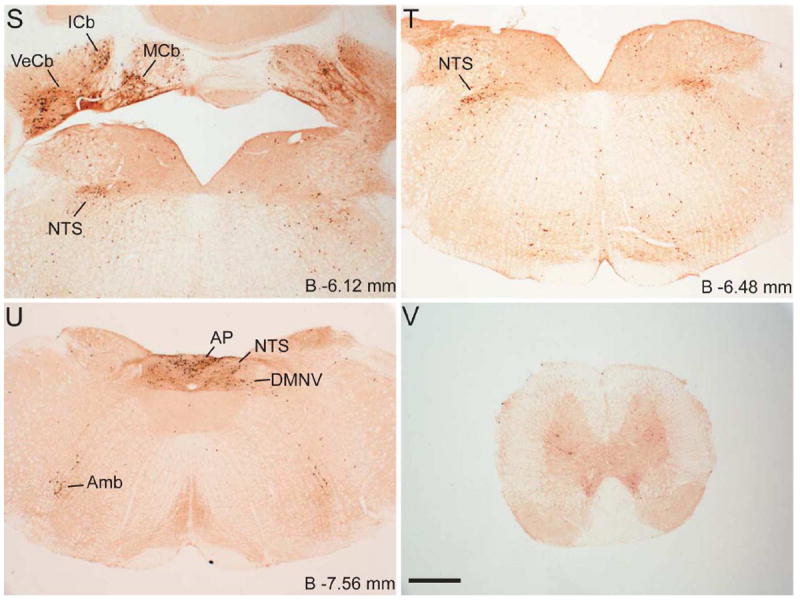
Series of low-power bright-field representative photomicrographs summarizing eGFP immunoreactive sites in the coronal sections of GHSR-eGFP mouse brain. Scale bars = 500 μm in F (applies to A–F), L (applies to G–L), R (applies to M–R) and V (applies to S–V). Approximate distance of the coronal section from bregma (B) is indicated in each photomicrograph. GrDG- Granular layer of Dentate Gyrus. See Table 2 for explanation of other abbreviations.
Figure 3.
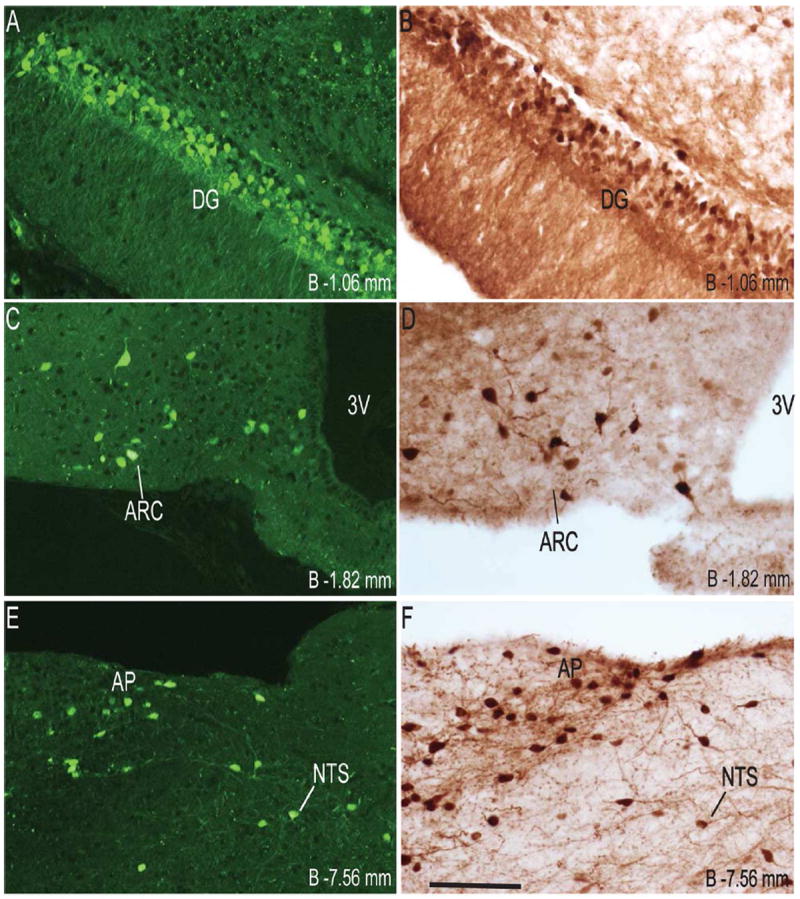
High-power photomicrographs of representative GHSR-eGFP mouse brain coronal sections showing side-by-side comparison of endogenous eGFP fluorescence (A, C and E) as opposed to eGFP immunoreactivity (B, D and F). Scale bars = 100 μm in F (applies to A–F). Approximate distance of the coronal section from bregma (B) is indicated in each photomicrograph. 3V- Third ventricle. See Table 2 for explanation of other abbreviations.
Immunohistochemistry
Immunohistochemistry was performed as described previously (Gautron et al., 2010). The sections were washed three times with PBS to remove the antifreeze solution. After washing, sections were pretreated with 0.3% hydrogen peroxide in PBS, pH 7.4, for 30 minutes at room temperature and then were incubated in 3% normal donkey serum (Jackson ImmunoResearch Laboratories, West Grove, PA) with 0.3% Triton X-100 in PBS (PBT) for 2 h at room temperature. The sections were then incubated overnight at room temperature in chicken anti-GFP primary antibody (Aves laboratories, Tigard, OR; Cat# GFP-1020 RRID:AB_10000240; 1:5,000 in PBT). After washing with PBS, sections were incubated in biotin-conjugated donkey anti-chicken IgG (Jackson ImmunoResearch Laboratories; 1:1,000) for 2 h at room temperature, followed by incubation for 1 h in a solution of avidin-biotin complex (Vectastain Elite ABC Kit, Vector Laboratories, Burlingame, CA; 1:500) diluted in PBS. The sections were next washed in PBS and incubated in diaminobenzidine (DAB) using an enhanced DAB substrate kit (Thermo Scientific, Pittsburg, PA), mounted onto SuperFrost slides and then dehydrated in increasing concentrations of ethanol. Thereafter, the slides were cleared with xylenes and cover-slipped with Permount (Thermo Scientific, Pittsburg, PA) mounting medium.
Generation of GHSR-1a cRNA probes
The GHSR-1a cRNA probes were generated using procedures described in previously (Chuang et al., 2011a; Scott et al., 2012). Briefly, a 916-bp fragment of GHSR-1a cDNA was used as template and amplified with GHSR-specific primers (mGHSR1047, 5′-GTGGTGTTTGCTTTCATCCTC-3′, and mGHSR1962, 5′-CATGCTCAAATTAAATGCATCC-3′). The PCR products were then gel purified and cloned in to PCR4-TOPO vector (Life technologies, Carlsbad, CA). Antisense 33P-labeled cRNA riboprobes were generated by linearizing the plasmid by restriction digestion and then subjecting to in vitro transcription with either T3 or T7 RNA polymerases according to the manufacturer’s protocol (Ambion, Austin, TX).
Dual-label in situ hybridization histochemistry and immunohistochemistry
Free-floating sections of mouse brains were subjected sequentially to ISHH and IHC using procedures reported previously (Elias et al., 1998; Zigman et al., 2006). Sectioned series of three different mouse brains were first rinsed in DEPC-treated PBS, pH 7.0, and were pretreated with 0.1% sodium borohydride (Sigma, St. Louis, MO) in DEPC-treated PBS for 15 minutes at room temperature. After thorough washing in DEPC-treated PBS the sections were rinsed in 0.1 M triethanolamine (TEA, pH 8.0), incubated in 0.25% acetic anhydride in 0.1 M TEA for 10 minutes, then washed again in 2X saline-sodium citrate buffer (SSC). The sections were then incubated at 50°C for 16 h with 33P-labeled mouse GHSR riboprobe diluted to 106 cpm/mL in hybridization solution (Chuang et al., 2011a). Subsequently, sections were rinsed in 4X SSC and incubated in 0.002% RNase A (Roche Molecular Biochemicals, Indianapolis, IN) solution for 30 min at 37°C. Sections were then rinsed in 2X SSC and submitted to sequential stringency washes with 2X SSC and 0.2X SSC for 1 h each at 55°C. After ISHH, IHC for eGFP was performed in the same free-floating sections as described above. After performing IHC, the sections were mounted onto SuperFrost slides, air dried and placed in an X-ray cassette with BMR-2 film (Kodak, Rochester, NY) for 3 days. Following film development and confirmation of signals on autoradiographic films, slides were dipped in NTB2 photographic emulsion (Kodak) and stored in the dark at 4°C for 2 weeks. The slides were then developed with D-19 developer (Kodak) to precipitate the silver granules, dehydrated in graded ethanol solution, cleared with xylenes and cover-slipped with Permount mounting medium.
Photomicrographs and data analysis
Endogenous eGFP fluorescence was examined using a Zeiss microscope (Imager ZI; Thornwood, NY) attached to an ApoTome System and a digital camera (Axiocam MRm). Photomicrograph images were taken using AxioVision software installed in a desktop computer attached to the microscope and the digital camera. Following IHC or dual ISHH and IHC, the mounted brain sections were viewed with a Zeiss Axioskop microscope using both brightfield and darkfield optics. Photomicrographs were produced with a Zeiss digital camera attached to the microscope and a desktop computer. Criteria used to determine co-localization of eGFP and GHSR mRNA was brightfield visualization of silver granules overlying the DAB-labeled cell at least 3X the background density of silver granule deposition. An image editing software program, Adobe Photo-Shop CS5.1 (San Jose, CA), was used to adjust sharpness, contrast and brightness of the photomicrographs and to pseudo color fluorescent images taken in grey scale.
Electrophysiology
Hippocampal neurons were harvested on embryonic day 17-18 from GHSR-eGFP mice and cultured as described previously (Bronk et al., 2007; Raingo et al., 2012). Kv7 potassium currents were recorded from the primary cultured hippocampal neurons between days 9-13 in vitro at room temperature (22 - 25 °C), using a whole cell patch clamp configuration using procedures similar to those described previously (Shi et al., 2013). Cells were superfused with external solution that contained (in mM): 135 NaCl, 4.7 KCl, 1.2 MgCl2, 2.5 CaCl2, 10 HEPES, 10 glucose and 0.001 tetrodotoxin; pH 7.3, adjusted with NaOH. The pipette solution contained (in mM): 140 K-gluconate, 5 KCl, 5 NaCl, 10 HEPES, 0.6 EGTA, 4 MgCl2, 3 Na2ATP, 0.3 Na2GTP; pH 7.3, adjusted with KOH. Cells were chosen as eGFP+ and eGFP- based on the fluorescence intensity visualized by excitation using UV light with 420 – 490 nM band pass filters fitted to a Zeiss inverted microscope. Slow deactivating Kv7 currents were recorded using a standard deactivation protocol (500 mS hyperpolarizing steps to -30 mV from a holding potential of -20 mV). Series resistance was less than 5 MΩ during recording. Digitalized signals were acquired with an Axopatch 200B amplifier (Molecular Devices, Sunnyvale, CA) at a frequency of 10 kHz. The recordings were filtered at 5 kHz and analyzed using pClamp 8.2 software (Molecular Devices).
Hippocampal Cell Isolation and Fluorescence Activated Cell Sorting (FACS)
A combined enzymatic and mechanical dispersion technique was used to isolate hippocampal cells. For each FACS procedure, a combination of 8–20 week old male and female GHSR-eGFP transgenic mice was live decapitated and the brains were quickly removed. The hippocampus was dissected from both the right and left hemispheres of the brains and placed quickly into ice-cold Hanks Buffered Saline Solution (HBSS). The whole hippocampi from 3–4 mice were pooled and incubated in 2.5 U/mL Dispase II (Roche Diagnostic Corporation, Indianapolis, IN) in PBS for 30 min at 37°C. The cells were then triturated by repeated pipetting. Thereafter, freshly prepared FACS buffer solution (0.5 mM EDTA, 10% D+ glucose, and 0.3% BSA in HBSS) was added to stop the Dispase action. Cells were pelleted by centrifuging at 2000 rpm for 10 min at 4°C and re-suspended in FACS buffer solution before filtering through a 100 μm nylon mesh. The cell suspension was again filtered twice through a 35 μm filter. The dissociated cells were then analyzed and sorted with FACSAriaTM (Becton Dickinson, San Jose, CA) at the UTSW Medical Center Multi-user Core Facility. Cells were sorted into eGFP-enriched population and eGFP-negative population based on fluorescence intensity using excitation and emission wavelength of 488 nm and 508 nm, respectively). Data from four independent FACS preparations were included in the analysis.
RNA Extraction and Quantitative PCR (QPCR)
RNA extraction and quantitative PCR on the sorted eGFP-enriched and eGFP negative pools were performed similarly to methods reported previously (Walker et al., 2013). The two pools of cells were adjusted after each FACS separation to contain a matched number of cells ranging from 18,000 to 43,000. Cells were lysed with RNA STAT-60 (Tel-Test, Friendswood, TX) and the total RNA was extracted using standard guanidium-phenol-chloroform phase separation method, followed by precipitation of the pellet using isopropanol overnight at 4°C. The RNA pellets were washed with 70% ethanol prior to reconstitution in RNAlater (Ambion, Naugatuck, CT). The relative purity and concentration of the RNA was determined using a NANODROP 1000 spectrophotometer (Thermo Fisher Scientific, Waltham, MA). Total RNA was then treated with DNase I (Quiagen, Valencia, CA), and complementary DNA (cDNA) was synthesized from RNA using Superscript III reverse transcriptase (Invitrogen, Carlsbad, CA). For qPCR, iTaq SYBR Supermix (Bio-Rad Laboratories, Hercules, CA) was used for amplification and detection, with 25 ng cDNA loaded per well. The ABI 7300 Real-time PCR System (Applied Biosystems, Foster City, CA) was used to determine the mRNA expression level for the genes of interest. Previously designed and validated primers were used: mGHSR: Forward 5’-ACCGTGATGGTATGGGTGTCG-3’, Reverse 5’-CACAGTGAGGCAGAAGACCG-3’ (Chuang et al., 2011a); eGFP: Forward 5’-ATCATGGCCGACAAGCAGAAGAAC-3’, Reverse 5’-GTACAGCTCGTCCATGCCGAGAGT (Godbey et al., 2008); Cyclophilin: Forward 5-TGGAGAGCACCAAGACAGACA-3’, Reverse 5’-TGCCGGAGTCGACAATGAT-3’ (Sakata et al., 2009).
Results
Examination and analysis for the labeling for GHSR-1a mRNA and eGFP in whole brain
Coronal sections of the whole brain from the level of olfactory bulb to the cervical spinal cord were examined first for endogenous eGFP fluorescence (Figure 1) and then for immunoreactivity (IR) to eGFP, labeled brown with DAB (Figure 2). The dual ISHH-IHC validation experiments used the latter method rather than the former due to quenching of the endogenous fluorescence signal in the course of the dual-label method. For dual ISHH-IHC, eGFP was labeled brown with DAB and hybridization for GHSR mRNA was demonstrated by deposition of silver granules (white dots in dark field and black dots in bright field) in the reporter mouse brain sections (Figure 4). The patterns of eGFP fluorescence (Figure 1) and eGFP-IR (Figure 2) were comparable (Figure 3), as were the patterns of eGFP-IR when determined alone (Figure 2) or together with ISHH (Figure 4). There was however, slightly less intense eGFP-IR labeling when performed together with ISHH. Immunoreactivity to eGFP was graded based on the relative number of immunoreactive cell bodies within the brain region. GHSR mRNA expression was estimated based on the density of silver granule deposition. Both immunoreactivity and in situ signals were graded qualitatively as highest, high, moderate and low-grade change from the background. Abbreviations used in the text and in the figures are denoted in Table 2. Nomenclature used for describing the various nuclei of the brain mostly follows the mouse brain atlas of Paxinos and Franklin (Paxinos and Franklin, 2004).
Figure 4.
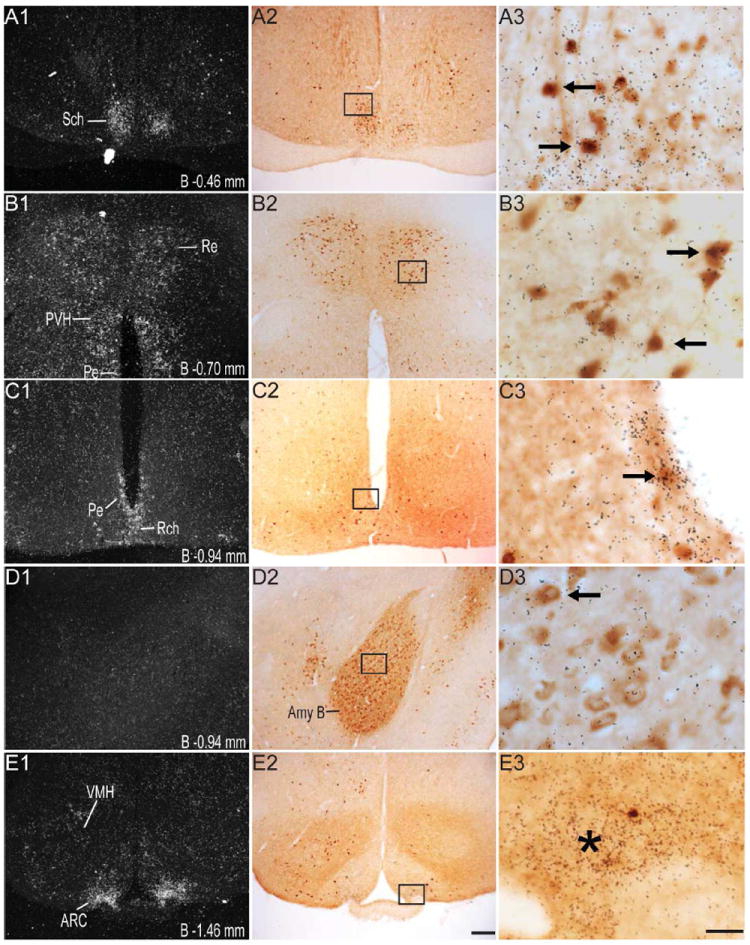
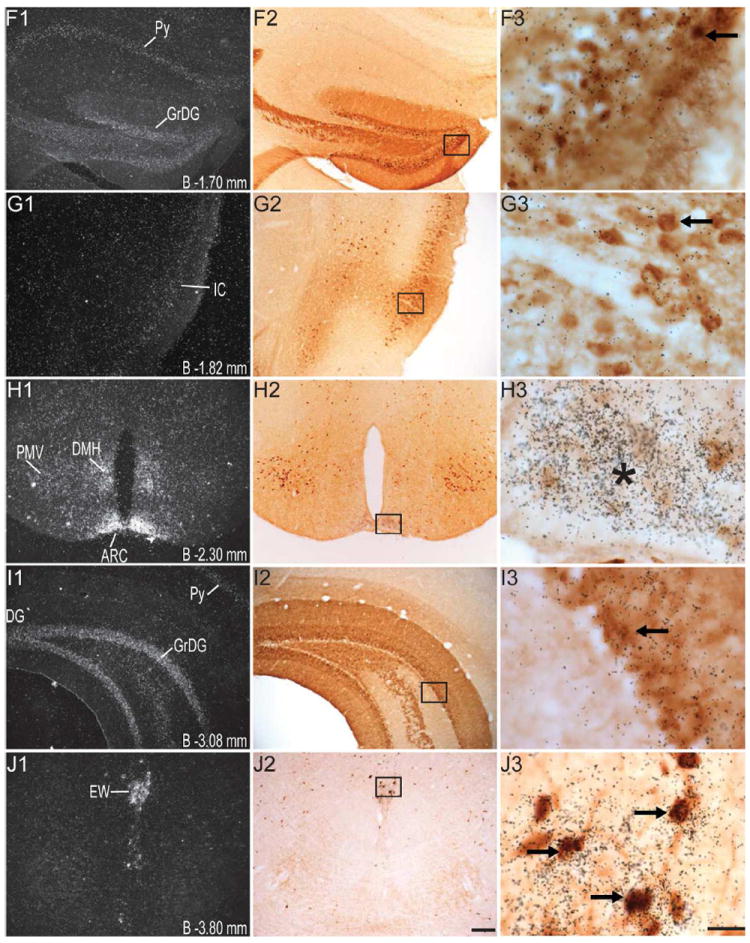
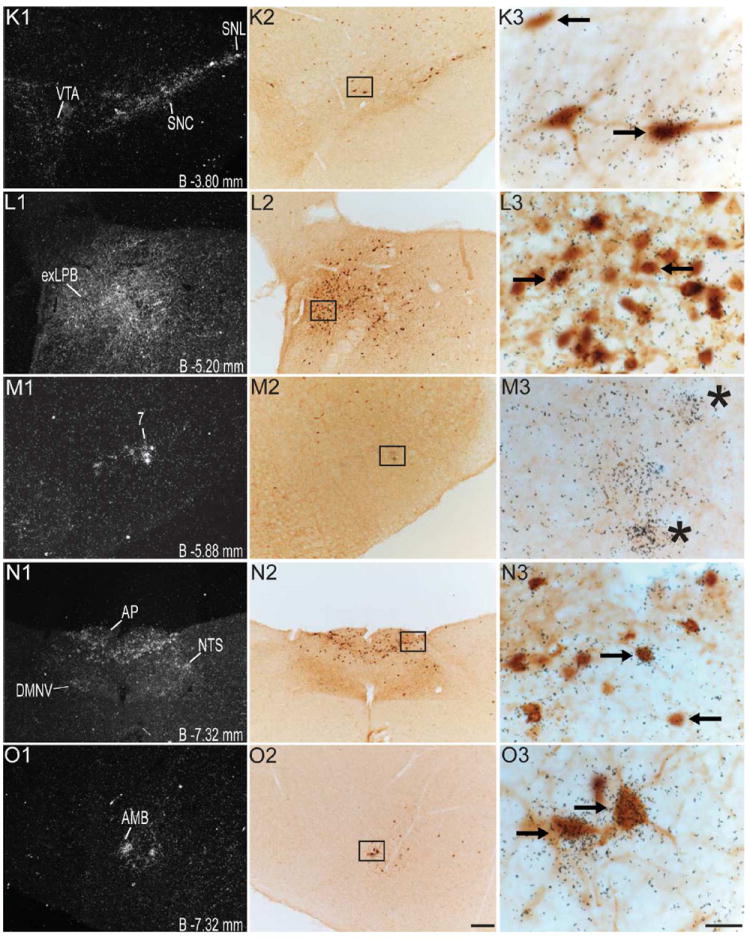
Series of high-power dark-field (left panel; indicated by the number “1”) and bright-field (middle panel; indicated by the number “2”) representative photomicrographs showing labeling for GHSR-1a mRNA and eGFP, respectively, in the same coronal sections (indicated by the same alphabetical letters and arranged in the same row) of the GHSR-eGFP mouse brain. Photomicrographs in the right panel (indicated by the number “3”) show the magnified bright-field images of the boxed areas in the middle panel in the same row, demonstrating co-localization of eGFP-immunoreactivity (indicated by brown color) with GHSR-1a mRNA (indicated by overlaying black silver granules). These photomicrographs focus on the overlaying silver granules and therefore, the eGFP-immunolabel in the background is out of optimal focus. Right facing black arrows indicate examples of neuronal cell bodies doubly labeled with eGFP and GHSR-1a mRNA. Left facing arrows indicate examples of neuronal cell bodies labeled with eGFP, but absence of significant labeling for GHSR-1a mRNA. Asterisks indicate brain regions with no appreciable labeling for eGFP, but significant labeling for GHSR-1a mRNA. Scale bars = 100 μm in E2, J2, O2 applies to all of the left panels and middle panels; Scale bars = 20 μm in E3, J3, O3 applies to all the photomicrographs in the right panels. Distance of the coronal section from bregma (B) is indicated in each photomicrograph. GrDG- Granular layer of Dentate Gyrus, Py- Pyrimidal layer of hippocampus. See Table 2 for explanation of other abbreviations.
Table 2.
Histologic determination of GHSR-1a mRNA expression and eGFP-immunoreactivity within the brains of GHSR-eGFP mice
| Region of the brain1 | Corresponding Figure(s) | eGFP2 | eGFP-IR3 | GHSR-1a mRNA3 | % of eGFP-IR cells co-expressing GHSR4 |
|---|---|---|---|---|---|
| Olfactory Bulb – Olf | 1A, 2A | ++ | ++ | - | NA |
| Neocortex | |||||
| Prelimbic Cortex – PrL | 2A | ++ | ++ | - | NA |
| Cingulate Cortex – Cg | 1B, 2B | ++ | ++ | - | NA |
| Insular Cortex – IC | 1C, 2C, 4G1 | +++ | +++ | +/- | NA |
| Ectorhinal Cortex – Ect | 2H | ++ | ++ | +/- | NA |
| Piriform Cortex – Pir | 2H, 2N | ++ | ++ | +/- | NA |
| Hippocampus | |||||
| Ammon’s Horn, CA1 | 2I | - | - | - | NA |
| Ammon’s Horn, CA2 | 2I | + | + | +/- | NA |
| Ammon’s Horn, CA3 | 2I | +++ | +++ | +/- | NA |
| Dentate Gyrus | 1H, 1L, 2G, 2I, 2N, 3A, 3B, 4F1, 4I1 | ++++ | ++++ | +/- | NA |
| Subiculum | 2N | - | - | - | NA |
| Basal Ganglia and Septum | |||||
| Basolateral Amygdaloid nucleus – Amy B | 1J, 2H, 4D2 | +++ | +++ | - | NA |
| Cortical Amygdaloid nucleus– Amy C | 2H | + | + | - | NA |
| Medial Amygdaloid nucleus – Amy M | 2H | ++ | ++ | - | NA |
| Medial Globus pallidus – MGP | 1I, 2H | ++ | ++ | +/- | 22.6 ± 7.3 |
| Hypothalamus | |||||
| Anterior Hypothalamic Area – AHA | 2E | + | + | + | NA |
| Arcuate Nucelus – ARC | 1K, 1M, 2J, 2K, 2L, 3C, 3D, 4E1, 4H1 | +/- | +/- | ++++ | 91.7 ± 4.8 |
| Dorsomedial nucleus – DMH | 2J, 4H1 | + | + | + | NA |
| Paraventricular nucleus – PVH | 4B1 | - | - | + | NA |
| Periventricular hypothalamic Nucleus – Pe | 1G, 4B1, 4C1 | +/- | +/- | + | NA |
| Premamillary Nucleus, Ventral – PMV | 1O, 2L, 4H1 | ++ | ++ | + | 17.6 ± 2.4 |
| Retrochiasmatic area – Rch | 4C1 | +/- | +/- | + | NA |
| Suprachiasmatic nucleus, Dorsomedial – Sch | 1E, 2F, 4A1 | +/- | +/- | ++ | NA |
| Ventromedial nucleus – VMH | 1N, 2J, 2K, 4E1 | ++ | ++ | + | 14.2 ± 4.2 |
| Midbrain, Pons and Medulla Oblongata | |||||
| Area Prostema – AP | 1V, 1W, 2U, 3E, 3F, 4N1 | +++ | +++ | ++ | 64.9 ± 4.8 |
| Dorsal motor nucleus of the vagus – DMNV | 2U, 4N1 | + | + | ++ | 65.6 ± 8.7 |
| Edinger Westphal Nucleus – EW | 1R, 2M, 2N, 4J1 | ++++ | ++++ | ++++ | 100.0 ± 0.0 |
| Facial Motor Nucleus – 7 | 4M1 | - | - | +++ | NA |
| Lateral parabrachial nucleus, external – exLPB | 1S, 2P, 2Q, 4L1 | +++ | +++ | ++ | 67.6 ± 12.2 |
| Medial parabrachial nucleus – MPB | 2Q | ++ | ++ | +/- | NA |
| Nucleus ambiguous – Amb | 1X, 2U, 4O1 | ++ | ++ | ++ | 93.9 ± 6.1 |
| Nucleus of the solitary tract – NTS | 1W, 2S, 2T, 2U, 3E, 3F, 4N1 | + | + | ++ | 46.0 ± 6.5 |
| Pedunculopontine tegmental nucleus – PPT | 2O | ++ | ++ | + | 34.1 ± 6.5 |
| Periaqueductal gray – PAG | 2O | + | + | - | NA |
| Raphe magnus nucleus – RMg | 1T, 2R | + | + | + | 46.3 ± 18.4 |
| Retrorubral field – RRF | 1P, 2M, 2N | ++ | ++ | ++ | 19.2 ± 4.2 |
| Reuniens thalamic nucleus – Re | 1F, 2F, 2G, 4B1 | +++ | +++ | + | 5.2 ± 1.8 |
| Substantia nigra, pars compacta – SNC | 1Q, 2N, 4K1 | +/- | +/- | ++ | 67.9 ± 6.6 |
| Substantia nigra, pars lateralis – SNL | 2N, 4K1 | +/- | +/- | ++ | 67.0 ± 10.4 |
| Superior salivatory nucleus – SuS | 2R | +/- | +/- | + | NA |
| Tegmental Area – Tg | 2O | +/- | +/- | - | NA |
| Ventral tegmental area – VTA | 2N, 4K1 | +/- | +/- | ++ | NA |
| Cerebellum | |||||
| Cerebellar nucleus, interposed – ICb | 1U, 2S | ++ | ++ | - | NA |
| Cerebellar nucleus, Medial – MCb | 2S | ++ | ++ | - | NA |
| Vestibulocerebellar nucleus – VeCb | 1U, 2S | ++ | ++ | - | NA |
Only areas demonstrating GHSR in situ signal and/or eGFP fluorescence are listed.
Endogenous eGFP fluorescence was estimated qualitatively based on number of labeled cells: ++++, highest density; +++, high density; ++, moderate density; +, low density; +/-, inconsistent labeling, -, background density.
Expression of eGFP-IR and GHSR mRNA were estimated qualitatively based both number of labeled cells and signal strength: ++++, highest density; +++, high density; ++, moderate density; +, low density; +/-, inconsistent labeling, -, background density.
The percentage of eGFP-IR neurons co-expressing GHSR mRNA was determined at all positive levels through the brain for each nucleus. Criteria for co-localization are described in materials and methods. The data are reported as the mean percentage ± SEM for three different brains. NA, No co-localization observed. IR, immunoreactivity or immunoreactive.
Of note, expression of GHSR mRNA observed in the present study is largely in agreement with GHSR mRNA expression in the mouse brain reported previously (Chuang et al., 2011a; Perello et al., 2012; Zigman et al., 2006). The in situ GHSR signal strength in a few nuclei, including the dorsal tegmental nucleus (DTg), magnocellular nucleus of the posterior commissure (MCPC) and superior salivatory nucleus (Sus), was slightly less prominent in the present study when compared to the GHSR signal strength observed previously (Zigman et al., 2006). This may be the result of reduced sensitivity that often accompanies dual label ISHH/IHC studies, when compared to doing ISHH alone, as well as to a slightly different GHSR riboprobe.
Olfactory Bulb and Neocortex
Immunohistochemistry showed significant labeling for eGFP in the cell bodies present in the olfactory bulb, specifically in the glomerular and mitral layers (Figure 2A). However, no hybridization signal was observed for GHSR mRNA in the olfactory bulb. Cell bodies within the prelimbic cortex (Figure 2A) and cingulate cortex (Figure 2B) demonstrated significant expression of eGFP. However, these latter areas did not demonstrate significant hybridization for the GHSR mRNA and no co-localization was observed with eGFP expression. More caudally in the cerebral cortex, both the granular and dysgranular areas of the insular cortex (Figure 2C), ectorhinal cortex (Figure 2H) and piriform cortex (Figure 2H, 2N) also showed distinct expression of eGFP, with very weak or no hybridization observed for GHSR mRNA in these cortical regions.
Hippocampus
The CA2 and CA3 fields of Ammon’s horn and the dentate gyrus demonstrated significant eGFP expression (Figure 2G, 2I and 2N), whereas none was observed in the CA1 field of Ammon’s horn (Figure 2I). eGFP expression in the CA2 and CA3 regions was predominantly localized to nerve fibers rather than to cell bodies. Expression of eGFP was very strong in the dentate gyrus (DG), particularly within the cell bodies of the granular layer (GrDG) (Figure 2G, 2I, 2N and 3B). The intensity of immunoreactivity to eGFP was more prominent in the ventral DG as compared to the dorsal DG (Figure 2I and 2N). Weak hybridization for GHSR mRNA was observed in the hippocampus and DG (Figure 4F1, 4I1). The intensity of hybridization in the hippocampus was variable, but the conclusion after analyzing all the sections from all cases was that there was significant hybridization within the granular layer of the dentate gyrus and the pyramidal cell layer (Py) of the hippocampus (Figure 4F1, 4I1). While both eGFP and GHSR mRNA expression was higher in the granular DG, co-localization was difficult to determine because of the inability to demarcate the densely packed immunolabeled cell bodies and because of a relatively sparse silver granule deposition. Labeling for GHSR mRNA was inconsistent and when present co-localization with eGFP was poor. The subiculum (S) lacked significant labeling for both eGFP and GHSR mRNA.
Amygdala, Basal Ganglia and Septum
Robust eGFP-IR was observed in the amygdala (Figure 2H). It was most intense in the basolateral amygdaloid nucleus, followed by the medial amygdaloid nucleus and then the cortical amygdaloid nucleus. The central amygdaloid nucleus did not show appreciable eGFP expression (Figure 2H). No significant hybridization for GHSR mRNA or co-localization with eGFP was observed in the basolateral amygdala (Figure 4D1, 4D3) or elsewhere in the amygdaloid nucleus. Cell bodies within the medial globus pallidus showed significant expression of eGFP (Figure 2H). Of the eGFP positive cell bodies in the medial globus pallidus, 23% of them showed co-localization with GHSR mRNA expression. No eGFP expression or hybridization for GHSR mRNA was observed in the horizontal and the vertical limbs of the diagonal band or the caudate putamen.
Hypothalamus
Several nuclei within the hypothalamus showed strong hybridization to GHSR mRNA. A very dense signal was observed in the arcuate nucleus (ARC) from the level of 1.34 mm to 2.54 mm caudal to bregma. Nevertheless, the ARC showed no or only faint immunoreactivity to eGFP (Figure 2J, 2K, 2L, 3D, 4E2 and 4H2). The very few cells that expressed eGFP, however, showed good co-localization with GHSR mRNA, when quantified at the level of approximately 1.8 mm caudal to bregma. Cell bodies within the other regions of the hypothalamus that showed significant eGFP expression included the anteroventral periventricular nucleus (AVPe), anterior hypothalamic area (AHA) and dorsomedial hypothalamus (DMH) (Figure 2D, 2E, and 2J). eGFP expression was poor and inconsistent within the neurons of suprachiasmatic nucleus (Sch), periventricular hypothalamic nucleus (Pe) and retrochiasmatic area (Rch) (Figure 2F, 4A2, 4B2 and 4C2). Few cell bodies within the ventromedial nuclei of hypothalamus (VMH) expressed eGFP, although eGFP expression within nerve fibers localized to the capsule of the VMH and ventrolateral aspect of the VMH was observed (Figure 2J, 2K and 4E2). Neurons within the PMV demonstrated significant immunoreactivity to eGFP (Figure 2L, 4H2). Low density GHSR signal was observed in all of the above-mentioned extra-arcuate hypothalamic regions (Figure 4A1, 4B1, 4C1, 4E1 and 4H1), but co-localization with the eGFP expression was generally poor (< 20%; see Figure 4 and Table 2). No appreciable labeling for eGFP was observed in the paraventricular nucleus of hypothalamus (PVH; Figure 4B2).
Midbrain and Brainstem
Several nuclei within the midbrain and brainstem contained both eGFP (Figure 2M -2U) and GHSR mRNA expression (Figure 4J-O). These two signals were mostly overlapping, and in general, co-localization was highest within these nuclei as compared to other brain regions (Figure 4J3, 4K3, 4L3, 4M3, 4N3 and 4O3). Neurons within the Edinger-Westphal (EW) nucleus in the midbrain had the most intense immunoreactivity for eGFP expression (Figures 2M and 2N) and demonstrated 100% co-localization with GHSR mRNA expression (Figure 4J3). In contrast, the compact and lateral regions of the substantia nigra (SNC and SNL) and the ventral tegmental area (VTA) showed significant GHSR mRNA expression, although this mostly was not co-localized with eGFP-IR (Figure 2M, 2N and 4K3). The few cells within the SNC and SNL with eGFP-IR did, however, show a moderate level of co-localization with GHSR mRNA (Figure 4K3). The lateral parabrachial nucleus demonstrated high expression of both the eGFP and GHSR mRNA signals (Figure 2P, 2Q, 4L1 and 4L2). Despite the high expression of both eGFP and GHSR mRNA, only 68% of the eGFP-expressing neurons in the lateral parabrachial nucleus co-localized with signal for GHSR mRNA (Figure 4L3). The medial parabrachial nucleus demonstrated moderate eGFP expression, but poor GHSR1a mRNA signal (Figure 2Q). The dorsal raphe nucleus did not show significantly demonstrable eGFP-IR. A robust signal for GHSR mRNA was observed over the facial motor nucleus, but no eGFP-IR was observed (Figure 4M1, 4M2 and 4M3). Other regions of the brainstem expressing eGFP included the superior salivatory nucleus (SuS), retrorubral field (RRF), pedunclopontine tegmental nucleus (PPT) and raphe magnus nucleus (RMg) (Figure 2M, 2N, 2O and 2R). Cell bodies with eGFP-IR showed moderate co-localization with GHSR mRNA in this latter set of regions (Table 2). A scattered distribution of eGFP-immunoreactive cells was also observed in the tegmental area (Tg) and periaqueductal gray (PAG) (Figure 2O). The percentage of neurons showing high co-localization included all three regions of the dorsal vagal complex [area prostema (AP), nucleus of the solitary tract (NTS), dorsal motor nucleus of the vagus (DMNV)] and the nucleus ambiguus (AMB) in the hindbrain. Within the AP, expression of eGFP was prominent along the ventral rim, resembling the letter “V” (Figure 2U, 3F and 4N2). The number of DMNV cells expressing eGFP was very low (Figure 2U and 4N2).
Cerebellum and cervical spinal cord
Immunoreactivity to eGFP was also observed in cerebellar nuclei, particularly the median, interposed and the vestibulocerebellar regions (Figure 2S). Nevertheless, no GHSR mRNA signal was observed in the cerebellum. A few discrete cells within the ventral horn of the cervical spinal cord demonstrated eGFP-IR (Figure 2V), although no appreciable GHSR mRNA signal was observed.
Further analyses of eGFP-positive hippocampal neurons
Several regions in the brain including certain regions of the hippocampus, amygdala, olfactory bulb and cortex showed robust expression of eGFP but no detectable GHSR mRNA hybridization signal above background (Figure 4; Table 2). From those sites, we chose the hippocampus to further test the validity of eGFP expression, using both quantitative RT-PCR and electrophysiology. GHSR mRNA expression, as assessed using quantitative RT-PCR, was determined in FACS-separated hippocampal cells. eGFP-enriched cell pools demonstrated a 3.3-fold enhancement of GHSR mRNA expression as compared to eGFP-negative pools (Figure 5). Furthermore, we assessed GHSR-dependent ghrelin suppression of Kv7 currents in eGFP-positive and eGFP-negative cells isolated and cultured from embryonically-derived hippocampi. Of the cells tested, 8 out of 8 eGFP-positive cells responded to ghrelin (500 nM), but only 1 out of 13 eGFP-negative cells responded to ghrelin (Figure 6). The mean current densities before and after addition of ghrelin were 60.2 ± 14.6 pA and 28.8 ± 6.2 pA respectively in eGFP-positive cells and 60.2 ± 13.5 pA and 50.6 ± 7.0 pA respectively in eGFP-negative cells.
Figure 5. Expression of GHSR mRNA within FACS-separated eGFP-enriched and eGFP-negative hippocampal neurons.
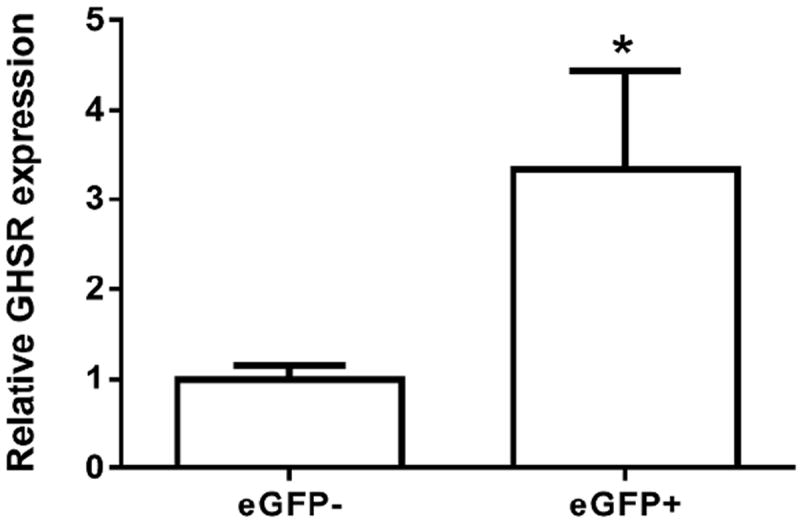
Relative GHSR mRNA expression in the FACS-separated pools was determined by qRT-PCR, normalized to expression of the housekeeping gene cyclophilin and mathematically adjusted to the lowest expressed level, set as one (ΔΔCT method). Values are expressed as mean ± S.E, n=4 independent experiments. *p<0.05, significant change in GHSR mRNA expression. Data was analyzed by student’s “t” test.
Figure 6. Effect of ghrelin on Kv7 currents in eGFP-expressing cultured embryonic hippocampal neurons.
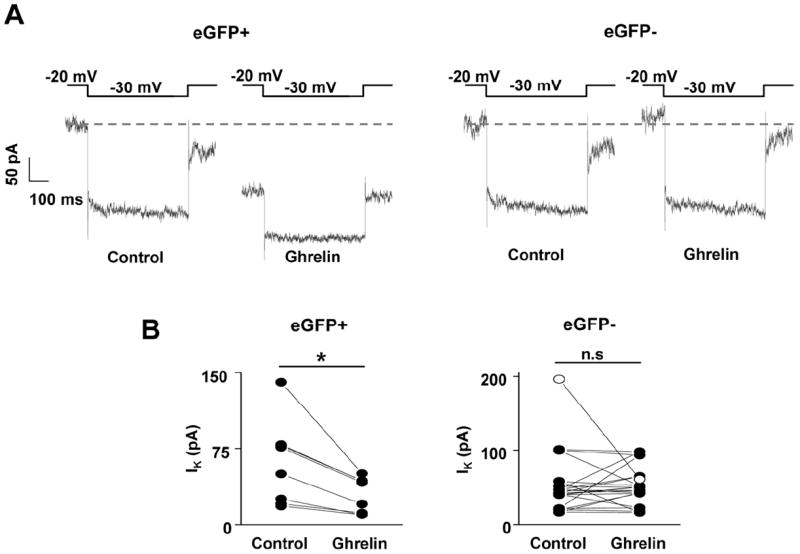
A. Representative current traces measured using deactivation voltage protocol in cultured hippocampal eGFP-positive (left panel) or eGFP-negative (right panel) cells, before (control) and after application of 500 nM ghrelin. Grey dashed line indicates the current measured at -20 mV holding voltage before application of ghrelin. B. Kv7 current (IK) amplitude before (control) and after application of ghrelin in eGFP-positive (left panel; n=8) or eGFP-negative (right panel; n=13) cells (line with open circle represents the only eGFP-negative cell that responded to ghrelin). Values are expressed as mean ± SEM. *P<0.01, significant change in current amplitude. n.s; not significant. Data was analyzed by student’s “t” test.
Discussion
Although GHSR expression has been studied in several species including mice, rat, rhesus monkey, and lemurs (Bennett et al., 1997; Bron et al., 2013; Guan et al., 1997; Howard et al., 1996; Kamegai et al., 1999; Mitchell et al., 2001; Sun et al., 2007; Tong et al., 2011; Zigman et al., 2006), mouse models are becoming the mainstay due to ease of use and versatility for transgenic approaches. In the present study, we comprehensively examined the validity of eGFP expression as a reporter for GHSR expression in the brains of a transgenic GHSR-eGFP reporter line. This was accomplished by performing detailed dual label histochemistry studies, determining the co-localization of GHSR type 1a mRNA expression within eGFP-expressing cells of the brain. A closer examination of eGFP cells was performed in the hippocampus, using quantitative PCR and electrophysiology. In general, we found eGFP expression to be somewhat variable as compared to GHSR mRNA expression as determined by ISHH. As will be discussed below, eGFP expression seemed to faithfully mark most GHSR-expressing cells in the brainstem. In certain other areas including the hippocampus, the eGFP signal seemed more sensitive than GHSR mRNA signal in detecting GHSR-expressing neurons. On the other end of the spectrum, GHSR expressing neurons throughout the hypothalamus and in certain midbrain nuclei were mostly underrepresented by eGFP expression.
To our knowledge, two other GHSR reporter mouse models have been reported previously. One is a GHSR-knockout mouse model in which the GHSR coding region was replaced by the lacZ coding sequence, resulting in β-galactosidase expression in the place of GHSR expression (Diano et al., 2006; Rediger et al., 2011; Tong et al., 2011). Thus, β-galactosidase-IR or β-galactosidase-catalyzed cleavage of X-gal, which results in blue coloration, report on the location of cells that would otherwise normally express GHSRs. A disadvantage of the GHSR-knockout mouse as a reporter is that the cells of interest would not be viable after the processing needed for histochemial detection, nor would they contain GHSRs. Another knock-in reporter mouse, generated by integrating IRES-tauGFP in to the Ghsr gene, has also been reported (Jiang et al., 2006). While expression of the reporter genes in these two models has been discussed for a few brain regions (as discussed below), comprehensive characterizations of these models have yet to be published.
The GHSR-eGFP reporter mouse model utilized in the present study mimics GHSR mRNA expression as determined by ISHH in several nuclei within the brainstem including the dorsal motor nucleus of the vagus, lateral parabrachial nucleus, Edinger-Westphal nucleus and nucleus ambiguus (Figure 4). The expression of eGFP in these regions is in agreement with the GHSR expression reported in previous studies (Perello et al., 2012; Scott et al., 2012; Zigman et al., 2006). Thus, within those brainstem nuclei, the GHSR-eGFP model faithfully reports GHSR expression. However, some midbrain regions including the VTA, and facial motor nucleus did not show appreciable eGFP expression, in contrast to the notable GHSR mRNA expression observed in the present (Figure 4) and previous studies (Chuang et al., 2011a; Perello et al., 2012; Scott et al., 2012; Zigman et al., 2006).
Neither the present study (Figure 4) nor previous studies (Guan et al., 1997; Zigman et al., 2006) that utilized in situ hybridization with radiolabeled probes detected expression of GHSR mRNA in the olfactory bulb, cortex and the amygdala. However, the present study observed significant expression of eGFP protein in these brain regions, which is similar to the GHSR expression pattern detected in a recent mouse study with binding of biotin-labeled ghrelin (Tong et al., 2011). Another recent study demonstrated very dense GHSR mRNA expression using in situ hybridization in the ventrolateral and ventromedial amygdala of rat brain (Alvarez-Crespo et al., 2012). The same authors also demonstrated that ghrelin suppresses excitatory post-synaptic potentials in the large pyramidal-like cells within the amygdala. Similarly, GHSR mRNA expression and/or function has been shown in basolateral nuclei of mouse amygdala (Walker et al., 2012) and central nuclei of rat amygdala (Cruz et al., 2013; Landgren et al., 2011). Examination of the brain sections from Ghsr-IRES-tauGFP reporter mice also observed GFP reporter fluorescence in the amygdala, entorhinal cortex and olfactory tubercle (Jiang et al., 2006). Taken together, these observations suggest that eGFP expression in some brain regions of GHSR-eGFP mice, including the amygdala, olfactory bulb and certain cortical regions (Figure 1; Figure 2), where no obvious GHSR mRNA expression was observed using ISHH, likely accurately represents GHSR expression.
There are several possible explanations for the observation in certain brain regions of eGFP signal without corresponding GHSR mRNA signal. As mentioned, ISHH using radiolabeled riboprobes can be less sensitive, especially when used in dual-label studies. Another possible explanation for the efficient detection of eGFP, but not GHSR mRNA, in these brain regions could be the longer half-life of eGFP (>24 hours) within the cell (Corish and Tyler-Smith, 1999; Li et al., 1998) compared to the less stable, shorter-lived GHSR mRNA, with a half-life of 8 hours (Kamegai et al., 2001). Also of note, transgenic mouse models often contain multiple copies of the transgene (Gong et al., 2003), which could contribute stronger immunoreactive signals for eGFP. Therefore, although not previously nor routinely appreciated using other methods, the eGFP signal in the GHSR-eGFP mouse does appear to more sensitively report on the location of GHSR-expressing neurons in several forebrain regions. This conclusion is further supported by the high relative quantitative RT-PCR-determined GHSR mRNA expression (Figure 5) and responsiveness to ghrelin determined by electrophysiology (Figure 6) in eGFP-enriched hippocampal cells compared to eGFP-negative hippocampal cells. Electrophysiological responsiveness to ghrelin in hippocampal neurons is dependent on GHSR expression as recently observed in neurons from hippocampus, substantia nigra and dorsal root ganglia (Shi et al., 2013). The higher intensity of eGFP labeling in the ventral DG compared to the dorsal DG also parallels the higher GHSR mRNA expression detected by quantitative RT-PCR in the ventral DG compared to the dorsal DG (Walker et al., 2014).
A major limitation in the utility of these reporter mice is their markedly reduced eGFP expression within certain areas of known GHSR expression, most notably the hypothalamus, including the ARC, Sch, VMH, DMH and the PMV (Figure 4). Indeed, there is almost no immunoreactivity to eGFP in the ARC, where the silver granule deposition is perhaps the densest (Figure 4E1 and 4H1). The number of eGFP-immunoreactive cells detected in the ARC represents only a small fraction of those ARC neurons reported to respond to stimulation of GHSR by enhanced expression of c-fos (Dickson and Luckman, 1997; Nakazato et al., 2001; Scott et al., 2012). Therefore, we conclude that eGFP expression underrepresents GHSR expression in the ARC and other hypothalamic regions.
The observed poor eGFP expression in these brain regions is a known potential limitation of transgenic reporter mice generated by non-site specific insertion of the reporter construct in to the mouse genome. In this case, the transgenic targeting construct used to generate the GHSR-eGFP line included the eGFP coding sequence flanked by at least 100 kb sequence both upstream and downstream of the GHSR translational start codon. Thus, the targeting construct theoretically contained sufficient GHSR regulatory sequence to preserve the promoter specificity. However, the random insertion process, the inclusion of other potential genes or unrelated regulatory elements within the BAC construct, and the potential presence of multiple copies of the inserted transgene and a resultant overexpression of unintended genes within the BAC nonetheless can still potentially change the expected transcriptional regulation of the transgene (Matthaei, 2007; Yang and Gong, 2005).
Another inherent constraint associated with eGFP reporter mice involves potential differences in intracellular targeting of the native mRNA and/or translated protein vs that of eGFP. The targeted trafficking and redistribution of certain mRNA species to specialized structures of neurons such as dentritic spines as opposed to the soma, enables local on-demand protein synthesis and supports processes specific to those structures. e.g. development of synaptic plasticity (Goldie and Cairns, 2012; Kelly and Grote, 1993). Contrarily, the reporter eGFP protein is soluble, non-targeted and therefore distributed throughout the entire neuron. While this may be advantageous in certain settings, for instance neuronal tracing studies (Feng et al., 2000), the diffuse distribution of the eGFP protein within the neuron could contribute to some of the mismatch observed when comparing the distributions of GHSR mRNA and eGFP expression. These drawbacks highlight the importance of careful characterization of reporter models. Of note, this GHSR-eGFP mouse model has already been used in a few studies investigating GHSR-expressing cells. Using expression of eGFP as a marker, GHSR expression has been reported in the lateral mammillary nucleus of the hypothalamus (Callaghan et al., 2012), AVPe (Smith et al., 2013), intermediolateral cell nucleus (IML) of the lumbar spinal cord (Furness et al., 2011) and distal tubules of nephron (Callaghan et al., 2012; Venables et al., 2011). In the AVPe, 44% of the eGFP-expressing cells co-labeled with GHSR mRNA (Smith et al., 2013). While Venables et al. did not report direct co-localization of eGFP with GHSR mRNA, they demonstrated that the expression of eGFP protein was similar to the pattern of GHSR mRNA distribution in the distal tubules (Venables et al., 2011). Given the shortcomings of the GHSR-eGFP model to report GHSR expression in several regions of the brain, as described in the current report, it likely would be prudent to also validate the model in areas outside the brain.
In conclusion, the GHSR-eGFP mouse model faithfully reflects GHSR expression in several nuclei within the brainstem. A major constraint in the utility of the reporter mice is its poor representation of GHSR expression within the hypothalamus. Expression of eGFP observed in the hippocampus, amygdala, olfactory bulb, and some cortical areas seems to represent regions with low GHSR expression, previously not demonstrable using traditional in situ hybridization techniques. Thus, although the GHSR-eGFP mouse line is not a perfect reporter, the detailed validation reported here should instill confidence in future investigations that aim to use the eGFP signal to mark the location of GHSR expressing neurons in many important CNS sites.
Acknowledgments
The authors would like to thank Sherri Osborne-Lawrence and Chelsea Migura for their excellent technical assistance as well as the FACS Core Facility at the University of Texas Southwestern Medical Center and the Cell Culture Core Facility at the Multidisciplinary Institute of Cell Biology at Buenos Aires.
Financial Support:
We would like to acknowledge the financial support from the NIH (R01DA024680 and R01MH085298 to JMZ; T32DA7290 to AKW; R03TW008925 to JMZ and MP), the NHMRC, (1030337 to ZBA and JMZ), the Hilda and Preston Davis Foundation Postdoctoral Fellowship in Eating Disorders Research to BKM and the National Agency of Scientific and Technological Promotion of Argentina (PICT2010-1954 and PICT2011-2142 to MP and PICT2010-1589 and PICT2011-1816 to JR).
Footnotes
Role of Authors
Study Concept and Design: JMZ, BKM, MP, JR
Acquisition of Data: BKM, AKW, EJLS, CEL
Analysis and interpretation of data: BKM, AKW, EJLS, JR, MP, JMZ
Drafting of the manuscript: BKM, AKW, JR, MP, JMZ
Critical revision of the manuscript for important intellectual content: JMZ, ZBA, MP
Statistical analysis: BKM, AKW, EJLS
Obtained funding: JMZ, BKM, AKW, ZBA, MP, JR
Study supervision: JMZ
Conflict of Interest:
The authors report no conflict of interest.
References
- Alvarez-Crespo M, Skibicka KP, Farkas I, Molnar CS, Egecioglu E, Hrabovszky E, Liposits Z, Dickson SL. The amygdala as a neurobiological target for ghrelin in rats: neuroanatomical, electrophysiological and behavioral evidence. PLoS One. 2012;7(10):e46321. doi: 10.1371/journal.pone.0046321. [DOI] [PMC free article] [PubMed] [Google Scholar]
- Asakawa A, Inui A, Kaga T, Yuzuriha H, Nagata T, Ueno N, Makino S, Fujimiya M, Niijima A, Fujino MA, Kasuga M. Ghrelin is an appetite-stimulatory signal from stomach with structural resemblance to motilin. Gastroenterology. 2001;120(2):337–345. doi: 10.1053/gast.2001.22158. [DOI] [PubMed] [Google Scholar]
- Baatar D, Patel K, Taub DD. The effects of ghrelin on inflammation and the immune system. Mol Cell Endocrinol. 2011;340(1):44–58. doi: 10.1016/j.mce.2011.04.019. [DOI] [PubMed] [Google Scholar]
- Bednarek MA, Feighner SD, Pong SS, McKee KK, Hreniuk DL, Silva MV, Warren VA, Howard AD, Van Der Ploeg LH, Heck JV. Structure-function studies on the new growth hormone-releasing peptide, ghrelin: minimal sequence of ghrelin necessary for activation of growth hormone secretagogue receptor 1a. J Med Chem. 2000;43(23):4370–4376. doi: 10.1021/jm0001727. [DOI] [PubMed] [Google Scholar]
- Bennett PA, Thomas GB, Howard AD, Feighner SD, van der Ploeg LH, Smith RG, Robinson IC. Hypothalamic growth hormone secretagogue-receptor (GHS-R) expression is regulated by growth hormone in the rat. Endocrinology. 1997;138(11):4552–4557. doi: 10.1210/endo.138.11.5476. [DOI] [PubMed] [Google Scholar]
- Bouabe H, Fassler R, Heesemann J. Improvement of reporter activity by IRES-mediated polycistronic reporter system. Nucleic Acids Res. 2008;36(5):e28. doi: 10.1093/nar/gkm1119. [DOI] [PMC free article] [PubMed] [Google Scholar]
- Bron R, Yin L, Russo D, Furness JB. Expression of the ghrelin receptor gene in neurons of the medulla oblongata of the rat. J Comp Neurol. 2013;521(12):2680–2702. doi: 10.1002/cne.23309. [DOI] [PubMed] [Google Scholar]
- Bronk P, Deak F, Wilson MC, Liu X, Sudhof TC, Kavalali ET. Differential effects of SNAP-25 deletion on Ca2+ -dependent and Ca2+ -independent neurotransmission. J Neurophysiol. 2007;98(2):794–806. doi: 10.1152/jn.00226.2007. [DOI] [PubMed] [Google Scholar]
- Cabral A, Fernandez G, Perello M. Analysis of brain nuclei accessible to ghrelin present in the cerebrospinal fluid. Neuroscience. 2013;253:406–415. doi: 10.1016/j.neuroscience.2013.09.008. [DOI] [PMC free article] [PubMed] [Google Scholar]
- Callaghan B, Hunne B, Hirayama H, Sartor DM, Nguyen TV, Abogadie FC, Ferens D, McIntyre P, Ban K, Baell J, Furness JB, Brock JA. Sites of action of ghrelin receptor ligands in cardiovascular control. Am J Physiol Heart Circ Physiol. 2012;303(8):H1011–1021. doi: 10.1152/ajpheart.00418.2012. [DOI] [PubMed] [Google Scholar]
- Camina JP. Cell biology of the ghrelin receptor. J Neuroendocrinol. 2006;18(1):65–76. doi: 10.1111/j.1365-2826.2005.01379.x. [DOI] [PubMed] [Google Scholar]
- Castaneda TR, Tong J, Datta R, Culler M, Tschop MH. Ghrelin in the regulation of body weight and metabolism. Front Neuroendocrinol. 2010;31(1):44–60. doi: 10.1016/j.yfrne.2009.10.008. [DOI] [PubMed] [Google Scholar]
- Chow KBS, Sun J, Man Chu K, Tai Cheung W, Cheng CHK, Wise H. The truncated ghrelin receptor polypeptide (GHS-R1b) is localized in the endoplasmic reticulum where it forms heterodimers with ghrelin receptors (GHS-R1a) to attenuate their cell surface expression. Mol Cell Endocrinol. 2012;348(1):247–254. doi: 10.1016/j.mce.2011.08.034. [DOI] [PubMed] [Google Scholar]
- Chuang JC, Perello M, Sakata I, Osborne-Lawrence S, Savitt JM, Lutter M, Zigman JM. Ghrelin mediates stress-induced food-reward behavior in mice. J Clin Invest. 2011a;121(7):2684–2692. doi: 10.1172/JCI57660. [DOI] [PMC free article] [PubMed] [Google Scholar]
- Chuang JC, Sakata I, Kohno D, Perello M, Osborne-Lawrence S, Repa JJ, Zigman JM. Ghrelin directly stimulates glucagon secretion from pancreatic alpha-cells. Mol Endocrinol. 2011b;25(9):1600–1611. doi: 10.1210/me.2011-1001. [DOI] [PMC free article] [PubMed] [Google Scholar]
- Corish P, Tyler-Smith C. Attenuation of green fluorescent protein half-life in mammalian cells. Protein Eng. 1999;12(12):1035–1040. doi: 10.1093/protein/12.12.1035. [DOI] [PubMed] [Google Scholar]
- Cruz CR, Smith RG. The growth hormone secretagogue receptor. Vitam Horm. 2008;77:47–88. doi: 10.1016/S0083-6729(06)77004-2. [DOI] [PubMed] [Google Scholar]
- Cruz MT, Herman MA, Cote DM, Ryabinin AE, Roberto M. Ghrelin increases GABAergic transmission and interacts with ethanol actions in the rat central nucleus of the amygdala. Neuropsychopharmacology. 2013;38(2):364–375. doi: 10.1038/npp.2012.190. [DOI] [PMC free article] [PubMed] [Google Scholar]
- Date Y, Kojima M, Hosoda H, Sawaguchi A, Mondal MS, Suganuma T, Matsukura S, Kangawa K, Nakazato M. Ghrelin, a novel growth hormone-releasing acylated peptide, is synthesized in a distinct endocrine cell type in the gastrointestinal tracts of rats and humans. Endocrinology. 2000;141(11):4255–4261. doi: 10.1210/endo.141.11.7757. [DOI] [PubMed] [Google Scholar]
- Delhanty PJ, van der Lely AJ. Ghrelin and glucose homeostasis. Peptides. 2011;32(11):2309–2318. doi: 10.1016/j.peptides.2011.03.001. [DOI] [PubMed] [Google Scholar]
- Diano S, Farr SA, Benoit SC, McNay EC, da Silva I, Horvath B, Gaskin FS, Nonaka N, Jaeger LB, Banks WA, Morley JE, Pinto S, Sherwin RS, Xu L, Yamada KA, Sleeman MW, Tschop MH, Horvath TL. Ghrelin controls hippocampal spine synapse density and memory performance. Nat Neurosci. 2006;9(3):381–388. doi: 10.1038/nn1656. [DOI] [PubMed] [Google Scholar]
- Dickson SL, Egecioglu E, Landgren S, Skibicka KP, Engel JA, Jerlhag E. The role of the central ghrelin system in reward from food and chemical drugs. Mol Cell Endocrinol. 2011;340(1):80–87. doi: 10.1016/j.mce.2011.02.017. [DOI] [PubMed] [Google Scholar]
- Dickson SL, Luckman SM. Induction of c-fos messenger ribonucleic acid in neuropeptide Y and growth hormone (GH)-releasing factor neurons in the rat arcuate nucleus following systemic injection of the GH secretagogue, GH-releasing peptide-6. Endocrinology. 1997;138(2):771–777. doi: 10.1210/endo.138.2.4907. [DOI] [PubMed] [Google Scholar]
- Elias CF, Lee C, Kelly J, Aschkenasi C, Ahima RS, Couceyro PR, Kuhar MJ, Saper CB, Elmquist JK. Leptin activates hypothalamic CART neurons projecting to the spinal cord. Neuron. 1998;21(6):1375–1385. doi: 10.1016/s0896-6273(00)80656-x. [DOI] [PubMed] [Google Scholar]
- Feng G, Mellor RH, Bernstein M, Keller-Peck C, Nguyen QT, Wallace M, Nerbonne JM, Lichtman JW, Sanes JR. Imaging neuronal subsets in transgenic mice expressing multiple spectral variants of GFP. Neuron. 2000;28(1):41–51. doi: 10.1016/s0896-6273(00)00084-2. [DOI] [PubMed] [Google Scholar]
- Furness JB, Hunne B, Matsuda N, Yin L, Russo D, Kato I, Fujimiya M, Patterson M, McLeod J, Andrews ZB, Bron R. Investigation of the presence of ghrelin in the central nervous system of the rat and mouse. Neuroscience. 2011;193:1–9. doi: 10.1016/j.neuroscience.2011.07.063. [DOI] [PubMed] [Google Scholar]
- Gautron L, Lee C, Funahashi H, Friedman J, Lee S, Elmquist J. Melanocortin-4 receptor expression in a vago-vagal circuitry involved in postprandial functions. J Comp Neurol. 2010;518(1):6–24. doi: 10.1002/cne.22221. [DOI] [PMC free article] [PubMed] [Google Scholar]
- Gnanapavan S, Kola B, Bustin SA, Morris DG, McGee P, Fairclough P, Bhattacharya S, Carpenter R, Grossman AB, Korbonits M. The tissue distribution of the mRNA of ghrelin and subtypes of its receptor, GHS-R, in humans. J Clin Endocrinol Metab. 2002;87(6):2988. doi: 10.1210/jcem.87.6.8739. [DOI] [PubMed] [Google Scholar]
- Godbey WT, Zhang X, Chang F. The importance of and a method for including transfection efficiency into real-time PCR data analyses. Biotechnol Bioeng. 2008;100(4):765–772. doi: 10.1002/bit.21811. [DOI] [PubMed] [Google Scholar]
- Goldie BJ, Cairns MJ. Post-transcriptional trafficking and regulation of neuronal gene expression. Mol Neurobiol. 2012;45(1):99–108. doi: 10.1007/s12035-011-8222-0. [DOI] [PMC free article] [PubMed] [Google Scholar]
- Gong S, Zheng C, Doughty ML, Losos K, Didkovsky N, Schambra UB, Nowak NJ, Joyner A, Leblanc G, Hatten ME, Heintz N. A gene expression atlas of the central nervous system based on bacterial artificial chromosomes. Nature. 2003;425(6961):917–925. doi: 10.1038/nature02033. [DOI] [PubMed] [Google Scholar]
- Guan XM, Yu H, Palyha OC, McKee KK, Feighner SD, Sirinathsinghji DJ, Smith RG, Van der Ploeg LH, Howard AD. Distribution of mRNA encoding the growth hormone secretagogue receptor in brain and peripheral tissues. Brain Res Mol Brain Res. 1997;48(1):23–29. doi: 10.1016/s0169-328x(97)00071-5. [DOI] [PubMed] [Google Scholar]
- Gutierrez JA, Solenberg PJ, Perkins DR, Willency JA, Knierman MD, Jin Z, Witcher DR, Luo S, Onyia JE, Hale JE. Ghrelin octanoylation mediated by an orphan lipid transferase. Proc Natl Acad Sci U S A. 2008;105(17):6320–6325. doi: 10.1073/pnas.0800708105. [DOI] [PMC free article] [PubMed] [Google Scholar]
- Holst B, Cygankiewicz A, Jensen TH, Ankersen M, Schwartz TW. High constitutive signaling of the ghrelin receptor--identification of a potent inverse agonist. Mol Endocrinol. 2003;17(11):2201–2210. doi: 10.1210/me.2003-0069. [DOI] [PubMed] [Google Scholar]
- Hosoda H, Kojima M, Matsuo H, Kangawa K. Ghrelin and des-acyl ghrelin: two major forms of rat ghrelin peptide in gastrointestinal tissue. Biochem Biophys Res Commun. 2000;279(3):909–913. doi: 10.1006/bbrc.2000.4039. [DOI] [PubMed] [Google Scholar]
- Howard AD, Feighner SD, Cully DF, Arena JP, Liberator PA, Rosenblum CI, Hamelin M, Hreniuk DL, Palyha OC, Anderson J, Paress PS, Diaz C, Chou M, Liu KK, McKee KK, Pong SS, Chaung LY, Elbrecht A, Dashkevicz M, Heavens R, Rigby M, Sirinathsinghji DJ, Dean DC, Melillo DG, Patchett AA, Nargund R, Griffin PR, DeMartino JA, Gupta SK, Schaeffer JM, Smith RG, Van der Ploeg LH. A receptor in pituitary and hypothalamus that functions in growth hormone release. Science. 1996;273(5277):974–977. doi: 10.1126/science.273.5277.974. [DOI] [PubMed] [Google Scholar]
- Jiang H, Betancourt L, Smith RG. Ghrelin amplifies dopamine signaling by cross talk involving formation of growth hormone secretagogue receptor/dopamine receptor subtype 1 heterodimers. Mol Endocrinol. 2006;20(8):1772–1785. doi: 10.1210/me.2005-0084. [DOI] [PubMed] [Google Scholar]
- Kamegai J, Tamura H, Ishii S, Sugihara H, Wakabayashi I. Thyroid hormones regulate pituitary growth hormone secretagogue receptor gene expression. J Neuroendocrinol. 2001;13(3):275–278. doi: 10.1046/j.1365-2826.2001.00623.x. [DOI] [PubMed] [Google Scholar]
- Kamegai J, Wakabayashi I, Kineman RD, Frohman LA. Growth hormone-releasing hormone receptor (GHRH-R) and growth hormone secretagogue receptor (GHS-R) mRNA levels during postnatal development in male and female rats. J Neuroendocrinol. 1999;11(4):299–306. doi: 10.1046/j.1365-2826.1999.00330.x. [DOI] [PubMed] [Google Scholar]
- Kelly RB, Grote E. Protein targeting in the neuron. Annu Rev Neurosci. 1993;16:95–127. doi: 10.1146/annurev.ne.16.030193.000523. [DOI] [PubMed] [Google Scholar]
- Kojima M, Hosoda H, Date Y, Nakazato M, Matsuo H, Kangawa K. Ghrelin is a growth-hormone-releasing acylated peptide from stomach. Nature. 1999;402(6762):656–660. doi: 10.1038/45230. [DOI] [PubMed] [Google Scholar]
- Landgren S, Engel JA, Hyytia P, Zetterberg H, Blennow K, Jerlhag E. Expression of the gene encoding the ghrelin receptor in rats selected for differential alcohol preference. Behav Brain Res. 2011;221(1):182–188. doi: 10.1016/j.bbr.2011.03.003. [DOI] [PubMed] [Google Scholar]
- Li X, Zhao X, Fang Y, Jiang X, Duong T, Fan C, Huang CC, Kain SR. Generation of destabilized green fluorescent protein as a transcription reporter. J Biol Chem. 1998;273(52):34970–34975. doi: 10.1074/jbc.273.52.34970. [DOI] [PubMed] [Google Scholar]
- Liu H, Kishi T, Roseberry AG, Cai X, Lee CE, Montez JM, Friedman JM, Elmquist JK. Transgenic mice expressing green fluorescent protein under the control of the melanocortin-4 receptor promoter. J Neurosci. 2003;23(18):7143–7154. doi: 10.1523/JNEUROSCI.23-18-07143.2003. [DOI] [PMC free article] [PubMed] [Google Scholar]
- Masuda Y, Tanaka T, Inomata N, Ohnuma N, Tanaka S, Itoh Z, Hosoda H, Kojima M, Kangawa K. Ghrelin stimulates gastric acid secretion and motility in rats. Biochem Biophys Res Commun. 2000;276(3):905–908. doi: 10.1006/bbrc.2000.3568. [DOI] [PubMed] [Google Scholar]
- Matthaei KI. Genetically manipulated mice: a powerful tool with unsuspected caveats. J Physiol. 2007;582(Pt 2):481–488. doi: 10.1113/jphysiol.2007.134908. [DOI] [PMC free article] [PubMed] [Google Scholar]
- McKee KK, Palyha OC, Feighner SD, Hreniuk DL, Tan CP, Phillips MS, Smith RG, Van der Ploeg LH, Howard AD. Molecular analysis of rat pituitary and hypothalamic growth hormone secretagogue receptors. Mol Endocrinol. 1997;11(4):415–423. doi: 10.1210/mend.11.4.9908. [DOI] [PubMed] [Google Scholar]
- Mitchell V, Bouret S, Beauvillain JC, Schilling A, Perret M, Kordon C, Epelbaum J. Comparative distribution of mRNA encoding the growth hormone secretagogue-receptor (GHS-R) in Microcebus murinus (Primate, lemurian) and rat forebrain and pituitary. J Comp Neurol. 2001;429(3):469–489. doi: 10.1002/1096-9861(20010115)429:3<469::aid-cne8>3.0.co;2-#. [DOI] [PubMed] [Google Scholar]
- Nakazato M, Murakami N, Date Y, Kojima M, Matsuo H, Kangawa K, Matsukura S. A role for ghrelin in the central regulation of feeding. Nature. 2001;409(6817):194–198. doi: 10.1038/35051587. [DOI] [PubMed] [Google Scholar]
- Papotti M, Ghe C, Cassoni P, Catapano F, Deghenghi R, Ghigo E, Muccioli G. Growth hormone secretagogue binding sites in peripheral human tissues. J Clin Endocrinol Metab. 2000;85(10):3803–3807. doi: 10.1210/jcem.85.10.6846. [DOI] [PubMed] [Google Scholar]
- Paxinos G, Franklin KBJ. The Mouse Brain in Stereotaxic Coordinates. Elsevier Academin Press; San Diego, CA: 2004. [Google Scholar]
- Perello M, Scott MM, Sakata I, Lee CE, Chuang JC, Osborne-Lawrence S, Rovinsky SA, Elmquist JK, Zigman JM. Functional implications of limited leptin receptor and ghrelin receptor coexpression in the brain. J Comp Neurol. 2012;520(2):281–294. doi: 10.1002/cne.22690. [DOI] [PMC free article] [PubMed] [Google Scholar]
- Petersenn S, Rasch AC, Penshorn M, Beil FU, Schulte HM. Genomic structure and transcriptional regulation of the human growth hormone secretagogue receptor. Endocrinology. 2001;142(6):2649–2659. doi: 10.1210/endo.142.6.8184. [DOI] [PubMed] [Google Scholar]
- Raingo J, Khvotchev M, Liu P, Darios F, Li YC, Ramirez DM, Adachi M, Lemieux P, Toth K, Davletov B, Kavalali ET. VAMP4 directs synaptic vesicles to a pool that selectively maintains asynchronous neurotransmission. Nat Neurosci. 2012;15(5):738–745. doi: 10.1038/nn.3067. [DOI] [PMC free article] [PubMed] [Google Scholar]
- Rediger A, Piechowski CL, Yi CX, Tarnow P, Strotmann R, Gruters A, Krude H, Schoneberg T, Tschop MH, Kleinau G, Biebermann H. Mutually opposite signal modulation by hypothalamic heterodimerization of ghrelin and melanocortin-3 receptors. J Biol Chem. 2011;286(45):39623–39631. doi: 10.1074/jbc.M111.287607. [DOI] [PMC free article] [PubMed] [Google Scholar]
- Reichenbach A, Steyn FJ, Sleeman MW, Andrews ZB. Ghrelin receptor expression and colocalization with anterior pituitary hormones using a GHSR-GFP mouse line. Endocrinology. 2012;153(11):5452–5466. doi: 10.1210/en.2012-1622. [DOI] [PubMed] [Google Scholar]
- Sakata I, Nakano Y, Osborne-Lawrence S, Rovinsky SA, Lee CE, Perello M, Anderson JG, Coppari R, Xiao G, Lowell BB, Elmquist JK, Zigman JM. Characterization of a novel ghrelin cell reporter mouse. Regul Pept. 2009;155(1-3):91–98. doi: 10.1016/j.regpep.2009.04.001. [DOI] [PMC free article] [PubMed] [Google Scholar]
- Scott MM, Perello M, Chuang JC, Sakata I, Gautron L, Lee CE, Lauzon D, Elmquist JK, Zigman JM. Hindbrain ghrelin receptor signaling is sufficient to maintain fasting glucose. PLoS One. 2012;7(8):e44089. doi: 10.1371/journal.pone.0044089. [DOI] [PMC free article] [PubMed] [Google Scholar]
- Shi L, Bian X, Qu Z, Ma Z, Zhou Y, Wang K, Jiang H, Xie J. Peptide hormone ghrelin enhances neuronal excitability by inhibition of Kv7/KCNQ channels. Nat Commun. 2013;4:1435. doi: 10.1038/ncomms2439. [DOI] [PubMed] [Google Scholar]
- Simmons DM, Arriza JL, Swanson LW. A Complete Protocol for In Situ Hybridization of Messenger RNAs in Brain and Other Tissues With Radio-labeled Single-Stranded RNA Probes. Journal of Histotechnology. 1989;12(3):169–181. [Google Scholar]
- Smith JT, Reichenbach A, Lemus M, Mani BK, Zigman JM, Andrews ZB. An eGFP-expressing subpopulation of growth hormone secretagogue receptor cells are distinct from kisspeptin, tyrosine hydroxylase, and RFamide-related peptide neurons in mice. Peptides. 2013;47:45–53. doi: 10.1016/j.peptides.2013.06.012. [DOI] [PMC free article] [PubMed] [Google Scholar]
- Spencer SJ, Xu L, Clarke MA, Lemus M, Reichenbach A, Geenen B, Kozicz T, Andrews ZB. Ghrelin regulates the hypothalamic-pituitary-adrenal axis and restricts anxiety after acute stress. Biol Psychiatry. 2012;72(6):457–465. doi: 10.1016/j.biopsych.2012.03.010. [DOI] [PubMed] [Google Scholar]
- Sun Y, Garcia JM, Smith RG. Ghrelin and growth hormone secretagogue receptor expression in mice during aging. Endocrinology. 2007;148(3):1323–1329. doi: 10.1210/en.2006-0782. [DOI] [PubMed] [Google Scholar]
- Tannenbaum GS, Lapointe M, Beaudet A, Howard AD. Expression of growth hormone secretagogue-receptors by growth hormone-releasing hormone neurons in the mediobasal hypothalamus. Endocrinology. 1998;139(10):4420–4423. doi: 10.1210/endo.139.10.6330. [DOI] [PubMed] [Google Scholar]
- Tong J, Mannea E, Aime P, Pfluger PT, Yi CX, Castaneda TR, Davis HW, Ren X, Pixley S, Benoit S, Julliard K, Woods SC, Horvath TL, Sleeman MM, D’Alessio D, Obici S, Frank R, Tschop MH. Ghrelin enhances olfactory sensitivity and exploratory sniffing in rodents and humans. J Neurosci. 2011;31(15):5841–5846. doi: 10.1523/JNEUROSCI.5680-10.2011. [DOI] [PMC free article] [PubMed] [Google Scholar]
- Ueno H, Yamaguchi H, Kangawa K, Nakazato M. Ghrelin: a gastric peptide that regulates food intake and energy homeostasis. Regul Pept. 2005;126(1-2):11–19. doi: 10.1016/j.regpep.2004.08.007. [DOI] [PubMed] [Google Scholar]
- Venables G, Hunne B, Bron R, Cho HJ, Brock JA, Furness JB. Ghrelin receptors are expressed by distal tubules of the mouse kidney. Cell Tissue Res. 2011;346(1):135–139. doi: 10.1007/s00441-011-1240-4. [DOI] [PubMed] [Google Scholar]
- Walker AK, Ibia IE, Zigman JM. Disruption of Cue-Potentiated Feeding in Mice with Blocked Ghrelin Signaling. Physiol Behav. 2012;108:34–43. doi: 10.1016/j.physbeh.2012.10.003. [DOI] [PMC free article] [PubMed] [Google Scholar]
- Walker AK, Park WM, Chuang JC, Perello M, Sakata I, Osborne-Lawrence S, Zigman JM. Characterization of gastric and neuronal histaminergic populations using a transgenic mouse model. PLoS One. 2013;8(3):e60276. doi: 10.1371/journal.pone.0060276. [DOI] [PMC free article] [PubMed] [Google Scholar]
- Walker AK, Rivera PD, Wang Q, Chuang JC, Tran S, Osborne-Lawrence S, Estill SJ, Starwalt R, Huntington P, Morlock L, Naidoo J, Williams NS, Ready JM, Eisch AJ, Pieper AA, Zigman JM. The P7C3 class of neuroprotective compounds exerts antidepressant efficacy in mice by increasing hippocampal neurogenesis. Molecular Psychiatry. 2014 doi: 10.1038/mp.2014.1034. In Press. [DOI] [PMC free article] [PubMed] [Google Scholar]
- Wang Q, Liu C, Uchida A, Chuang JC, Walker A, Liu T, Osborne-Lawrence S, Mason BL, Mosher C, Berglund ED, Elmquist JK, Zigman JM. Arcuate AgRP neurons mediate orexigenic and glucoregulatory actions of ghrelin. Mol Metab. 2014;3(1):64–72. doi: 10.1016/j.molmet.2013.10.001. [DOI] [PMC free article] [PubMed] [Google Scholar]
- Yang J, Brown MS, Liang G, Grishin NV, Goldstein JL. Identification of the acyltransferase that octanoylates ghrelin, an appetite-stimulating peptide hormone. Cell. 2008;132(3):387–396. doi: 10.1016/j.cell.2008.01.017. [DOI] [PubMed] [Google Scholar]
- Yang XW, Gong S. An overview on the generation of BAC transgenic mice for neuroscience research. Curr Protoc Neurosci. 2005;Chapter 5(Unit 5):20. doi: 10.1002/0471142301.ns0520s31. [DOI] [PubMed] [Google Scholar]
- Zhao TJ, Liang G, Li RL, Xie X, Sleeman MW, Murphy AJ, Valenzuela DM, Yancopoulos GD, Goldstein JL, Brown MS. Ghrelin O-acyltransferase (GOAT) is essential for growth hormone-mediated survival of calorie-restricted mice. Proc Natl Acad Sci U S A. 2010;107(16):7467–7472. doi: 10.1073/pnas.1002271107. [DOI] [PMC free article] [PubMed] [Google Scholar]
- Zhao Y, Flandin P, Long JE, Cuesta MD, Westphal H, Rubenstein JL. Distinct molecular pathways for development of telencephalic interneuron subtypes revealed through analysis of Lhx6 mutants. J Comp Neurol. 2008;510(1):79–99. doi: 10.1002/cne.21772. [DOI] [PMC free article] [PubMed] [Google Scholar]
- Zigman JM, Jones JE, Lee CE, Saper CB, Elmquist JK. Expression of ghrelin receptor mRNA in the rat and the mouse brain. J Comp Neurol. 2006;494(3):528–548. doi: 10.1002/cne.20823. [DOI] [PMC free article] [PubMed] [Google Scholar]