

Unlike globular proteins with stable native structures, peptides in solution, partially folded proteins and natively unfolded proteins are best characterized as conformational ensembles of rapidly interconverting structures. Structural characterization of these dynamic systems is critical to understanding principles of protein folding, and to understanding the basis of protein misfolding that results in protein aggregation and disease. NMR provides a method for the structural description of peptides and proteins in solution, however observables such as NOEs and chemical shifts reflect averages of the properties of individual conformations and the structural characterization of disordered systems cannot be done using conventional static constraints typically used for globular proteins.
One approach to the characterization of these conformational ensembles is to integrate NMR and computational strategies1a. A number of computational methods have been suggested based on molecular dynamics with time averaged or ensemble averaged NMR restraints introduced as an additional term in the effective potential used for structure refinement1a-e. If the effective potentials are accurate enough and the sampling is extensive enough, it should not be necessary to add NMR restraint terms to the potential function in order to generate structural ensembles which fit the NMR data. However, there have only been a few comparisons published of the results of “unbiased” MD simulations of peptide ensembles and corresponding NMR experiments2a,b. We recently reported the results of replica exchange molecular dynamics (REMD) simulations of the GB1 peptide which forms a beta-hairpin3a,b. By the nature of the REMD simulation procedure we employed, twenty peptide ensembles were generated as a function of temperature which span a range from the most ordered ensemble at 270K to the most disordered at 690K. In this communication, we compare each of these structural ensembles with experimental NMR data we have recorded for the peptide. We show that the peptide ensembles in the middle range of temperatures near 400K provide the best fit to the low temperature (278K) experimental NMR data, thereby providing a set of models for visualizing the heterogeneity present in the experimental ensemble and also an approach that can be used to help calibrate the effective potential.
The C-terminal β-hairpin of the B1 domain of G-protein is a small dynamic system. This peptide has been shown by NMR and fluorescence measurements to form a β-hairpin in solution4a,b. The peptide ensemble has been estimated to be between 30-58% β-hairpin at 278K, based on NMR chemical shifts or on the percentage of native hydrogen bonds formed in computer simulations of the peptide system4a,5a-c. However, the number of native hydrogen bonds formed does not uniquely characterize the conformations in the ensemble as it is possible to have ensembles with very different structural properties whose hydrogen bond distributions have similar averages.
Ensembles of peptide conformations were generated using REMD6, the OPLS-AA all atom force field and the AGBNP implicit solvent model7.within the IMPACT8 molecular simulation package. The current generation of implicit solvent effective potentials, including OPLS-AA/AGBNP are not parameterized to accurately model temperature effects and tend to predict overly structured molecules at low temperature3a, thus leaving open the question of which of the ensembles best match the experimental chemical shifts, J-couplings(Table S1) and NOE NMR parameters (Figure S1) obtained on the GB1 peptide at pH 7.0 and 278K.
One measure of the extent of hairpin formation within the peptide ensemble is the percent of native hydrogen bonds formed, where native refers to the hydrogen bonds formed in the β-hairpin within the intact protein. The REMD ensembles, calculated as a function of temperature, indicate that the system is 35-60% β-hairpin over temperatures ranging from 270K to 421K (Figure 1a). At higher temperatures the β-hairpin population decreases and the peptide is unfolded by 500K. All of the peptide ensembles below 421K are consistent with previous estimates of percent β-hairpin derived from NMR chemical shift analysis as well as computer simulations4a,5a-c. However, detailed analysis of two of these ensembles(270K,421K) shows that the populations of the six native hydrogen bonds within the peptide have very different H-bond distributions (figure 1b). In the low temperature 270K ensemble, 99 % of the structures have at least one native hydrogen bond formed. In contrast the higher temperature ensemble shows a very heterogeneous distribution of hydrogen bond populations, with approximately 50% of the structures having no native hydrogen bonds. The other 50% of the structures in the high temperature ensemble have one or more H-bonds, with the most probable number being four.
Figure 1.
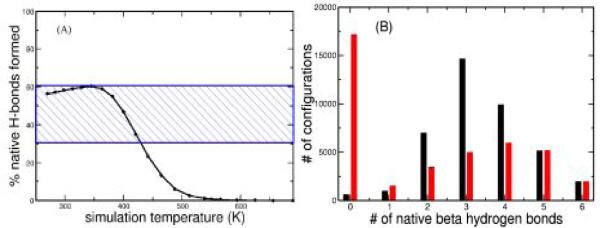
A) Percentage of native β hydrogen bonds formed relative to the total number possible. B) Distributions of configurations with 0-6 native β hydrogen bonds in the 270K(black) and 421K(red) ensembles.
To determine which ensembles within the range of temperatures from 270-690K best fit the experimental data, comparisons are made between predicted and measured values of HA(Fig. 2) and HN(Fig. S2) chemical shifts and Jhahn scalar couplings(Fig. S3). At each simulation temperature, chemical shifts and scalar couplings are calculated for each of the residues in each of the 40000 structures constituting an ensemble using SHIFTX9 for the chemical shifts and a Karplus relationship for the J-couplings10. The HA and HN chemical shift and Jhahn scalar coupling plots all have minima within the range of temperatures from 381-442K, indicating that the simulation ensembles in this middle temperature range are the most similar to the ensemble represented by the NMR data. Additionally, these ensembles are substantially different from those near 270K and those near 690K. The correspondence between the simulation ensembles in this middle range and the low temperature experimental results is further supported by comparing the temperature dependence of predicted and experimental HN chemical shifts11a,b. The experimental trends are most closely reproduced by matching the predicted temperature dependent HN chemical shifts for the ensembles in the middle of the simulation temperature range to the experimental low temperature values(Fig. S4), supporting the correlation between the experimental system and the heterogeneous hydrogen bonding pattern described by the simulations.
Figure 2.

Mean agreement in HA chemical shifts for each simulation ensemble relative to the experimental shifts at 278K(red curve) and random coil(blue curve). See Supporting Information for details
Comparison of distances derived from NOEs provide another approach for selecting the ensembles which best fit the NMR data at low temperature. The NOEs that are included(figure 3a, 3b) are those observed for residues 41-56 in the intact G-protein12, with the subset seen in the peptide NMR experiments labeled in red. Distances derived from these NOEs, taken from the NMR structure of the protein, are plotted as a control against predicted interproton distances from two ensembles: one at low temperature (270K) and one from the middle simulation temperature range (421K). Predicted NOEs are obtained from the simulations by assuming the members of the ensembles interconvert very rapidly and by averaging <r−3> over the ensembles13a,b. A number of features can be observed in the data supporting the view that the two simulated ensembles have different conformational states and that the predicted NOEs at the higher temperature are more consistent with the experimental NOEs at 278K. At low temperature, most of the points lie along the diagonal, indicating that the conformational ensemble at 270Kis similar to the NMR structure obtained for the β-hairpin region in the G-protein. However, the peptide experimental NOEs observed at 278K are not consistent with either the NMR structure of the G-protein or the simulated ensemble at low temperature; certain short and long range NOEs are observed but many expected short and long range NOEs are missing in an unsystematic way.
Figure 3.

Backbone-backbone NOEs(obtained from the BMRB) observed in the G protein which are either observed(red) or unobserved(blue) in the GB1 peptide, plotted with the distance in the protein(pdb structure 2gb1) versus the average distance in the low temp(A,270K) and a representative middle range temp(B,421K) simulation ensembles. NOE list is provided in Supp. Information.
In contrast, at 421K there is a clear systematic separation of observed and unobserved NOEs, with all those observed in the peptide at short ensemble averaged distances. The NOEs that have moved most significantly relative to the 270K ensemble are sequential HN-HN NOEs corresponding to points 6(55HN-56HN), 5(51HN-52HN), and 2(45HN-46HN). Neighboring amide protons in the strand of a β-hairpin are constrained to be maximally separated and any change in conformation therefore will bring these protons closer together. The opposite effect takes place for HAi-HNi+1 protons in β-strands, which are constrained to be close. Therefore, the introduction of new non-hairpin populations will significantly effect the predicted distances of the sequential amide protons while not greatly changing the averaged distances between sequential HA-HN pairs due to the <r−3> averaging, which is biased towards short distances.
That only short interproton distances are observed in the peptide is due to the fact that the small size of the peptide gives rise to a smaller rotational correlation time relative to the same residues in the intact protein G leading to a reduction in the NOE intensity. This smaller NOE intensity in turn means that, for a given noise level, signals corresponding to long distances are lost in the noise. The one NOE that does not follow this pattern is a cross-strand NOE (54HA-44HN) which is observed even though the protons are separated on average by more than 4 Å in the high temperature ensemble. This reflects the fact that, apparently, the simulation does not align the strands of the hairpin as closely as is observed in the peptide.
In conclusion, detailed comparison of REMD simulations to numerous experimental NMR parameters, including HA,HN chemical shifts, Jhahn scalar coupling and NOEs has provided an approach for identifying the set of simulated ensembles that best match the low temperature experimental data. These ensembles allow the visualization of distinct populations within the conformational ensemble of the GB1 peptide, thereby providing access to not only averages of conformational properties such as the number of hydrogen bonds, but also to the distributions which make up those averages. What is striking is that the ensembles that best match the experimental NMR data are very inhomogeneous and the fact that they include a large population of conformations with no native hydrogen bonds.
Supplementary Material
ACKNOWLEDGMENT
This work has been supported by grants from the NIH – GM30580 and GM45302. The authors thank David Wishart for providing the SHIFTX source code.
Footnotes
Supporting Information Available: NMR chemical shifts, J-couplings & NOE parameters, computational details, full ref. 8
References
- 1.a Lindorff-Larsen K, Kristjansdottir S, Teilum K, Fieber W, Dobson CM, Poulsen FM, Vendruscolo M. J. Am. Chem. Soc. 2004;125:3291. doi: 10.1021/ja039250g. [DOI] [PubMed] [Google Scholar]; b Choy W-Y, Forman-Kay JD. JMB. 2001;308:1011. doi: 10.1006/jmbi.2001.4750. [DOI] [PubMed] [Google Scholar]; c Torda AE, Scheek RM, van WF. Gunsteren Chem. Phys. Lett. 1989;157:289. [Google Scholar]; d Best RB, Vendruscolo M. JACS. 2004;126:8090. doi: 10.1021/ja0396955. [DOI] [PubMed] [Google Scholar]; e Dedmon MM, Lindorff-Larsen K, Christodoulou J, Vendruscolo M, Dobson CM. J. Am. Chem. Soc. 2005;127:476. doi: 10.1021/ja044834j. [DOI] [PubMed] [Google Scholar]
- 2.a Satoh D, Shimizu K, Nakamura S, Terada T. FEBS Letters. 2006;590:3422. doi: 10.1016/j.febslet.2006.05.015. [DOI] [PubMed] [Google Scholar]; b Zagrovic B, Sorin EJ, Pande Vijay. JMB. 2001;313:151. doi: 10.1006/jmbi.2001.5033. [DOI] [PubMed] [Google Scholar]
- 3.a Felts AK, Harano Y, Gallicchio E, Levy RM. Proteins. 2004;56:310. doi: 10.1002/prot.20104. [DOI] [PubMed] [Google Scholar]; b Andrec M, Felts AK, Gallichio E, Levy RM. PNAS. 2005;102:6801. doi: 10.1073/pnas.0408970102. [DOI] [PMC free article] [PubMed] [Google Scholar]
- 4.a Blanco FJ, Rivas G, Serrano L. Struct. Biol. 1994;1:584. doi: 10.1038/nsb0994-584. [DOI] [PubMed] [Google Scholar]; b Munoz V, Thompson PA, Hofrichter J, Eaton WA. Nature. 1997;390:196. doi: 10.1038/36626. [DOI] [PubMed] [Google Scholar]
- 5.a Dinner AR, Lazaridis T, Karplus M. PNAS. 1999;96:9068. doi: 10.1073/pnas.96.16.9068. [DOI] [PMC free article] [PubMed] [Google Scholar]; b Garcia AE, Sonbonmatsu KY. Proteins. 2001;42:345. doi: 10.1002/1097-0134(20010215)42:3<345::aid-prot50>3.0.co;2-h. [DOI] [PubMed] [Google Scholar]; c Fesinmeyer RM, Hudson FM, Andersen NH. JACS. 2004;126:7238. doi: 10.1021/ja0379520. [DOI] [PubMed] [Google Scholar]
- 6.Sugita Y, Okamoto Y. Chem. Phys. Lett. 1999;314:141. [Google Scholar]
- 7.Gallicchio E, Levy RM. J. Comp. Chem. 2004;25:479. doi: 10.1002/jcc.10400. [DOI] [PubMed] [Google Scholar]
- 8.Banks JL, et al. J. Comp. Chem. 2005;26:1752. [Google Scholar]
- 9.Neal S, Nip AM, Zhang H, Wishart DS. J. Biomol. NMR. 2003;26:215. doi: 10.1023/a:1023812930288. [DOI] [PubMed] [Google Scholar]
- 10.Lindeorff-Larsen K, Best RB, Vendruscolo M. J. Biomol. NMR. 2005;32:273. doi: 10.1007/s10858-005-8873-0. [DOI] [PubMed] [Google Scholar]
- 11.a Case DA. Curr. Opin. Struc. Biol. 2000;10:197. doi: 10.1016/s0959-440x(00)00068-3. [DOI] [PubMed] [Google Scholar]; b Baxter NJ, Williamson MP. J. Biomol. NMR. 1997;9:359. doi: 10.1023/a:1018334207887. [DOI] [PubMed] [Google Scholar]
- 12.Gronenborn AM, Fipula DR, Essig NZ, Archari A, Whitlow M, Wingfield PT, Clore Science GM. 1991;253:657. doi: 10.1126/science.1871600. [DOI] [PubMed] [Google Scholar]
- 13.a Olejniczak ET, Dobson CM, Karplus M, Levy RM. J. Am. Chem. Soc. 1984;106:1923. [Google Scholar]; b Kessler H, Greisinger C, Lautz J, Muller A, van Gunsteren WF, Berendsen HJ. J. Am. Chem. Soc. 1988;110:3393. [Google Scholar]
Associated Data
This section collects any data citations, data availability statements, or supplementary materials included in this article.