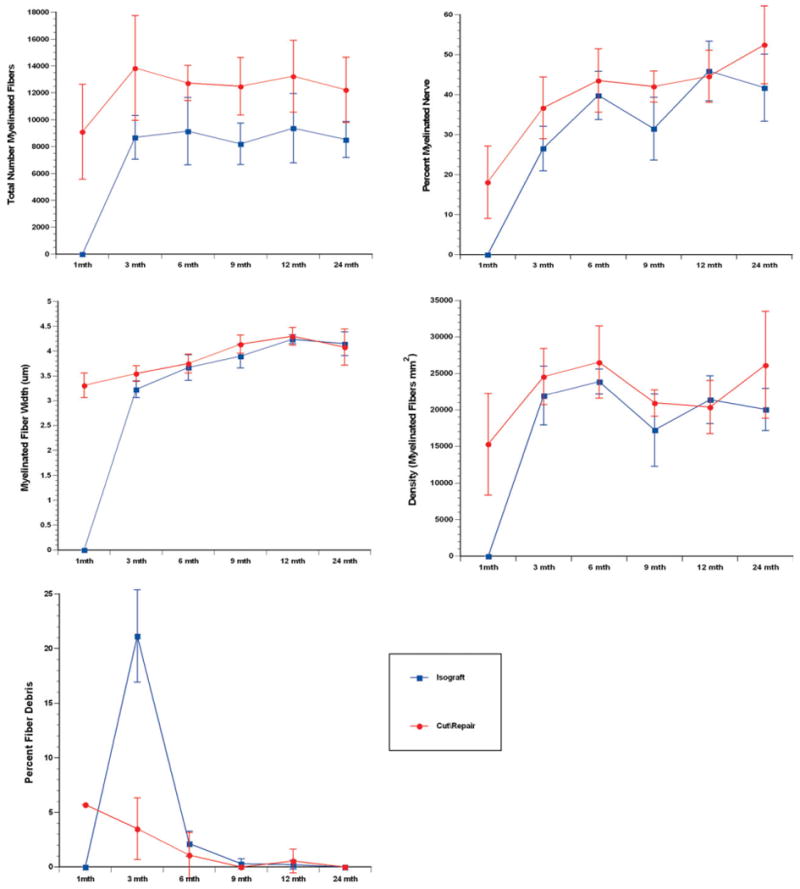
Figure 4.

Histomorphometric comparison of end-to-end repair versus nerve graft repair groups at serial time points. Parameters of nerve density, fiber count, percent neural tissue, myelin width, and percent neural debris are shown. Fiber counts and nerve density demonstrated plateau at 3 months, whereas myelin width and percent neural tissue increased through 12 months. Clearance of myelin debris occurred over the initial 9 months after original injury. [Color figure can be viewed in the online issue, which is available at wileyonlinelibrary.com.]
