

Abstract
Recognition of modified histones by “reader” proteins plays a critical role in the regulation of chromatin1. H3K36 trimethylation (H3K36me3) is deposited onto the nucleosomes in the transcribed regions following RNA polymerase II (Pol II) elongation. In yeast, this mark in turn recruits epigenetic regulators to reset the chromatin to a relatively repressive state thus suppressing cryptic transcription2. However, much less is known about the role of H3K36me3 in transcription regulation in mammals. This is further complicated by the transcription-coupled incorporation of the histone variant H3.3 in gene bodies3. Here we show that the candidate tumor suppressor ZMYND11 specifically recognizes H3K36me3 on H3.3 (H3.3K36me3) and regulates Pol II elongation. Structural studies reveal that in addition to the trimethyl-lysine binding by an aromatic cage within the PWWP domain, the H3.3-dependent recognition is mediated by the encapsulation of the H3.3-specific “Ser31” residue in a composite pocket formed by the tandem bromo-PWWP domains of ZMYND11. ChIP-sequencing analyses reveal a genome-wide colocalization of ZMYND11 with H3K36me3 and H3.3 in gene bodies, and its occupancy requires the pre-deposition of H3.3K36me3. Although ZMYND11 is associated with highly expressed genes, it functions as an unconventional transcription corepressor via modulating Pol II at the elongation stage. ZMYND11 is critical for the repression of a transcriptional program that is essential for tumor cell growth; low expression level of ZMYND11 in breast cancer patients correlates with worse prognosis. Consistently, overexpression of ZMYND11 suppresses cancer cell growth in vitro and tumor formation in mice. Together, this study identifies ZMYND11 as an H3.3-specific reader of H3K36me3 that links the histone variant-mediated transcription elongation control to tumor suppression.
ZMYND11 (a.k.a. BS69) is an adenovirus E1A-interacting protein that functions as a corepressor of E1A and cellular transcription factors including the c-Myb and ETS-2 oncoproteins4-6. It contains several histone “reader” modules, including a plant homeodomain (PHD), a bromodomain, and a PWWP domain (Fig. 1a), indicating a role in chromatin regulation. To determine whether these domains can recognize histone modification(s), we utilized a histone peptide array (Supplementary Table 1) and found that the recombinant PHD-bromo-PWWP (PBP) domains specifically bound H3K36me3 peptides (Fig. 1b), which was also confirmed by peptide pull-down assays (Fig. 1c). In addition, ZMYND11 PBP also bound H3K36me3 on bulk histones and the reconstituted H3K36-specific methyl-lysine analog-containing nucleosomes (Extended Data Fig. 1a, b). Several PWWP domains can recognize methylation on histone H3K36 or H3K797-9; therefore we asked whether ZMYND11 PWWP alone was able to bind H3K36me3. The results revealed that neither the isolated PWWP nor the PHD and bromodomain bound H3K36me3, whereas the tandem bromo-PWWP (BP) retained a weak interaction (Fig. 1d and Extended Data Fig. 1c). Isothermal titration calorimetry (ITC) revealed a Kd of 56 μM for PBP and 71 μM for BP to the H3K36me3 peptide, whereas weak or no binding to di-, mono-methylated and the un-methylated H3K36 peptides (Fig. 1e and Extended Data Fig. 1d). Furthermore, deletion of the PWWP, bromo, or PHD domain greatly diminished full-length ZMYND11 binding to H3K36me3 peptide and chromatin, whereas deletion of the MYND domain had no effect (Extended Data Fig. 1e,f).
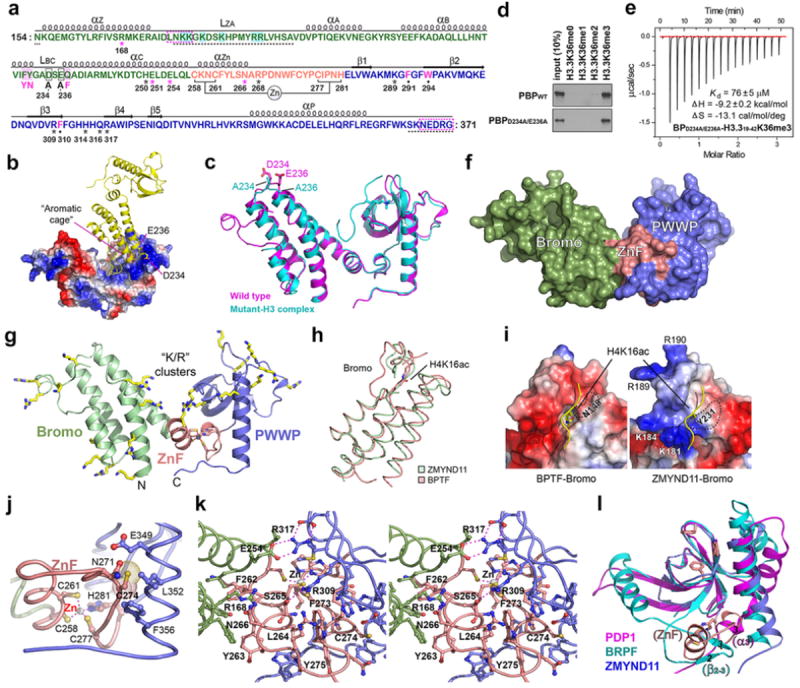
Figure 1. Molecular basis for H3.3K36me3 recognition by ZMYND11 bromo-PWWP domains.

a, Schematic representation of ZMYND11 protein structure. b, Histone peptide microarray (details in Supplementary Table 1) probed with GST-ZMYND11 PBP domains. c and d, Western blot analysis of histone peptide pulldowns with GST-ZMYND11 PBP (c) or individual domains (d) and the indicated biotinylated peptides. e, ITC curves of histone H3.3K36me peptides titrated into ZMYND11 PBP domains. n.d.: not detectable. f, Cartoon view of ZMYND11 BP domains in the free state. g, Structure of ZMYND11 BP in complex with H3.3K36me3 peptide. BP is shown as charge distribution surface. Blue: positive charges; red: negative charges. 2Fo-Fc omit maps around H3 peptide, polyethylene glycol (PEG) and phosphate (PO4) are shown as green mesh contoured at 1 σ level. h, Details of the K36me3 recognition by the PWWP domain. Close-up views: left: the hydrogen-bonding network around G34-H39; right: conformational adjustment of the PWWP aromatic cage upon H3K36me3 peptide binding. ZMYND11 BP in free state is shown in light grey and BP in complex state in dark blue; histone peptide is shown in yellow; small red balls indicate water. i, Western blot analysis of peptide pulldowns with GST-PBP or mutants and the indicated peptides. All the H3K36 peptides used in these experiments were H3.3-based.
To gain molecular insights into the reader function of ZMYND11, we solved the crystal structure of the tandem BP domains in its free state and in complex with H3K36me3 peptide at 1.95 Å and 2.0 Å, respectively (Extended Data Table 1 and Supplementary Discussion). Successful crystallization of the BP-H3K36me3 complex was facilitated by alanine mutation of D234 and E236 within the bromodomain to disrupt unfavorable packing contacts without affecting protein folding and histone binding (Extended Data Fig. 2a-e). The tandem Bromo-PWWP domains adopt a V-shaped structure imparted by a “kink” around a previously uncharacterized zinc finger (ZnF) motif (Fig. 1f, g). Several structural features imply that ZMYND11 bromodomain is unlikely a histone acetyllysine-binding module (Extended Data Fig. 2f-l). The PWWP domain adopts a five-bladed β-barrel fold with an extended C-terminal α-helix (αP), with a conserved H3K36me3-binding aromatic cage7-9 formed by F291 and W294 of the β1-β2 loop and F310 of the β3-β4 loop (Fig. 1h and Extended Data Fig. 3a-c). Alanine mutations abrogated ZMYND11 binding to the H3K36me3 peptide and chromatin without affecting the overall protein folding (Figs. 1i, 2i and Extended Data Fig. 3d-f). Despite extensive interactions observed in crystals for the histone peptide, the relatively weak binding affinity suggests that an alternative binding mechanism is plausible. In deed, PWWP domain was previously identified as a DNA-binding motif10. Consistent with a recent report11, we found that ZMYND11 BP bound to DNA at low micromolar level (Extended Data Fig. 3g). The higher binding affinity for DNA than that for histone peptides is in agreement with observations for some other PWWP domains12,13. Although not detected in our pulldowns using peptides and oligos, all these features suggest that a synergy between histone and DNA may contribute to ZMYND11 binding at the nucleosomal level (Supplementary Discussion).
Figure 2. H3.3 variant-specific K36me3 recognition by ZMYND11.

a, Sequence alignment of H3.3 and H3.1 spanning aa 19-42. The yellow line denotes visible segment in the complex structures. b, Encapsulation of the “S31-T32” segment and “K36me3” by the paired bromo (pale green), ZnF (salmon), and PWWP (blue) modules of ZMYND11 rendered as solvent accessible surface. The “S31-T32” segment, K36me3, and two water (Wat) molecules are highlighted in spacing-filling mode. PO4: phosphate. c, Western blot analysis of peptide pulldowns with ZMYND11-PBP and the H3.3 or H3.1 variant peptides bearing K36me. d, ITC curves of H3.3K36me3 and H3.1K36me3 peptides titrated into ZMYND11 PBP or BP domains. e and f, Recognition of the “A29-G33” segment of H3.3 (e) or H3.1 (f) by ZMYND11 at the junction of bromo (pale green), ZnF (salmon), and PWWP (blue). Panel e is prepared in stereo view with H3.1 complex (grey) superimposed for comparison. Histone peptides are highlighted as yellow sticks. Hydrogen bonding interactions were shown as dashes with cyan for those between H3 peptide and BP, and magenta for those within H3 peptide or BP. Small red balls: waters. g and h, Ligplot diagrams showing critical contacts between ZMYND11 BP and the “A29-G33” segment of H3.3 (g) and H3.1 (h). H3 segment and key hydrogen bonding residues from ZMYND11 BP are depicted in ball-and-stick mode. Cyan circle: water; Blue dashed line: hydrogen bonds; Curved brush: hydrophobic contact. i, ITC curves of ZMYND11-BP domains and the indicated point mutants with the H3.3K36me3 peptide.
The H3K36me3 peptides used in the biochemical and structural studies were histone H3.3-based peptides (Fig. 2a). The histone variant H3.3 possesses a signature motif “S31⋯A87AIG90” that is distinct from the “A31…S87AVM90” sequence signature of the canonical histone H3.1/23. Our structure revealed that the H3.3-specific “S31” residue and its neighboring T32 were encapsulated at the bottom of the “Bromo-ZnF-PWWP” valley (Fig. 2b), contributing to the ZMYND11-H3 interactions in addition to the binding of K36me3 by the PWWP aromatic cage. Indeed, the binding of ZMYND11 to H3.3K36me3 was much stronger than its binding to the H3.1 counterpart, with 7-8 fold difference in binding affinity (Fig. 2c,d and Extended Data Fig. 4a,b). Furthermore, Flag-tagged histone H3.3, but not H3.1 strongly co-immunoprecipitated ZMYND11 in cells (Extended Data Fig. 4c). Together, these results suggest that the H3.3-specific S31 residue is indispensable for ZMYND11-H3K36me3 interaction.
We also solved the structure of ZMYND11 BP-H3.1K36me3 complex at 2.3 Å for comparison (Extended Data Table 1 and Extended Data Fig. 4d). A number of hydrogen bonding interactions around the “A29-G33” segment in the BP-H3.3 complex were lost in the BP-H3.1 complex following the “Ser to Ala” conversion at position 31 (Fig. 2e,f and Extended data Fig. 4e,f). Superimposition of the complex structures revealed a conformational adjustment of the H3.1 “A29-G33” segment (Fig. 2e), indicating a non-ideal encapsulation. As highlighted in the Ligplot diagram14, eight direct hydrogen bonds and two sets of water-mediated hydrogen bonding were detected upon H3.3 variant binding (Fig. 2g), whereas only three direct hydrogen bonds and two sets of water-mediated hydrogen bonding were observed for H3.1 recognition (Fig. 2h). Notably, residues from all three modules, bromo, ZnF and PWWP, contributed to the A29-G33 segment recognition through the formation of a composite pocket, calling attention to the theme of “module integration” for extended reader function15. Unique hydrogen bonding interactions for the H3.3-specific readout were particularly supplied by “R168-A29”, “E251-S31”, “E254-T32” and “N266-S31” of the ZMYND11-H3.3 pair along with an adaptive flipping of the R168 side chain (Fig. 2e, g), and mutations diminished the bindings (Fig. 2i and Extended Data Fig. 4g). Together, the results strongly support a role of ZMYND11 as an H3.3-specific reader of H3K36me3.
We next sought to determine whether ZMYND11 colocalizes with H3K36me3 and the H3.3 variant in the genome by chromatin immunoprecipitation coupled with high-throughput sequencing (ChIP-seq) analysis. We identified 9,759 ZMYND11 peaks distributed over 3,353 genes in human osteosarcoma U2OS cells (Supplementary Table 2). The peaks were highly enriched in intron and exon (herein defined as gene body) but not promoter (Fig. 3a). Strikingly, the average distribution of all ZMYND11-bound peaks recapitulated the genomic distribution of H3K36me316 (Fig. 3b and Supplementary Table 3): absent from transcription start site (TSS), but gradually increased in gene body towards the 3’ end and peaked at the transcription termination site (TTS).
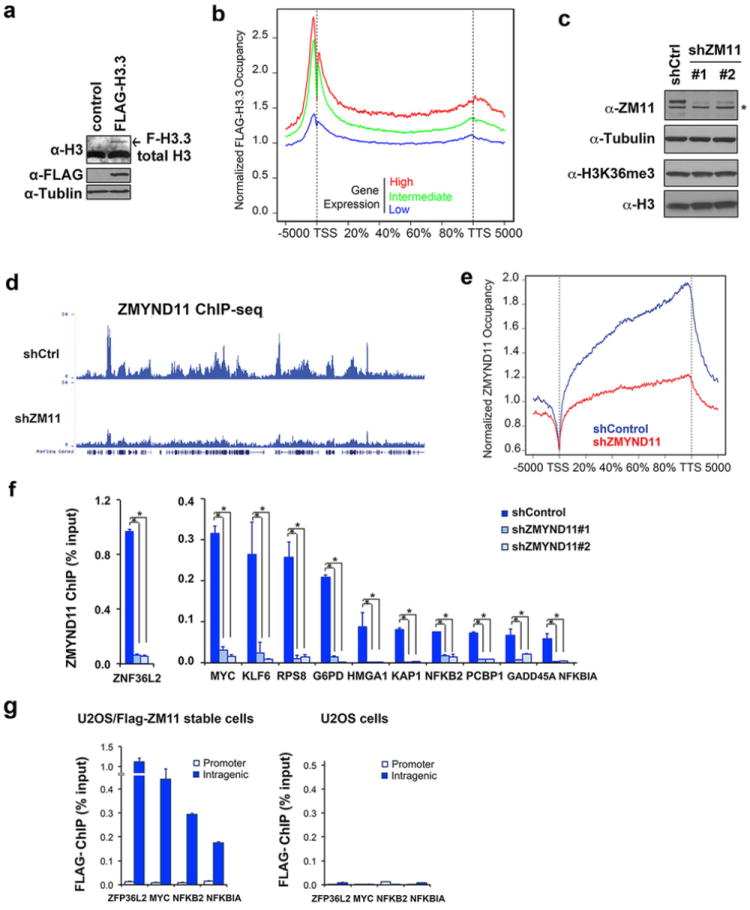
Figure 3. ZMYND11 colocalizes with H3K36me3 and H3.3 in gene body.

a, Genomic distribution of ZMYND11 ChIP-seq peaks in U2OS cells. The peaks are enriched in introns and exons. P < 1e-1208 (binomial test). b, Average genome-wide occupancies of ZMYND11 and H3K36me3 along the transcription unit. The gene body length is aligned by percentage from the Transcription start sites (TSS) to transcription termination site (TTS). 5 kb upstream of TSS and 5kb downstream of TTS are also included. c, Venn diagram showing the overlap of ZMYND11-, H3K36me3- and Flag-H3.3-occupied genes. P< 1e-465 (3-way Fisher’s exact test). d, Genome-browser view of ChIP-seq peaks in chromosome 16p13.3 regions. TSSs are indicated with arrows. e, Heatmaps of normalized density of ChIP-seq tags in a 20 kb window centered on TTS. f, Average genome-wide ZMYND11 occupancy on genes enriched with both H3K36me3 and H3.3 (red), genes with H3K36me3 (blue) or H3.3 (green) only, or genes with no H3K36me3 and H3.3 enrichment (black). Genes were aligned as described in b, and were grouped according to the H3K36me3 and Flag-H3.3 ChIP-seq normalized tag numbers >10 (high) or < 2 (none). g, qPCR analysis of ZMYND11, H3K36me3 and Flag-H3.3 ChIP. Error bars: s.e.m. of three experiments. h, qPCR analysis of ZMYND11 and H3K36me3 ChIP in MYC gene body in SETD2 knockdown cells. IgG ChIP is shown as a negative control. i, qPCR analysis of Flag ChIP in the cells stably expressing Flag-tagged WT or mutant ZMYND11. In g-i, all error bars represent s.e.m. of three experiments. *: P<0.05.
We also determined the genome-wide distribution of histone variant H3.3 by ChIP-seq analysis of Flag-H3.3 stably expressed in U2OS cells (Extended Data Fig. 5a and Supplementary Table 4). In accordance to previous observations17-19, H3.3 was distributed in both the promoter and the body of active genes (Extended Data Fig. 5b). The gene body-associated H3.3 showed a strong co-occupancy with H3K36me3 (Fig. 3c). Importantly, two thirds of all the ZMYND11-bound genes overlapped with H3K36me3 and H3.3-co-occupied genes (P< 1e-465) (Fig. 3c), as also represented by a genome-browser view of the ChIP-seq signals (Fig. 3d). High ZMYND11 occupancies were observed in genes enriched with both H3K36me3 and H3.3, whereas ZMYND11 occupancies were much lower in genes only decorated with H3K36me3 or H3.3 (Fig. 3e-g). Importantly, depletion of ZMYND11 by shRNAs drastically diminished the ChIP-seq signals (Extended Data Fig. 5c-g), suggesting that the ChIP data obtained using our ZMYND11 antibody reflect the endogenous ZMYND11 chromatin-binding pattern.
ZMYND11 densities in gene bodies were directly correlated with H3K36me3 levels (Extended Data Fig. 6a), we then asked whether ZMYND11 occupancy was H3K36me3 dependent. We found that ZMYND11 binding on target genes was reduced along with diminished H3K36me3 levels in the SETD220 knockdown cells (Fig. 3h and Extended Data Fig. 6b-d), but not in the NSD2 (an H3K36me2 methyltransferase)21 knockdown cells where the H3K36me3 levels remained largely unchanged (Extended Data Fig. 6e,f). Furthermore, the H3.3K36me3 recognition-deficient mutants of ZMYND11 were severely impaired in binding on target genes (Fig. 3i and Extended Data Fig. 6g,h). Taken together, these results strongly suggest that ZMYND11 colocalizes with H3K36me3 and H3.3 in gene body, and its occupancy requires the pre-deposition of trimethylation on H3.3K36.
To identify ZMYND11-regulated genes genome-wide, we performed RNA-seq analysis in U2OS cells. We found that 268 genes were upregulated and 370 genes downregulated upon ZMYND11 depletion (Fig. 4a, Extended Data Fig. 7a-c and Supplementary Table 5). Gene ontology analysis revealed that the upregulated genes in ZMYND11 knockdown cells were specifically enriched in small cell lung cancer and focal adhesion pathways; in contrast, the downregulated genes were not enriched in any pathways (Fig. 4b and Supplementary Table 5). IPA disease association analysis of the upregulated genes also revealed a high enrichment in cancer (Fig. 4b). These data suggest that ZMYND11 has a role in both transcriptional repression and activation, but it specifically represses oncogene expression.
Figure 4. ZMYND11 modulates Pol II elongation and represses oncogene expression and tumor growth.

a, Heatmap representation of differentially expressed genes in control and ZMYND11 knockdown cells. Blue indicates relative low expression; yellow indicates high expression (Details in Supplementary Table 5). b, KEGG and IPA pathway analyses of upregulated genes in ZMYND11 knockdown cells. Genes are shown as the percentage of genes (KEGG) or number of genes (IPA) within a functional group. False discovery rate (FDR) and p-values are shown in the right. c, The genome browser view of Pol II and Pol II-S2P ChIP-seq signals in MYC and NFKB2 genes in control and ZMYND11 knockdown cells. TSS are indicated with arrows. d, Average Pol II occupancy on ZMYND11-repressed direct target genes in control (blue) and ZMYND11 knockdown (red) cells. The left panel shows the entire gene averages, and the right panel shows the close-up view of the elongating Pol II near the TTS. P<2.47e-5 (two-way unpaired Student’s t-test). e, Cell proliferation assay in MDA-MB 231 cells overexpressing WT ZMYND11 or the indicated mutants. Cells (mean ± s.e.m., n=4) were counted for 6 days after seeding. f, Volumes of tumors (mean ± s.e.m., n=5) derived from MDA-MB 231 cells overexpressing WT ZMYND11 or the indicated mutants over 8 weeks following subcutaneous xenograft transplants in immunodeficient nude mice. In e, f, P < 0.001 (one-way repeated-measures ANOVA). g, Kaplan-Meier curves of overall recurrence-free survival of 120 patients with triple-negative molecular subtype of breast cancer30. Logrank P =0.0032 (chi-square test).
Because ZMYND11 is localized in gene body, we postulated that ZMYND11 regulates gene expression at the transcription elongation rather than the initiation step. Gene body Pol II density correlates well with transcription elongation rate22,23, we therefore determined the changes of Pol II density upon ZMYND11 depletion. ZMYND11 occupancies were enriched in genes with high Pol II densities (P <1x10-401) (Extended Data Fig. 8a, b and Supplementary Table 6). Upon ZMYND11 depletion, we observed increased Pol II occupancy specifically on ZMYND11-repressed genes (Fig. 4c,d and Extended Data Fig. 8c). Notably, only the level of the intragenic Pol II, especially Pol II near the 3’ end of gene body, was markedly increased, whereas the promoter-associated Pol II remained largely unchanged (Fig. 4c,d). Similar increases were also observed for the elongation-specific Pol II that is phosphorylated at serine 2 (S2P)24 and the intragenic H3K36me3 levels (Fig. 4c and Extended Data Fig. 8d,e). The phenomenon of specific increase of Pol II in gene body was further supported by the quantified Pol II traveling ratio22 (Extended Data Fig. 8f). Together, these data suggest that ZMYND11 occupancy correlates with Pol II density in gene body, and ZMYND11 represses gene expression by preventing the transition of paused Pol II to elongation.
ZMYND11 is downregulated in multiple human cancers including breast cancer (Extended Data Fig. 9a), indicating that ZMYND11 is a candidate tumor suppressor25. Overexpression of the WT ZMYND11 inhibited tumor cell growth, whereas the H3.3K36me3 binding-deficient mutants exhibited severe defects in suppressing cell proliferation and survival in both U2OS and the invasive MDA-MB 231 breast cancer cells (Fig. 4e and Extended Data Fig. 9b-e). Furthermore, in a mouse xenograft study using MDA-MB 231 cells, we found that compared with mice injected with control cells, tumor formation was strongly suppressed in mice injected with cells expressing WT ZMYND11, whereas the H3.3K36me3-binding deficient mutant W294A was severely impaired in suppressing tumor growth in vivo (Fig. 4f). Interestingly, D307N, a missense mutation identified in colon and rectum adenocarcinoma patients (Extended Data Fig. 9f), diminished ZMYND11 binding to H3.3K36me3 (Fig. 2i and Extended Data Fig. 9g-i) and its tumor suppressor function in mice (Fig. 4f). Taken together, these results suggest that ZMYND11 suppresses phenotypes of cancer cells in a manner that depends on its H3.3K36me3-binding activity. Consistent with these experimental results, low ZMYND11 expression levels in breast cancer patients correlate with worse disease-free survivals (Fig. 4g and Extended Data 9j,k).
In summary, we have identified ZMYND11 as an H3.3-specific reader of H3K36me3. To our knowledge, it represents the first variant-specific reader of methylated histones. The combination of H3K36me3 and H3.3 establishes a unique epigenetic state that defines the genomic distribution of ZMYND11, offering a spatiotemporal control of gene expression for both normal and neoplastic growth. Because both H3K36me3 and H3.3 are deposited into the chromatin along with elongating Pol II, ZMYND11 is likely to be recruited to gene bodies only after one or multiple rounds of transcription when sufficient H3.3K36me3 is accumulated. We propose that, rather than as an on/off switch, ZMYND11 mainly functions in “fine-tuning” gene expression by modulating Pol II elongation.
Our findings also underscore the importance of the histone variant H3.3 in tumor suppression. Frequent mutations of the H3.3-encoding H3F3A gene have recently been identified in pediatric glioblastoma26,27. Unlike the K27M mutation in a single copy of H3.3-encoding gene that affects the global H3K27 methylation levels, the G34V/R mutations only alter the H3K36me3 levels at certain genes28,29. Interestingly, the G34V/R mutations impaired ZMYND11 binding to the H3.3K36me3 peptide (Extended data Fig. 9l). It remains an open question whether disruption of the binding of ZMYND11, or other yet unknown H3.3K36me3 readers, has a physiological impact on the pathogenesis of pediatric glioblastoma.
METHODS
Materials
Human and mouse ZMYND11 cDNA were cloned into pENTR3C and subsequently cloned into pBABE-FLAG, p3FLAG, pCAG-Myc, and pGEX destination vectors using Gateway techniques (Invitrogen). The cDNA encoding the PHD-Bromo-PWWP (PBP, aa74-371) and Bromo-PWWP (BP, 154-371) of mouse ZMYND11 was cloned into the pGEX-6P1 and pET-28a vectors (Novagen). Point mutations were generated using site-direct mutagenesis kit (Stratagene). Histone peptides bearing different modifications were synthesized at the W.M. Keck Facility at Yale University31,32 and SciLight Biotechnology, LLC. The anti-ZMYND11 antibody was kindly provided by Dr. Joseph Lipsick5. Anti-histone antibodies including anti-H3 (Ab1791), anti-H3K36me3 (Ab9050), anti-H3K36me2 (Ab9049), anti-H3K4me3 (Ab8580) antibodies and anti-Pol II S2P were obtained from Abcam. Anti-FLAG (M2) and anti-tubulin antibodies were from Sigma; anti-NSD2 from Epicypher, anti-GST and anti-total Pol II antibodies were from Santa Cruz; and anti-MYC antibodies were from Cell Signaling. ShRNA constructs were purchased from Sigma. ShRNA sequences are: ZMYND11: 5’-GAAGGGAAATACCGAAGTTAT and 5’-CCTGACAACTGGTTCTGTTAT; SETD2: 5’-AGTAGTGCTTCCCGTTATAAA and TGATAGCCATGATAGTATTAAC; and NSD2: 5’-CGGAAAGCCAAGTTCACCTTT.
Peptide microarray and peptide pull-down assay
Peptide microarray and peptide pull-down assays were performed as described previously32,33. Briefly, biotinylated histone peptides were printed in triplicate onto a streptavidin-coated slide (PolyAn) using a VersArray Compact Microarrayer (Bio-Rad). After a short blocking with biotin (Sigma), the slides were incubated with the GST-fused ZMYND11 PBP or other desired proteins in binding buffer (50 mM Tris-HCl 7.5, 300 mM NaCl, 0.1% NP-40, 1 mM PMSF, 20% fetal bovine serum) overnight at 4°C with gentle agitation. After being washed with the same buffer, the slides were probed with an anti-GST primary antibody and then a fluorescein-conjugated secondary antibody and visualized using a GenePix 4000 scanner (Molecular Devices). For the peptide pull-down assays, 1 μg of biotinylated histone peptides with different modifications were incubated with 1-2 μg of GST-fused proteins in binding buffer (50 mM Tris-HCl 7.5, 300 mM NaCl, 0.1% NP-40, 1 mM PMSF) overnight. Streptavidin beads (Amersham) were added to the mixture, and the mixture was incubated for 1 hr with rotation. The beads were then washed three times and analyzed using SDS-PAGE and Western blotting. To preserve the weak binding between ZMYND11 PBP and histone H3.1K36me3, mild buffer (50 mM Tris-HCl 7.5, 200 mM NaCl, 0.05% NP-40, 1 mM PMSF) was used for binding and washes. Other steps are essentially the same as described above.
Histone binding, nucleosome preparation, and electrophoretic mobility shift assay (EMSA)
Full-length histone pull-down assays were performed as described previously34. Briefly, 10 μg of full-length histones purified from calf thymus (Wormington) were incubated with 25 μg of recombinant proteins for 4 hours to overnight in a binding solution containing 50 mM Tris pH 7.5, 300 mM NaCl, and 0.05% NP-40. Glutathione Sepharose 4B beads (Amersham) were added to the solution for 1 hour. The beads were then washed 6 times and bound histones were detected using Western blot analysis.
Recombinant Xenopus histones were individually purified and reconstituted into histone octamers using a previously described protocol 35. All histone H3K36 methylated histones were prepared using the Methyl-Lysine Analog (MLA) approach36. The chemical reactions result in almost all lysines being converted to methylation mimics, as was confirmed by mass spectrometry analysis and Western blotting.
EMSA for nucleosome binding were performed as described previously35. EMSA reactions were carried out in a 15-ml system containing 10 mM HEPES pH 7.8, 50 mM KCl, 4 mM MgCl2, 5 mM DTT, 0.25 mg/ml BSA, 5% glycerol, and 0.1mM PMSF. Primer pairs (5’ ACAGGATGTATATATCTGACACGTGCCTGG 3’) and (5’ TGACCAAGGAAAGCATGATTCTTCACAC 3’) were designed to generate the 216 bp mono-nucleosome probe by using plasmid pBL386 as template followed by P32 exchange reaction for labeling. MLA-nucleosomes and indicated proteins were premixed in EMSA buffer and incubated at 30°C for 1 hour. Then, the total reactions were directly loaded onto a 4% native polyacrylamide gel (37.5:1) in 0.3 × TBE. Electrophoresis was carried out at 4°C for 3.5 hours.
Crystallization, data collection, and structural determination
ZMYND11 BP domains were cloned into pET28 vector and expressed with N-terminal His-tag in E. coli strain BL21 (DE3) (Novagen) in the presence of 0.5 mM IPTG and 50 μM ZnCl2. Overnight induced cells were collected by centrifugation, resuspended in lysis buffer: 300 mM NaCl, 50 mM Na2HPO4, 5 mM imidazole, pH 7.0, and 1 mM phenylmethylsulfonyl fluoride. Then cells were lysed via Emulsiflex C3 (Avestin) high-pressure homogenizer. After centrifugation at 16,770 × g, the supernatant was applied to HisTrap column (GE Healthcare), and the protein was eluted with a linear imidazole gradient from 50 to 500 mM. The resultant protein was further purified by cation-exchange chromatography using HiTrap SP column (GE Healthcare). The peaks eluted under the buffer condition: 600 mM NaCl, 50 mM Na2HPO4, pH 7.0 was pooled and concentrated to ~20 mg/ml. D234A/E236A double mutant BP (BPDM) was generated by the QuickChange site-direct mutagenesis kit (Stratagene), expressed and purified using essentially the same procedure as for the wild type protein.
Crystallization was performed via the hanging drop vapor diffusion method under 18°C by mixing equal volume (1-2 μl) of protein and reservoir solution. Free BP (8-10 mg/ml) crystals were grown in the solution containing 8 % (w/v) polyethylene glycol 3000, and 0.1 M imidazole, pH 7.8. For complex crystallization, BPDM (8-10mg/ml) was first incubated with histone peptides (SciLight Biotechnology, LLC) at molar ratio of 1: 10 for about 2 hours. Crystals of both H3.319-42K36me3 and H3.121-42K36me3 peptide-bound BPDM could be obtained under 25 % (w/v) polyethylene glycol 4000, 0.1 M Tris-HCl, pH 8.3, and 0.2 M Li2SO4.
Crystals were briefly soaked in a cryo-protectant composed of reservoir solution supplemented with 20% glycerol, and was flash frozen in liquid nitrogen for data collection at 100K. Wild type free BP data set was collected at beamline 1W2B at Beijing Synchrotron Radiation Facility at 1.2825 Å – the zinc absorption edge. Complex data sets were collected at beamline BL17U at the Shanghai Synchrotron Radiation Facility at 0.9793 Å for H3.3K36me3 complex and at 1.0076 Å for H3.1K36me3 complex. All data were indexed, integrated, and merged using the HKL2000 software package37. Data collection statistics are shown in Extended Data Table 1.
The phase of free BP was solved by zinc single-wavelength anomalous dispersion method using software PHENIX38. The BPDM-H3 peptide complex structures were solved by molecular replacement using MOLREP39 with free BP structure as search model. All structures were refined using PHENIX23, with iterative manual model building using COOT 40. Model geometry was analyzed with PROCHECK 41. Ramachandran plot analysis revealed 92.6%, 95.0%, 93.7% residues in most favored regions and 7.4%, 5.0%, 6.3% residues in allowed regions for free BP, BPDM-H3.3 and BPDM-H3.1 complexes, respectively. Detailed structural refinement statistics are shown in Extended Data Table 1. All structural figures were created using program PYMOL (http://www.pymol.org/).
Circular Dichroism (CD) Spectroscopy
Purified proteins were prepared in buffer 25 mM Na2HPO4 pH 7.0, 500 mM (NH4)2SO4 by overnight dialysis. CD spectra were recorded at a protein concentration of 0.1 mg/ml under 15°C using an Applied Photo-physics Pistar π-180 spectropolarimeter with a 1 mm path-length cell and a bandwidth of 3.0 nm. Spectra were scanned from 190 to 260 nm at an interval of 1 nm and were repeated three times. Each reported CD curve was the average of three scans after the subtraction of buffer control.
Isothermal titration calorimetry (ITC) and biolayer interferometry (BLI) assays
For ITC measurement, synthetic histone H3.319-42K36me3 and H3.119-42K36me3 peptides (SciLight Biotechnology, LLC) and the wild type and mutant BP or PBP proteins were extensively dialyzed against ITC buffer: 0.5 M (NH4) 2SO4 and 25 mM Na2HPO4, pH 7.0. Protein and peptide concentration were measured based on their respective UV280nm absorption. The titration was performed using MicroCal iTC200 system (GE Healthcare) at 15°C. The use of high salt (0.5 M (NH4) 2SO4) and low temperature (15°C) is critical to prevent protein precipitation during the ITC titration. Each ITC titration consisted of 17 successive injections with 0.4 μl for the first and 2.42 μl for the rest. Usually, H3 peptides at 1.5 mM were titrated into BP or PBP at 0.07-0.1 mM. Corresponding “peptide to buffer” or “buffer to protein” controls were performed for background correction. The resultant ITC curves were processed using the Origin 7.0 software (OriginLab) according to the “One Set of Sites” fitting model. Due to the low Wiseman c value of most titrations, the stoichiometry (n value) was fixed at 1 for valid curve fitting 42.
GST and GST-tagged ZMYND11-BP proteins were immobilized onto anti-GST antibody-coated biosensors (Fortebio, Pall Life Sciences). After washed with binding buffer (25 mM NaH2PO4 pH7.0, 150 mM KCl, and 2 mM MgCl2), the sensors were dipped into binding buffers containing methylated or unmethylated double strand DNA at various concentrations 5 min for complete association followed by 5 min disassociation in binding buffer without DNA. Kinetics were recorded using Octet RED96 (Fortebio, Pall Life Sciences) at 1000 rpm vibration at 25 °C. Steady state analysis was performed using the equation: Response = Rmax*Conc./[KD+Conc.] using Octet data analysis 7.0. DNA sequences (derived from the Widom 601 sequence43) used in these assays are: unmethylated dsDNA: 5’-CAGCTGAACATCGCTTTTGATG-3’; methylated dsDNA: 5’-CAGCTGAACAT[5medC]GCTTTTGATG-3’.
Cell culture, viral transduction, and RNA interference
Human U2OS, HEK 293T and MDA-MB-231 cells (ATCC) were maintained in DMEM (Cellgro) supplemented with 10% fetal bovine serum (Sigma). Retroviral transduction was performed as described previously32. Briefly, 293T cells were co-transfected with pVPack-VSV-G, pVPack-GP (Stratagene), and pBABE-FLAG-ZMYND11, pQCXIP-ZMYND11 or control vectors, and viral supernatants were harvested after 48 hours. For lentiviral shRNA packaging, 293T cells were co-transfected with pMD2.G, pPAX2 (Addgene) and pLKO-shRNA constructs. For infections, the cells were incubated with viral supernatants in the presence of 8 μg/ml polybrene; after 48 hours, infected cells were selected with puromycin (2 μg/ml). Cell proliferation and colony formation assays were performed as previously described31.
Affinity purification, immunoprecipitation (IP), and co-IP
Nuclear extracts were prepared as described previously31,44. The nuclear extracts were diluted with low salt buffer (20 mM Tris-HCl pH 8.0, 50 mM NaCl, 0.2% Triton X-100, 10% glycerol, 1 mM DTT) to final NaCl concentration to 120 mM. 200 μl of 50% M2 FLAG-agarose beads were added to the nuclear extracts and incubated at 4° for overnight. The beads were then washed with wash buffer (20 mM Tris-HCl pH8.0, 250 or 500 mM KCl, 1.5 mM MgCl2, 0.2 mM EDTA, 10% glycerol, 0.2 mM PMSF, 1 mM DTT and protease inhibitors) for 3-6 times, and eluted with 300 μl of 0.3 mg/ml FLAG peptide in dialysis buffer (20 mM Tris-HCl pH 7.4, 150 mM NaCl, 1 mM DTT) at 4°C for 4 hours for three times. The bound proteins were separated in SDS-PAGE and sent for mass spectrometric analysis. LC/MS/MS analysis was performed in Harvard Taplin MS core facility and UTMB MS core facility.
For immunoprecipitation (IP) or co-IP experiments, cells were lysed in cell lysis buffer containing 50 mM Tris-HCl pH 7.4, 250 mM NaCl, 0.5% Triton X-100, 10% glycerol, 1 mM DTT, and a complete protease inhibitor tablet (Roche). Antibodies conjugated with protein A/G beads (Millipore) or anti-FLAG M2-conjugated agarose beads (Sigma) were incubated with lysates overnight at 4°C. The beads were then washed 3-6 times with cell lysis buffer, and the bound proteins were eluted in SDS buffer and analyzed using Western blotting.
ChIP and ChIP-seq Analysis
ChIP analysis was performed essentially as previously described32. Briefly, cells were crosslinked with 1% formaldehyde for 10 min at room temperature, and the reaction was stopped with 125 mM glycine. Nuclei were isolated by resuspending the cells in swelling buffer containing 5 mM PIPES pH 8.0, 85 mM KCl, 1% NP-40 and a complete protease inhibitor for 20 min at 4°C. The isolated nuclei were resuspended in nuclei lysis buffer (50 mM Tris pH 8.0, 10 mM EDTA, 1% SDS) and sonicated using a Bioruptor Sonicator (Diagenode). Samples were immunoprecipitated with the appropriate antibodies overnight at 4°C. After incubation with Staph A cells for 15 min, immunoprecipitates were washed twice with dialysis buffer (50 mM Tris pH 8.0, 2 mM EDTA, 0.2% Sarkosyl) and four times with IP wash buffer (100 mM Tris pH 8.0, 500 mM LiCl, 1% NP-40, and 1% deoxycholic acid sodium salt). After reverse crosslinking was performed, DNA was eluted, purified using PCR purification kit (Qiagene), and subjected to quantitative real-time PCR on the ABI 7500-FAST System using the Power SYBR Green PCR Master Mix (Applied Biosystems).
ChIP-seq was carried out essentially the same as described above, except using proteinA/G beads instead of Staph A cells for IP. Samples were sequenced using the Illumina Solexa Hiseq 2000. The raw reads were mapped to human reference genome NCBI 36 (hg18) by Solexa data processing pipeline, allowing up to 2 mismatches. The genome ChIP-seq profiles were generated using MACS 1.3.645 with only unique mapped reads. Clonal reads were automatically removed by MACS. The ChIP-seq profiles were normalized to 10,000,000 total tag numbers, and peaks were called at p-values ≤1e-8. For ZMYND11 and H3K36me3 ChIP samples, peaks were annotated by REFSEQ genes that have overlaps within TSS to TTS. For Pol II samples, peaks were annotated by REFSEQ genes that have overlaps within TSS-3K to TTS. The ChIP-seq peaks distribution statistics were performed using the Cis-regulatory element annotation system46. All ChIP-seq data are summarized in Supplementary Table 7
RT-PCR, Northern, real-time PCR, and RNA-seq analysis
RT-PCR (Reverse transcription-PCR) and real-time PCR were performed as previously described32. mRNA was prepared using the RNeasy Plus kit (Qiagen) and reverse-transcribed using the First Strand Synthesis kit (Invitrogen). Northern blotting and hybridization were performed using Northern Max-Gly Kit (Invitrogen) following manufacture instructions. 20 μg total RNA were used for each lane. Quantitative real-time RT-PCR (qRT-PCR) was performed on the ABI 7500-FAST Sequence Detection System using the Power SYBR Green PCR Master Mix (Applied Biosystems). Gene expressions were calculated following normalization to GAPDH levels using the comparative Ct (Cycle threshold) method. Primer sequences are available upon request.
RNA-seq samples were sequenced using the Illumina Hiseq 2000, and raw reads were mapped to human reference genome (hg18) and transcriptome using the RNA-Seq unified mapper47. The reads per kilobase per million (RPKM) expression levels of BS69KD and control were compared using EdgeR. Genes with RPKM < 5 in both the KD and control samples were removed. Genes with a fold change ≥1.5 were selected as differential genes. Gene Ontology analysis was performed using the DAVID Bioinformatics Resource 6.748.
Expression signatures and survival analysis
Survival analyses were performed as described previously30. The database that consists of 13 breast cancer expression profiling datasets from GEO was used in the “consolidated” survival analysis through The Kaplan–Meier plotter central server. Data is loaded into the R statistical environment, where calculations are performed. The package “survival” is used to calculate and plot Kaplan–Meier survival curves, and the number-at-risk is indicated below the main plot. P-values were calculated using logrank test. For data validation, independent analysis of GEO datasets GSE6532 and GSE7390 were performed as previously described49.
Tumor xenograft
All animal studies are in compliance with the ethical regulation at UT MD Anderson Cancer Center. Female athymic nude mice (age 6–8 weeks) were obtained from NCI -Frederick and animals were housed under pathogen-free conditions. 5×10⁶ of MDA-MB 231 cells stably expressing control pQCXIP vector, WT ZMYND11 or mutants were suspended in 100 μl of serum free DMEM and injected subcutaneously onto the mice. The growth of tumors was monitored by weekly examination until the largest tumor reach tumor burden. Tumor sizes were measured using a caliper, and tumor volume was calculated according to the following equation: tumor volume (mm3) = (length (mm) × width (mm)2) × 0.5. Representative data were obtained from five mice per experimental group. Statistical analyses were performed with one-way repeated- measures ANOVA.
Extended Data
Extended Data Figure 1. The PBP domains are required for ZMYND11 binding to H3.3K36me3.

a, Western blot analysis of H3K36me3 levels in calf thymus histones from pulldowns with GST or GST-ZMYND11 PBP. Bottom: GelCode Blue staining of input proteins. b, Electrophoretic mobility shift assay (EMSA) of nucleosomes reconstituted from recombinant H3K36-methyl-lysine analog (MLA) histones incubated with Flag-tagged full-length ZMYND11 proteins. Free DNA, mono nucleosome (Nu), and ZMYND11-bound nucleosome are indicated. c, Western blot analysis of histone peptide pulldowns with GST-ZMYND11 PHD finger. d, ITC curves of the H3.3K36me peptides titrated into ZMYND11 BP domains. e, Western blot analysis of histone peptide pulldowns with Flag-tagged full-length ZMYND11 or the indicated domain-deletion mutants and biotinylated peptides. Schematic of the deletion mutants are shown in the left panel. f, Western blot analysis of protein-ChIP assays using the anti-Flag antibody in HEK 293 cells transfected with Flag-tagged full-length ZMYND11 and the indicated deletion mutants.
Extended Data Figure 2. Crystal structures of ZMYND11 BP domains.
a, Sequence and structure-based secondary structural assignment of the ZMYND11 tandem Bromo-PWWP (BP) domains. Dashed box (magenta) and dashed line (black): unmodeled sequence in the free and complex structures, respectively; Cyan shading: Basic residues within ZA loop (LZA); Magenta shading: residues corresponding to canonical acetyl-lysine recognition motif; Black box: residues mutated to facilitate co-crystal formation. Black dot: aromatic caging residues; Aster: H3 hydrogen bonding residues with magenta unique to H3.3 variant. b, Burial of the K36me3-binding aromatic cage by an adjacent bromodomain during crystal packing. Two acidic residues, D234 and E236, contribute to such packing contacts through electrostatic interaction with the positive surface patch (blue) of PWWP. c, An overall view of superimposed free and H3K36me3 peptide-bound ZMYND11 bromo-PWWP double mutant. d, Western blot analysis of histone peptide pulldowns with WT ZMYND11 PBP and the PBP-D234A/E236A mutant. e. ITC curves of the histone H3.3K36me3 peptide titrated into ZMYND11 BP-D234A/E236A mutant. f. Solvent accessible surface representations of ZYMND11 bromo-ZnF-PWWP in its free state. Note the tight integration of the paired modules. g, Ribbon view of bromo-ZnF-PWWP with basic lysine/arginine clusters highlighted as yellow sticks. h, Superimposition of ZMYND11 bromodomain with H4K16ac-bound BPTF bromodomain (PDB ID: 3QZT). i, Surface representation of BPTF bound to H4K16ac and its comparison with ZMYND11 bromodomain. The Kac pocket is missing in ZMYND11 bromo due to the occurrence of Y231. Note the positive residue clusters around the peptide binding surface of ZMYND11 bromo (right). j, Zinc coordination sphere of the newly identified ZnF motif of ZMYND11. Note the burial of non-zinc-coordinating C274 at the hydrophobic interface between ZnF (salmon) and PWWP (blue) of ZMYND11. k, Encapsulation of ZnF (salmon) by bromo (green) and PWWP (blue) in stereo view. Dashed line denotes hydrogen bonding or zinc coordinating interactions. Note the burial of hydrophobic residues including F262, L264, F273, C274 and Y275 from ZnF at the bromo-ZnF and ZnF-PWWP interfaces. l, Structural alignment of ZMYND11 ZnF-PWWP (salmon and blue) with Pdp1 PWWP (PDB ID: 2L89) (magenta) and BRPF1 PWWP (PDB ID: 2X4W) (cyan) showing the structural overlaps of ZMYND11 ZnF with Pdp1 α3 and BRPF1 β2-β3 insertion.
Extended Data Figure 3. Comparison of ZMYND11 PWWP with other Kme3-binding PWWP domains.

a-b, Stereo view of ZMYND11 PWWP domain in superimposition with H3K36me3-bound BRPF1 PWWP (PDB ID: 2X4W) (a) and H3K79me3-bound HDGF PWWP (PDB ID: 3QJ6) (b). c, Sequence alignment of Kme3-binding PWWP domains. Conserved residues are in blue box; identical residues are shaded in red. Underscored dots: residues forming the aromatic cage. Sequence alignment was produced using the ESPript. d, Western analysis of histone peptide pulldowns with indicated point mutants in the context of Flag-tagged full-length ZMYND11 and biotinylated peptides. e, Western blot analysis of the protein-ChIP assays in cells expressing Flag-tagged full-length ZMYND11 or the indicated mutants. f, Point mutations in ZMYND11 bromo-ZnF-PWWP domains do not affect protein folding. Circular dichroism (CD) spectroscopy analysis of the WT ZMYND11 BP domains and indicated mutants used in this study. g, Steady-state analysis of the biolayer interferometry (BLI) sensorgrams of ZMYND11 BP binding to unmethylated (black square) and fully methylated (blue triangle) 22-mer duplex DNA derived from the Widom 601 sequence. Unmethylated duplex DNA: 5’-CAGCTGAACATCGCTTTTGATG-3’; fully methylated duplex DNA: 5’-CAGCTGAACAT[5medC]GCTTTTGATG-3’.
Extended Data Figure 4. Crystal structure of ZMYND11 BP in complex with H3.1K36me3 and its comparison with the H3.3K36me3-bound complex.

a. ITC curves of H3.3K36me3 or H3.1K36me3 peptides titrated into ZMYND11 BP and PBP domains. Titration c-values are 1.41 for BP-H3.3, 0.15 for BP-H3.1, 1.26 for PBP-H3.3 and 0.16 for PBP-H3.1, respectively. The “n” value was fixed at 1 for curve fitting. b, Western blot analysis of peptide pulldowns under stringent binding condition. c. Western blot analysis of Flag IP in cells co-expressing Flag-H3.3 or H3.1 and Myc-ZMYND11. d, Structure of ZMYND11-BP in complex with H3.1K36me3 peptide. BP is in surface representation with bromo, ZnF and PWWP colored green, salmon, and blue respectively. 2Fo-Fc omit map around H3 peptide, Polyethylene glycol (PEG) and phosphate (PO4) are shown as cyan mesh contoured at 1σ level. e and f, Simulated annealing Fo-Fc omit map countered at 2.5σ level around the histone segments containing H3.1Ala31 (e) or H3.3Ser31(f) in complex with ZMYND11 BP. Residues R168, H250, E251, E254, N266, R268, R309, R317 of BP, a bridging water (Wat), and segment “Ala29-Val35” of histone H3.1 or H3.3 peptides were omitted for simulated annealing (starting temperature 2500 K and 500 cooling steps) map calculation by the program Phenix. Magenta dashes, hydrogen bonds. Note that the Nε atom of R268 side chain (e) and side chains of R168 (e, f) displayed poor densities, suggesting their conformational flexibility. g, Western analysis of histone peptide pulldowns with indicated point mutants and biotinylated peptides. h, Structural alignment of ZMYND11 BP-H3.3K36me3 (blue), ZMYND11 BP-H3.1K36me3 (salmon), and BRPF1 PWWP-H3.1K36me3 (PDB ID: 2X4W)(yellow). i, Structural alignment of H3K36me3-bound ZMYND11 PWWP (blue), PHF19 Tudor (PDB ID: 4BD3) (red) and PHF1 Tudor (PDB ID: 4HCZ) (cyan). Both BP and H3 peptides are presented as backbone coils, with key residues depicted as stick.
Extended Data Figure 5. Analysis of Flag-H3.3 ChIP-seq and ZMYND11 ChIP-seq data.
a, Western blot analysis of U2OS cells stably expressing Flag-H3.3 with the indicated antibodies. The arrow indicates the ectopic Flag-H3.3 protein. b, Average occupancy of Flag-H3.3 along the transcription unit on genes with high, intermediate, and low expression levels. The gene expression levels were grouped according to the RNA-seq RPKM value as low (<1), medium (1-20), or high (>20). The gene body length is aligned by percentage from the TSS to TTS as in Fig. 3b. c, Western analysis of ZMYND11 protein and H3K36me3 levels in control and ZMYND11 knockdown U2OS cells. The asterisk indicates a non-specific band. d, Genome browser view of ZMYND11 occupancy in the chromosome 16p13.3 regions (as shown in Fig. 3d) in control and ZMYND11 knockdown cells. e, The average genome-wide occupancy of ZMYND11 along the transcription unit in cells as in d. f, qPCR analysis of ZMYND11 ChIP in the gene bodies of the indicated genes in cells as in c. Error bars: s.e.m. of three experiments. P<0.01 (Student t-test). g, qPCR analysis of Flag ChIP in cells stably expressing Flag-ZMYND11 and control U2OS cells. Error bars indicate the s.e.m. of three independent experiments.
Extended Data Figure 6. ZMYND11 occupancy in gene body depends on SETD2-mediated H3K36me3.

a, Average genome-wide ZMYND11 occupancy on genes with high, intermediate, or low levels of H3K36me3. Genes were aligned as described in Fig. 3b, and were grouped according to the H3K36me3 ChIP-seq normalized tag numbers as low (<2), intermediate (2-10), or high (>10). ZMYND11 ChIP-seq occupancies were normalized to 10 million total tag numbers. b, qPCR analysis of the expression of ZMYND11 target genes and SETD2 in control and SETD2 knockdown cells. c, Western blot analysis of H3K36me3 and ZMYND11 levels in SETD2 knockdown cells. Asterisks indicate non-specific bands. Bottom panel: Western blot analysis of Flag-SETD2-expressing cells cotransfected with SETD2-targeting shRNAs using the M2 anti-Flag antibody, indicating efficient knockdowns. d, qPCR analysis of the ZMYND11 and H3K36me3 ChIP in the intragenic regions of NFKB2 gene in control and SETD2 knockdown cells. e, Western blot analysis of NSD2 and H3K36me2 in NSD2 knockdown cells. f, qPCR analysis of H3K36me2, H3K36me3 and ZMYND11 ChIP in MYC and NFKB2 genes in NSD2 knockdown cells. g, Western blot analysis of ZMYND11 expression levels in U2OS cells stably expressing the WT ZMYND11 and the indicated H3.3K36me3 binding-deficient mutants. h, qPCR analysis of Flag ChIP in NFKB2 gene in cells as in g. in b,d,f,h, error bars indicate the s.e.m. of three independent experiments. *: all p values <0.05 (Student t-test).
Extended Data Figure 7. ZMYND11 has a role in both transcriptional activation and repression.

a, Western blot analysis of ZMYND11 and MYC protein levels in control and ZMYND11 knockdown cells. The asterisk indicates a non-specific band. b, qPCR analysis of the expression of ZMYND11 and ZMYND11 target genes in control and ZMYND11 knockdown U2OS cells. Signals were normalized to GAPDH expression. Error bars represent the s.e.m. of three experiments. *: Two-tailed unpaired Student t-test, p <0.01. c. No cryptic transcripts observed in ZMYND11 knockdown cells. Northern blot analysis of indicated ZMYND11 direct target genes on the total RNA extracted from control and ZMYND11 knockdown U2OS cells. GAPDH was used as a loading control.
Extended Data Figure 8. ZMYND11 knockdown increases the occupancies of total Pol II and Pol II S2P in gene bodies.

a, Venn diagram showing the overlap of ZMYND11- and Pol II-occupied genes. P < 1e-322 (Fisher’s exact test). A comprehensive list of Pol II ChIP-seq peaks is given in Supplementary Table 6. b, Average genome-wide ZMYND11 occupancy on genes with high, intermediate, and low levels of Pol II occupancy. Genes were aligned as described in 3b, and were grouped according to the Pol II ChIP-seq normalized tag numbers as low (<2), intermediate (2-10), or high (>10). ZMYND11 ChIP-seq occupancies were normalized to 10 million total tag numbers. c. Average genome-wide occupancies of Pol II along the transcription unit of all ZMYND11-activated direct target genes (left) and all non-ZMYND11 target genes (right) in control and ZMYND11 knockdown cells as in Fig. 4e. d, Average genome-wide occupancies of Pol II S2P near the TTS of all ZMYND11-repressed direct target genes in control and ZMYND11 knockdown cells. e, qPCR analysis of the ZMYND11, H3K36me3 and Pol II S2P ChIP in the intragenic regions of MYC and NFKB2 gene in control and ZMYND11 knockdown cells. f, Pol II traveling ratio (TR) on ZMYND11-repressed direct target genes in control and ZMYND11 knockdown cells. Lower TR values indicate a higher degree of elongating Pol II. The left panel shows the schematic representation of the calculation of Pol II TR21. The right panel shows the whisker plot of Pol II TR. P= 2.5e-5 (Student’s t-test).
Extended Data Figure 9. ZMYND11 suppresses tumor cell growth and is downregulated and mutated in human cancers.
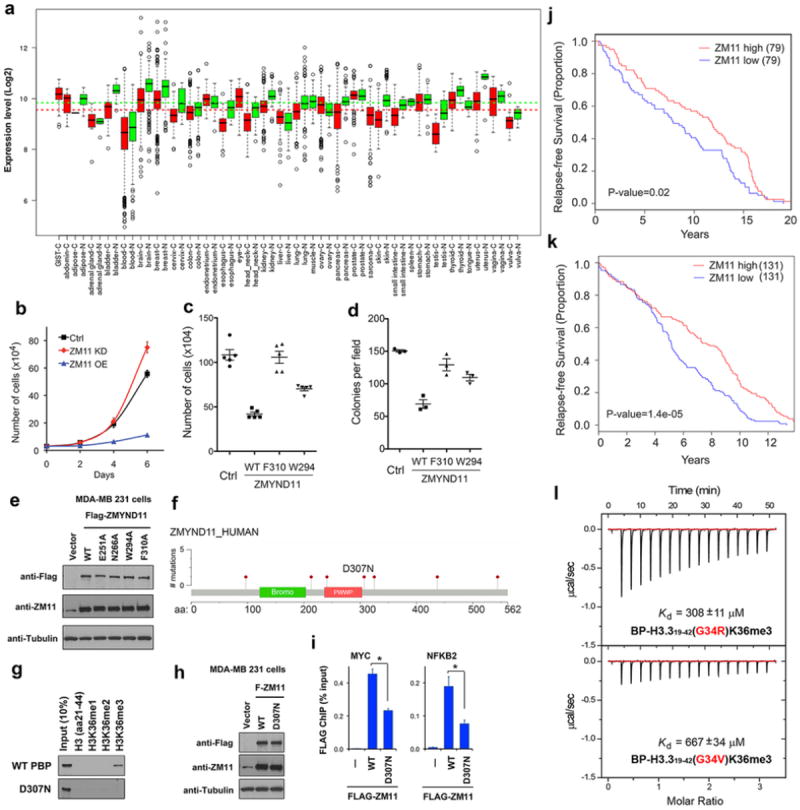
a, ZMYND11 is downregulated in cancers. ZMYND11 gene expression in ~40,000 tumor or normal tissue samples from three data sets (Gene Expression Omnibus, ArrayExpress, and Expression Project for Oncology) were analyzed using GENT. N: normal; C: cancer. All p values < 0.0001. b, Cell proliferation assay of U2OS cells (mean ± s.e.m., n=3) with knockdown (KD) or overexpression (OE) of ZMYND11. c, Cell proliferation assay of U2OS cells stably expressing the WT or mutant ZMYND11 proteins (mean ± s.e.m., n=5). Cells were counted 6 days after seeding. d, Colony formation assay of cells as in c. Cell colonies (mean ± s.e.m., n=3) were counted 2 weeks after seeding. e, Western blot analysis of ZMYND11 expression levels in stable MDA-MB 231 cells used in Fig. 4f, g. f, Schematic representation of ZMYND11 missense somatic mutations in colon and rectum adenocarcinoma identified in TCGA database. g, Peptide pulldowns of WT ZMYND11 PBP and the D307N mutant with H3.3K36me peptides. h, Western blot analysis of Flag-tagged WT ZMYND11 and the D307N mutant stably expressed in MDA-MB 231 cells. i, qPCR analysis of Flag ChIP in MYC and NFKB2 genes in the stable cells as in g. Error bars indicate the s.e.m. of three independent experiments *: p <0.01 (Student t-test). j, k. Low ZMYND11 expression levels in breast cancer patients correlate with worse disease-free survival. Kaplan-Meier survival curves of breast cancer patients from cohort studies NIH GEO GSE6532 (j) and GSE7390 (k). P-values were calculated by chi-square test. l, ITC curves of the histone H3.3(G34R)K36me3 and H3.3(G34V)K36me3 peptides titrated into ZMYND11 BP domains.
Extended Data Table 1.
Data collection and refinement statistics.
| BP Free‡ (Zn-SAD) | BP (D234A/E236A) H3.3 (19-42)K36me3 | BP (D234A/E236A) H3.1 (21-42)K36me3 | |
|---|---|---|---|
| Data Collection | |||
| Space group | P212121 | P43212 | P43212 |
| Cell dimensions | |||
| a, b, c (Å) | 54.9, 64.3, 75.6 | 64.0, 64.0, 123.0 | 64.4, 64.4, 122.1 |
| α, β, γ (°) | 90, 90, 90 | 90, 90, 90 | 90, 90, 90 |
| Resolution (Å) | 31-1.95(1.98-1.95)* | 37-2.0 (2.03-2.00)* | 37-2.3 (2.34-2.30)*, § |
| Unique reflections | 37810 (1878) | 18042 (867) | 11677 (567) |
| Rsym (%) | 8.1 (78.6) | 11.2 (82.8) | 9.9 (76.9) |
| I/σI | 27.4 (2.4) | 25.2 (3.9) | 31.8 (4.9) |
| Completeness (%) | 100 (100) | 99.9 (100) | 97.4 (100) |
| Redundancy | 6.3 (6.1) | 11.7 (11.9) | 11.4 (11.9) |
| Refinement | |||
| Resolution (Å) | 31-1.95 | 37-2.0 | 37-2.3 |
| No. reflections | 37651 | 17984 | 11605 |
| Rwork/Rfree | 0.188/0.226 | 0.199/0.245 | 0.206/0.263 |
| No. atoms | |||
| Protein | 1756 | 1611 | 1579 |
| Ligand/ion† | 1/5 | 78/1/5/7 | 77/1/5/7 |
| Water | 167 | 116 | 55 |
| B-factors (Å2) | |||
| Protein | 31.6 | 35.6 | 41.0 |
| Ligand/ion | 28.9/43.9 | 32.2/25.4/40.0/40.1 | 38.2/31.1/65.2/50.5 |
| Water | 33.1 | 36.0 | 36.3 |
| R.m.s. deviations | |||
| Bond lengths (Å) | 0.005 | 0.008 | 0.003 |
| Bond angles (°) | 0.92 | 1.18 | 0.69 |
One crystal was used for each structure.
Highest resolution shell is shown in parenthesis.
Ligand/ions are zinc and phosphate for free BP; and peptide, zinc, phosphate, PEG for BP complexes.
Data processing and refinement statistics in this column are based on anomalous scaling.
A high-resolution cutoff at 2.3 Å was made due to ice ring.
Supplementary Material
Acknowledgments
We thank J. Lipsick, Y. Shi, P. Chi, C.D. Allis, D.J. Patel, S.R. Dent, J. Tyler, M. Galko, T. Westbrook, M. Lee, T. Yao and E. Guccione for comments and reagents. We thank the staffs at beamlines 1W2B of the Beijing Synchrotron Radiation Facility and BL17U of the Shanghai Synchrotron Radiation Facility for their assistance in data collection. We thank Joseph Munch for editing the manuscript. This work was supported by grants to X.S. (CPRIT RP110471, Welch G1719, American Cancer Society RSG-13-290-01-TBE, and NIH/MDACC CCSG CA016672), H.L. (The Major State Basic Research Development Program in China, 2011CB965300 and Program for New Century Excellent Talents in University), W.L. (CPRIT RP110471, NIH R01HG007538), B.L. (NIH R01GM090077, Welch I1713), Y.L. (China Postdoctoral Science Foundation, 2012M510413), and H.W. (MD Anderson IRG, Center for Cancer Epigenetics pilot grant). W.L. is a recipient of a Duncan Scholar Award and X.S. is a recipient of a Kimmel Scholar Award.
Footnotes
Author Contributions
H.W., H.L. and X.S. conceived this study. H.W. performed the biochemical and cellular studies; Y.L. and H.L. performed structural and calorimetric studies; Y.X. and Z.X. performed bioinformatic analysis; S. J and S. S. performed xenograft study; D.P., K.T. and Y.R. provided technical assistance; J.W. and B. L. performed nucleosome binding experiments; X.S., H.L., H.W., W.L. and M.C.B analyzed data and wrote the paper.
Supplementary Information is linked to the online version of the paper at www.nature.com/nature.
The authors declare no competing financial interest.
Structure data are deposited in PDB with the accession numbers of 4N4G (free BP), 4N4H (BP-H3.1K36me3 complex), and 4N4I (BP-H3.3K36me3 complex). The ChIP-seq and RNA-seq data are deposited in the GEO database with the accession number of GSE48423.
References
- 1.Ruthenburg AJ, Li H, Patel DJ, Allis CD. Multivalent engagement of chromatin modifications by linked binding modules. Nat Rev Mol Cell Biol. 2007;8:983–994. doi: 10.1038/nrm2298. [DOI] [PMC free article] [PubMed] [Google Scholar]
- 2.Venkatesh S, et al. Set2 methylation of histone H3 lysine 36 suppresses histone exchange on transcribed genes. Nature. 2012;489:452–455. doi: 10.1038/nature11326. [DOI] [PubMed] [Google Scholar]
- 3.Elsaesser SJ, Goldberg AD, Allis CD. New functions for an old variant: no substitute for histone H3.3. Curr Opin Genet Dev. 2010;20:110–117. doi: 10.1016/j.gde.2010.01.003. [DOI] [PMC free article] [PubMed] [Google Scholar]
- 4.Hateboer G, et al. BS69, a novel adenovirus E1A-associated protein that inhibits E1A transactivation. EMBO J. 1995;14:3159–3169. doi: 10.1002/j.1460-2075.1995.tb07318.x. [DOI] [PMC free article] [PubMed] [Google Scholar]
- 5.Ladendorff NE, Wu S, Lipsick JS. BS69, an adenovirus E1A-associated protein, inhibits the transcriptional activity of c-Myb. Oncogene. 2001;20:125–132. doi: 10.1038/sj.onc.1204048. [DOI] [PubMed] [Google Scholar]
- 6.Wei G, Schaffner AE, Baker KM, Mansky KC, Ostrowski MC. Ets-2 interacts with co-repressor BS69 to repress target gene expression. Anticancer Res. 2003;23:2173–2178. [PubMed] [Google Scholar]
- 7.Dhayalan A, et al. The Dnmt3a PWWP domain reads histone 3 lysine 36 trimethylation and guides DNA methylation. J Biol Chem. 285:26114–26120. doi: 10.1074/jbc.M109.089433. [DOI] [PMC free article] [PubMed] [Google Scholar]
- 8.Vezzoli A, et al. Molecular basis of histone H3K36me3 recognition by the PWWP domain of Brpf1. Nat Struct Mol Biol. 2010;17:617–619. doi: 10.1038/nsmb.1797. [DOI] [PubMed] [Google Scholar]
- 9.Wu H, et al. Structural and histone binding ability characterizations of human PWWP domains. PLoS One. 2011;6:e18919. doi: 10.1371/journal.pone.0018919. [DOI] [PMC free article] [PubMed] [Google Scholar]
- 10.Qiu C, Sawada K, Zhang X, Cheng X. The PWWP domain of mammalian DNA methyltransferase Dnmt3b defines a new family of DNA-binding folds. Nat Struct Biol. 2002;9:217–224. doi: 10.1038/nsb759. [DOI] [PMC free article] [PubMed] [Google Scholar]
- 11.Spruijt CG, et al. Dynamic readers for 5-(hydroxy)methylcytosine and its oxidized derivatives. Cell. 2013;152:1146–1159. doi: 10.1016/j.cell.2013.02.004. [DOI] [PubMed] [Google Scholar]
- 12.Eidahl JO, et al. Structural basis for high-affinity binding of LEDGF PWWP to mononucleosomes. Nucleic Acids Research. 2013;41:3924–3936. doi: 10.1093/nar/gkt074. [DOI] [PMC free article] [PubMed] [Google Scholar]
- 13.van Nuland R, et al. Nucleosomal DNA binding drives the recognition of H3K36-methylated nucleosomes by the PSIP1-PWWP domain. Epigenet Chromatin. 2013;6 doi: 10.1186/1756-8935-6-12. [DOI] [PMC free article] [PubMed] [Google Scholar]
- 14.Wallace AC, Laskowski RA, Thornton JM. LIGPLOT: a program to generate schematic diagrams of protein-ligand interactions. Protein engineering. 1995;8:127–134. doi: 10.1093/protein/8.2.127. [DOI] [PubMed] [Google Scholar]
- 15.Li Y, Li H. Many keys to push: diversifying the ‘readership’ of plant homeodomain fingers. Acta Biochim Biophys Sin (Shanghai) 2012;44:28–39. doi: 10.1093/abbs/gmr117. [DOI] [PubMed] [Google Scholar]
- 16.Barski A, et al. High-resolution profiling of histone methylations in the human genome. Cell. 2007;129:823–837. doi: 10.1016/j.cell.2007.05.009. [DOI] [PubMed] [Google Scholar]
- 17.Goldberg AD, et al. Distinct factors control histone variant H3.3 localization at specific genomic regions. Cell. 2010;140:678–691. doi: 10.1016/j.cell.2010.01.003. [DOI] [PMC free article] [PubMed] [Google Scholar]
- 18.Jin C, et al. H3.3/H2A.Z double variant-containing nucleosomes mark ‘nucleosome-free regions’ of active promoters and other regulatory regions. Nat Genet. 2009;41:941–945. doi: 10.1038/ng.409. [DOI] [PMC free article] [PubMed] [Google Scholar]
- 19.Ray-Gallet D, et al. Dynamics of histone H3 deposition in vivo reveal a nucleosome gap-filling mechanism for H3.3 to maintain chromatin integrity. Mol Cell. 2011;44:928–941. doi: 10.1016/j.molcel.2011.12.006. [DOI] [PubMed] [Google Scholar]
- 20.Edmunds JW, Mahadevan LC, Clayton AL. Dynamic histone H3 methylation during gene induction: HYPB/Setd2 mediates all H3K36 trimethylation. EMBO J. 2008;27:406–420. doi: 10.1038/sj.emboj.7601967. [DOI] [PMC free article] [PubMed] [Google Scholar]
- 21.Kuo AJ, et al. NSD2 Links Dimethylation of Histone H3 at Lysine 36 to Oncogenic Programming. Molecular Cell. 2011;44:609–620. doi: 10.1016/j.molcel.2011.08.042. [DOI] [PMC free article] [PubMed] [Google Scholar]
- 22.Rahl PB, et al. c-Myc Regulates Transcriptional Pause Release. Cell. 2010;141:432–445. doi: 10.1016/j.cell.2010.03.030. [DOI] [PMC free article] [PubMed] [Google Scholar]
- 23.Danko CG, et al. Signaling Pathways Differentially Affect RNA Polymerase II Initiation, Pausing, and Elongation Rate in Cells. Mol Cell. 2013;50:212–222. doi: 10.1016/j.molcel.2013.02.015. [DOI] [PMC free article] [PubMed] [Google Scholar]
- 24.Sims RJ, 3rd, Belotserkovskaya R, Reinberg D. Elongation by RNA polymerase II: the short and long of it. Genes Dev. 2004;18:2437–2468. doi: 10.1101/gad.1235904. [DOI] [PubMed] [Google Scholar]
- 25.Ansieau S, Sergeant A. BS69 and RACK7, a potential novel class of tumor suppressor genes. Pathol Biol. 2003;51:397–399. doi: 10.1016/s0369-8114(03)00019-1. [DOI] [PubMed] [Google Scholar]
- 26.Schwartzentruber J, et al. Driver mutations in histone H3.3 and chromatin remodelling genes in paediatric glioblastoma. Nature. 2012;482:226–231. doi: 10.1038/nature10833. [DOI] [PubMed] [Google Scholar]
- 27.Sturm D, et al. Hotspot mutations in H3F3A and IDH1 define distinct epigenetic and biological subgroups of glioblastoma. Cancer Cell. 2012;22:425–437. doi: 10.1016/j.ccr.2012.08.024. [DOI] [PubMed] [Google Scholar]
- 28.Lewis PW, et al. Inhibition of PRC2 activity by a gain-of-function H3 mutation found in pediatric glioblastoma. Science. 2013;340:857–861. doi: 10.1126/science.1232245. [DOI] [PMC free article] [PubMed] [Google Scholar]
- 29.Bjerke L, et al. Histone H3.3 Mutations Drive Pediatric Glioblastoma through Upregulation of MYCN. Cancer Discov. 2013 doi: 10.1158/2159-8290.CD-12-0426. [DOI] [PMC free article] [PubMed] [Google Scholar]
- 30.Gyorffy B, et al. An online survival analysis tool to rapidly assess the effect of 22,277 genes on breast cancer prognosis using microarray data of 1,809 patients. Breast cancer research and treatment. 2010;123:725–731. doi: 10.1007/s10549-009-0674-9. [DOI] [PubMed] [Google Scholar]
- 31.Shi X, et al. ING2 PHD domain links histone H3 lysine 4 methylation to active gene repression. Nature. 2006;442:96–99. doi: 10.1038/nature04835. [DOI] [PMC free article] [PubMed] [Google Scholar]
- 32.Wen H, et al. Recognition of histone H3K4 trimethylation by the plant homeodomain of PHF2 modulates histone demethylation. J Biol Chem. 2010;285:9322–9326. doi: 10.1074/jbc.C109.097667. [DOI] [PMC free article] [PubMed] [Google Scholar]
- 33.Fish P, et al. Identification of a chemical probe for BET bromodomain inhibition through optimization of a fragment-derived hit. J Med Chem. 2012 doi: 10.1021/jm3010515. [DOI] [PMC free article] [PubMed] [Google Scholar]
- 34.Mendez J, Stillman B. Chromatin association of human origin recognition complex, cdc6, and minichromosome maintenance proteins during the cell cycle: assembly of prereplication complexes in late mitosis. Mol Cell Biol. 2000;20:8602–8612. doi: 10.1128/mcb.20.22.8602-8612.2000. [DOI] [PMC free article] [PubMed] [Google Scholar]
- 35.Li B, et al. Combined action of PHD and chromo domains directs the Rpd3S HDAC to transcribed chromatin. Science. 2007;316:1050–1054. doi: 10.1126/science.1139004. [DOI] [PubMed] [Google Scholar]
- 36.Simon MD, et al. The site-specific installation of methyl-lysine analogs into recombinant histones. Cell. 2007;128:1003–1012. doi: 10.1016/j.cell.2006.12.041. [DOI] [PMC free article] [PubMed] [Google Scholar]
- 37.Zeitlinger J, et al. RNA polymerase stalling at developmental control genes in the Drosophila melanogaster embryo. Nat Genet. 2007;39:1512–1516. doi: 10.1038/ng.2007.26. [DOI] [PMC free article] [PubMed] [Google Scholar]
- 38.Boettiger AN, Levine M. Synchronous and stochastic patterns of gene activation in the Drosophila embryo. Science. 2009;325:471–473. doi: 10.1126/science.1173976. [DOI] [PMC free article] [PubMed] [Google Scholar]
- 39.Nechaev S, Adelman K. Promoter-proximal Pol II: when stalling speeds things up. Cell Cycle. 2008;7:1539–1544. doi: 10.4161/cc.7.11.6006. [DOI] [PubMed] [Google Scholar]
- 40.Naar AM, Lemon BD, Tjian R. Transcriptional coactivator complexes. Annu Rev Biochem. 2001;70:475–501. doi: 10.1146/annurev.biochem.70.1.475. [DOI] [PubMed] [Google Scholar]
- 41.Luo Z, Lin C, Shilatifard A. The super elongation complex (SEC) family in transcriptional control. Nat Rev Mol Cell Biol. 2012;13:543–547. doi: 10.1038/nrm3417. [DOI] [PubMed] [Google Scholar]
- 42.Turnbull WB, Daranas AH. On the value of c: Can low affinity systems be studied by isothermal titration calorimetry? Journal of the American Chemical Society. 2003;125:14859–14866. doi: 10.1021/ja036166s. [DOI] [PubMed] [Google Scholar]
- 43.Lowary PT, Widom J. New DNA sequence rules for high affinity binding to histone octamer and sequence-directed nucleosome positioning. J Mol Biol. 1998;276:19–42. doi: 10.1006/jmbi.1997.1494. [DOI] [PubMed] [Google Scholar]
- 44.Abmayr SM, Yao T, Parmely T, Workman JL. Preparation of nuclear and cytoplasmic extracts from mammalian cells. Curr Protoc Mol Biol. 2006;Chapter 12(Unit 12):11. doi: 10.1002/0471142727.mb1201s75. [DOI] [PubMed] [Google Scholar]
- 45.Zhang Y, et al. Model-based analysis of ChIP-Seq (MACS) Genome Biol. 2008;9:R137. doi: 10.1186/gb-2008-9-9-r137. [DOI] [PMC free article] [PubMed] [Google Scholar]
- 46.Eswaran J, et al. Structure and functional characterization of the atypical human kinase haspin. Proc Natl Acad Sci U S A. 2009;106:20198–20203. doi: 10.1073/pnas.0901989106. [DOI] [PMC free article] [PubMed] [Google Scholar]
- 47.Akue-Gedu R, et al. Synthesis, kinase inhibitory potencies, and in vitro antiproliferative evaluation of new Pim kinase inhibitors. J Med Chem. 2009;52:6369–6381. doi: 10.1021/jm901018f. [DOI] [PubMed] [Google Scholar]
- 48.Barr AJ, et al. Large-scale structural analysis of the classical human protein tyrosine phosphatome. Cell. 2009;136:352–363. doi: 10.1016/j.cell.2008.11.038. [DOI] [PMC free article] [PubMed] [Google Scholar]
- 49.Kessler JD, et al. A SUMOylation-dependent transcriptional subprogram is required for Myc-driven tumorigenesis. Science. 2012;335:348–353. doi: 10.1126/science.1212728. [DOI] [PMC free article] [PubMed] [Google Scholar]
Associated Data
This section collects any data citations, data availability statements, or supplementary materials included in this article.