

Abstract
In this study we selected three breast cancer cell lines (SKBR3, SUM149 and SUM190) with different oncogene expression levels involved in ERBB2 and EGFR signaling pathways as a model system for the evaluation of selective integration of subsets of transcriptomic and proteomic data. We assessed the oncogene status with RPKM values (Reads Per Kilobase per Million mapped reads1) for ERBB2 (14.4, 400 and 300 for SUM149, SUM 190 and SKBR3 respectively and for EGFR 60.1, not detected and 1.4 for the same 3 cell lines. We then used RNA-Seq data to identify those oncogenes with significant transcript levels in these cell lines (total 31) and interrogated the corresponding proteomics data sets for proteins with significant interaction values with these oncogenes. The number of observed interactors for each oncogene showed a significant range, e.g. 4.2% (JAK1) to 27.3% (MYC). The percentage is measured as a fraction of the total protein interactions in a given data set vs. total interactors for that oncogene in STRING (Search Tool for the Retrieval of Interacting Genes/Proteins, version 9.0) and I2D (Interologous Interaction Database, version 1.95). This approach allowed us to focus on 4 main oncogenes, ERBB2, EGFR, MYC, and GRB2, for pathway analysis. We used the following bioinformatics sites, GeneGo, PathwayCommons and NCI receptor signaling networks to identify pathways which contained the four main oncogenes, had good coverage in the transcriptomic and proteomic data sets as well as significant number of oncogene interactors. The four pathways identified were ERBB signaling, EGFR1 signaling, integrin outside-in signaling, and validated targets of C-MYC transcriptional activation. The greater dynamic range of the RNA-Seq values allowed the use of transcript ratios to correlate observed protein values with the relative levels of the ERBB2 and EGFR transcripts in each of the four pathways. This provided us with potential proteomic signatures for the SUM149 and 190 cell lines, growth factor receptor-bound protein 7 (GRB7), Crk-like protein (CRKL) and Catenin delta-1 (CTNND1) for ERBB signaling, caveolin 1 (CAV1), plectin (PLEC) for EGFR signaling; filamin A (FLNA) and actinin alpha1 (ACTN1) (associated with high levels of EGFR transcript) for integrin signalings: branched chain amino-acid transaminase 1 (BCAT1), carbamoyl-phosphate synthetase (CAD), nucleolin (NCL) (high levels of EGFR transcript); transferrin receptor (TFRC), metadherin (MTDH) (high levels of ERBB2 transcript) for MYC signaling; S100-A2 protein (S100A2), caveolin 1 (CAV1), Serpin B5 (SERPINB5), stratifin (SFN), PYD and CARD domain containing (PYCARD), and EPH receptor A2 (EPHA2) for PI3K signaling, p53 sub-pathway. Future studies of inflammatory breast cancer (IBC), from which the cell lines were derived, will be used to explore the significance of these observations.
INTRODUCTION
Breast cancer is a major health problem with over 40,000 deaths each year in the US2. We have previously studied proteomics and glycoproteomics in samples collected from breast cancer patients2–4 as potential markers for the early detection of breast cancer. As an extension of these studies, we report in this manuscript on a study of protein expression as measured by both RNA-Seq1 and proteomics of two cell lines established from primary inflammatory breast cancer (IBC) tumors5, namely SUM149 and SUM190, which are ER (−) and PR (−) as well as the well-studied cell line SKBR3 that is known to express high levels of ERBB2 and is ER (−) and PR (−).
EGFR and ERBB2 are members of the epidermal growth factor receptor (EGFR) family, one of 20 subfamilies of human receptor tyrosine kinases (RTK)6. The EGF family is one of the best studied growth factor receptor systems, often over expressed in human tumors7–9. Several small molecule inhibitors and protein drugs have been developed to modulate disorders in the EGFR family10–11. Moreover, determination of ERBB2 status by immunohistochemistry (IHC) or Fluorescent in-situ hybridization (FISH) has been recommended by the American Society of Clinical Oncology (ASCO) as a marker for diagnosis and evaluation in primary invasive breast cancer12. Initially we will describe the analysis of the RNA-Seq data to determine the presence or absence of oncogenes typically associated with breast cancer as well as the levels of the target oncogenes ERBB2 and EGFR. These studies demonstrated the importance of EGFR and ERBB family members in the cell lines, as well as other oncogenes such as TP53, CRKL, EZR and MYC. We then explored different approaches to integrate the proteomic information with the transcriptome data and compared the proteomic levels as measured by spectral count with the transcript level as well as interaction values of the observed proteins with the panel of oncogenes. These comparisons highlighted the 4 oncogenes, namely EGFR, ERBB2, MYC and GRB2 and allowed the identification of protein based sub pathways of interest for the different cell lines.
MATERIALS AND METHODS
2.1 Cell lines, Cell Lysis and In-gel Digestion
Cell Lines SKBR3, SUM149 and SUM190
The human breast cancer cell lines SKBR3 (ER/PR−, HER2+, metastatic pleural effusion), was obtained from the American Type Culture Collection (Manassas, VA) and maintained in culture with DMEM/F-12 medium supplemented with 10% FBS (Tissue Culture Biologicals, Seal Beach, CA) and 1% of Antibiotic-Antimycotic 100X (Gibco, Carlsbad, CA).
SUM149 and SUM190 cells were obtained from Dr. Stephen Ethier (Kramanos Institute, MI, USA) and are commercially available (Asterand, Detroit, MI). SUM149 cells are ER/PR−, HER2− (triple receptors negative) and the SUM190 cells are ER/PR−, HER2+. Both human IBC cell lines were maintained in culture with Ham’s/F-12 medium supplemented with % FBS (Tissue Culture Biologicals, Seal Beach, CA), 5 μg/mL insulin, 1 μg/mL hydrocortisone and 1% of Antibiotic-Antimycotic 100X (Gibco, Carlsbad, CA).
Twenty μL of lysis buffer (2% SDS in 50 mM NH4CO3) was added to 10 μL cell lysate. Cells were solubilized by sonication using 20s bursts, followed by cooling on ice for 20s, in a process that was repeated for 10 times. The entire extract was concentrated down to 15 μL in a speed vacuum, and loaded onto a gel (SDS-PAGE, 4–12% gradient) to separate proteins by molecular weight. After staining with Coomassie blue, each gel lane was cut into five individual slices as shown in Supplementary Figure S1.
Each slice was further minced into smaller pieces (approximately 0.5 mm2). The gel slices were washed with 600 mL water for 15 mins and centrifuged, supernatant removed and 50% ACN was added (1 mL), followed by shaking until no visible Coomassie stain remained. Proteins were then reduced with dithiothreitol (DTT) by adding 250 μL 10 mM DTT in 0.1 M NH4CO3 and incubated for 30 mins at 56°C. Samples were subsequently alkylated at room temperature and in the dark for 80 mins with 250 μL of 55 mM iodoacetamide (IAA) in 0.1 M NH4CO3. Trypsin digestion reagent (200 μL; 10 ng/mL trypsin in 50 mM NH4CO3, pH 8.0) was added, and samples were incubated for 30 min at 4°C. The trypsin concentration was based upon an estimate of approximately 0.1 – 0.5 mg protein per gel slice and adjusted as necessary. The solution was then replaced with 50 mM NH4CO3 to cover the gel pieces (50 μL) and incubated overnight at 37°C to elute peptides from the gel. Following this step, supernatant was removed and stored. Gel pieces were further extracted with 5% formic acid (30 μL) and acetonitrile (ACN, 400 μL) at 37°C for 10 mins and then twice with 5% formic acid (30 μL) and ACN (200 μL). The formic acid solution containing tryptic peptides was combined with the previous supernatant and concentrated to 5–10 μL. The concentrated solution (trypsin-digested peptides) was subjected to LC-MS analysis.
2.2 LTQ-FT MS
The in-gel digested peptides were analyzed by online LC using a linear IT coupled to a Fourier transfer mass spectrometer (LTQ-FT MS, Thermo Electron, San Jose, CA) with a Dionex nano-LC instrument (Ultimate 3000, Sunnyvale, CA) and a 75 mm i.d. × 15 cm C-18 capillary column packed with Magic C18 (3 mm, 200 Å pore size) (Michrom Bioresources, Auburn, CA). The LTQ-FT mass spectrometer was operated in the data-dependent mode to switch automatically between MS and MS/MS acquisition. Survey full-scan MS spectra with two microscans (m/z 400–2000) were acquired in the Fourier transform ion cyclotron resonance cell with a mass resolution of 100 000 at m/z 400 (after accumulation to a target value of 2 × 10⁶ ions in the linear IT), followed by ten sequential LTQ-MS/MS scans throughout the 90 min separation. The analytical separation was carried out using a three-step linear gradient, starting from 2% B to 40% B in 40 min (A: water with 0.1% formic acid; B: ACN with 0.1% formic acid), increased to 60% B in 10 min, and then to 80% B in 5 min. The column flow rate was maintained at 200 nL/min.
2.3 Protein Identification
Peptide sequences were identified using Thermo Proteome Discoverer 1.3 from a human database SP.human.56.5 with full trypsin specificity and up to three internal missed cleavages. The tolerance was 50 ppm for precursor ions and 0.8 Da for product ions. Dynamic modifications were deamidation of asparagine, and static modification was carbamidomethylation for cysteine. Peptides were identified with Xcorr scores above the following thresholds: ≥3.8 for 3+ and higher charge state ions, ≥2.2 for 2+ ions, and ≥1.9 for 1+ ions.
We used the spectral count approach to measure relative abundance of protein samples as reported by Choi et al13. We have selected several housekeeping proteins, glyceraldehyde-3-phosphate dehydrogenase (GAPDH), b-actin (ACTB), b-tubulins (2A, 2B, 2C, 3 and 5)14, which are ubiquitously expressed in a wide range of tissues and cell types15, as internal standards for relative quantification in order to minimize variations in the amount of samples loaded on the 1D SDS-PAGE gel. These proteins met the required criteria of high abundance and consistent ratios across the 3 cell lines, as measured by peptide counts and extracted ions in the same gel section between the different cell lines.
The protein list also was submitted to the Gene A La Cart (provided by www.genecards.com, uploaded to Gene A La Cart for analysis in August, 2011) to acquire data for bioinformatics analysis, including gene symbols and other genomic information.
2.3 RNA-Seq Measurement
Strand-specific RNA-Seq libraries were prepared and sequenced on a lane of the Illumina HiSeq 2000 instrument per sample to obtain transcript data16. All RNA-Seq data are available at Short Read Archive (SRS366582, SRS366583, SRS366584, SRS366609, SRS366610, SRS366611).
From total RNA, strand-specific RNA-Seq libraries were prepared according to Illumina TruSeq standard procedures and sequenced at both ends (paired-end RNA-sequencing) on Illumina HiSeq 2000. Tophat embedded with Bowtie was used to align the sequence reads to human genome (hg19). Using Cufflinks, the alignments were assembled into gene transcripts (NCBI build 37.2) and their relative abundances (RPKM) were calculated.
RESULTS AND DISCUSSION
We have previously studied on the role of two driver oncogenes, EGFR, ERBB2, in epithelial cancers17–18 and have investigated the changes in their glycosylation patterns2–4, 19. To further expand on our previous observations, we have performed a comparative study to explore the total lysate proteome of a well-established epithelial breast cancer cell line, SKBR3, which overexpresses ERBB2 and two primary cell lines (SUM149 and SUM190) isolated from patients with inflammatory breast cancer5. We have employed a traditional proteomic analysis of the data and compared these results with an alternative format, namely genome-wide proteomics using the chromosome format (C-HPP20), which is being developed as part of the HUPO human proteome initiative. One benefit of such approach is the facile integration of proteomic and transcriptomics data as well as allowing for the identification of genomic regions in which a driver oncogene may effect gene transcription of adjacent genes.
a) Analysis of Cell Lines SKBR3, SUM149 and SUM190
Each cell line was analyzed in triplicate and relative quantitation was achieved with spectral counts using a correction factor based on housekeeping proteins. With the availability of a deep measurement of the transcriptome, by RNA-Seq (100 million reads), it is common to measure 10,000–11,000 transcripts in a cell line study. In contrast, a proteomic study comparable to what is reported here will sample only approximately 10% of the expressed the expressed set of proteins. While the transcriptome can enhance the proteomic measurement, the opposite is also true as a medium level protein study can be used to explore the major phenotypic patterns observed in a study of disease versus normal cell lines and patient tissue. In addition, there are examples of a protein being identified in the absence of a measurable transcript level21.
In the proteomic analysis we used a conservative protocol for identifying proteins in replicate analysis, which included high protein confidence and high peptide rank (Proteome Discoverer) and with a FDR of less that 1%. We identified a total of 1444, 1396 and 964 proteins (numbers of proteins with 2 or more peptides) in the SKBR3, SUM149 and 190 cell line samples, respectively (numbers of proteins with 2 or more peptides were 1071, 1134 and 686 for SKBR3, SUM149 and SUM190, respectively). In addition, selected proteins identified by one single peptide were further analyzed using additional criteria such as high mass accuracy, fragmentation spectra and observation of the corresponding transcript (see Table 1). In the cell line studies a comparison of the SKBR3 with SUM190, SKBR3 with SUM149, and SUM190 with SUM149 proteome contents identified 751, 934, and 695 common proteins, respectively.
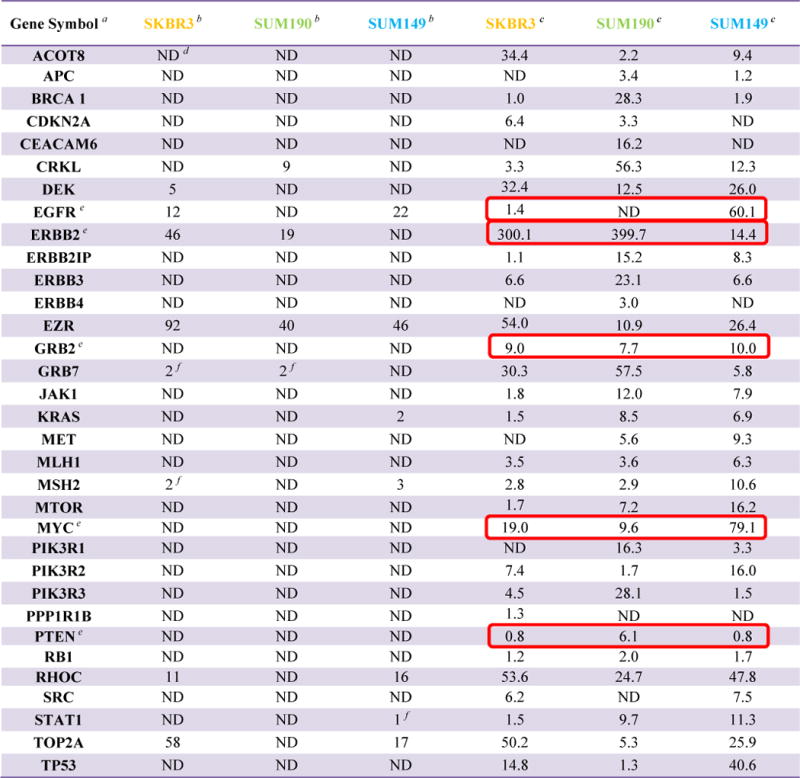
Table 1.
List of oncogenes associated with breast cancer with associated proteomic and transcriptomic data
|
Gene symbols are from Genecards.
Spectral counts
RPKM values
ND = not detected
Oncogenes used for pathway analysis are highlighted by box
Identifications of single peptide proteins are shown in Supplementary Figure S3.
b) Characterization of EGFR and ERBB2
EGFR was identified in SUM149 and SKBR3 cell lysates, while ERBB2 was identified in SKBR3 and SUM190 cell lysate preparations, consistent with IHC results in previous studies5, 22. As shown in Supplementary Table S1, EGFR and ERBB2 were identified with 11 and 13 peptides for cell lines SUM149 and SKBR3 respectively. This table employs data from GPMDB (Global Proteome Machine database)23 to assess the quality of peptides observed for the two proteins. The peptides observed in our study have been frequently reported in the literature e.g. rank 1 to 5 and 1 to 4 for the most frequently observed, as well as other peptides for EGFR and ERBB2 respectively The MS/MS data for a diagnostic peptide for EGFR and ERBB2 in shown in Supplementary Figure S2. Both EGFR and ERBB2 were detected with good sequence coverage (15.5 and 15.8 %) although peptides derived from the N-terminal domain of ERBB2 were not observed. The identification of ERBB2 was confirmed by immunoprecipitation with the monoclonal antibody trastuzumab (Herceptin®) and subsequent analysis on 1D SDS-PAGE and detected at an approximate molecular weight (MW) of 110k (theoretical 138kD, data not shown).
c) Protein Observations with RNA-Seq data and Expressed in a Genome Wide Format (chromosomes)
Besides proteomic analysis, we have also discovered potential proteins of interest by comparing proteomics data with the corresponding transcriptomic data in a chromosome format (see Supplementary Table S3, 4 for the RNA-Seq results for SKBR3, SUM149 and SUM190). We collected the genomic information from the Gene A La Cart tool provided by www.genescards.org. In doing so, UniProt accession numbers for their corresponding proteins were first extracted from the search result files in Proteome Discoverer, prior to submission to Gene a la Cart as identifiers to retrieve their genomic information, including gene symbols, genomic locations (chromosome number, base pair location of gene start and end, and gene size), and Ensemble cytobands. This would allow the protein list to be organized by their locations on different chromosomes. The resulting data sets for the three cell lines are shown in Supplementary Table S3.
d) Use of RNA-Seq Data to Explore ERBB2 Signaling Pathways
As a first step we generated a list of 33 oncogenes associated with breast cancer from the Sanger, Genecards databases, and literatures24–25 which had either measurable transcript level (RPKM >1) and in some cases proteomic data (see Table 1). The RNA-Seq values showed that the cell line SUM 149 had a high level of transcript for EGFR (RPKM = 60) and a relatively low value for ERBB2 (RPKM =14). Conversely the cell line SUM190 had values of 400 and ND for ERBB2 and EGFR respectively. The immortalized cell line SKBR3 expressed a high level of ERBB2 and a low level of EGFR (RPKM = 300 and 1.4 respectively). Other oncogenes with a high level of transcript (RPKM>40) were TP53, MYC (SUM149); GRB7, CRKL (SUM190) and EZR, TOP2A (SKBR3). As described in a later section we also explored reported interactions between the group of 31 oncogenes and the proteins observed in the SUM149 and 190 proteomic results.
Figs. 1A and B compare the ERBB2 signaling pathway in two IBC cell lines, SUM149 (high levels of EGFR transcript) and SUM190 (high levels of ERBB2 transcript) with the ERBB2 pathway derived from the KEGG database. SUM190 presents an interesting situation with high transcript levels of ERBB2 and ERBB3 (RPKM = 400 and 23, respectively) and a low level for ERBB4 (RPKM =3), without detectable transcript levels of EGFR (ERBB1) and a low RNA-Seq value (4.91) for amphiregulin (AR in Fig. 1), one of the EGFR ligands26. ERBB2 is a special member in the ERBB family in that there has been no ligand discovered for ERBB2 and signaling largely depends on heterodimer formation with either EGFR, ERBB3 or ERBB427–28. However, a high level of ERBB3 is found in the SUM190 transcript and it has been reported that the ERBB2/ERBB3 heterodimer is active in cell proliferation in breast tumor cells (see highlighted blue lines in Fig. 1A)29. Conversely, as is shown in Fig. 1B (highlighted blue lines) with the observed transcript values in the SUM149 cell line for the EGFR family signaling pathway there are several possibilities for signaling with involvement of EGFR dimers, ERBB2 heterodimers with EGFR or ERBB3. Since ERBB4 is not detected at either the transcript or protein level it is presumably not part of the signaling cascade. Thus RNA-Seq studies identified potential differences between the two cell lines and thus set the stage for a proteomic investigation. Another advantage of the RNA-Seq studies was the greater dynamic range than the proteomic measurement; one important example was identification of high levels of the transcript for the MYC oncogene in SUM 149 and 190 (19 and 10 respectively) in the absence of a proteomics signal. The importance of this oncogene is consistent with the importance of the MEK/ERK pathway in carcinogenesis (see arrow in Fig. 1) and is supported by the large number of MYC interactors identified in the proteomics study (see Fig. 2 and discussion later).
Figure 1. Annotation of KEGG ERBB2 signaling pathways with transcriptomic data, Part A SUM190, Part B SUM149. The pathway was derived from http://www.genome.jp/kegg/pathway/hsa/hsa04012.html in January 2012.
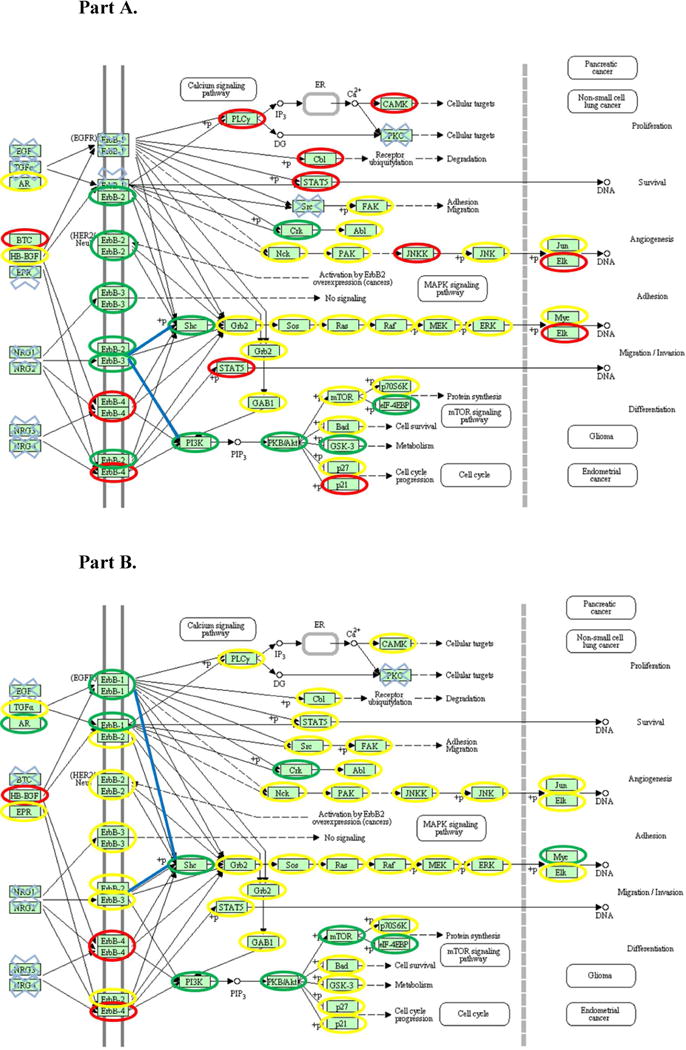
The RPKM values are shown as follows. Green circle: RPKM value is larger than 15; yellow circle: RPKM value is between 3 and 15; red circle: RPKM value is between 1 and 3; blue cross: transcription value is under detection limit; blue line: potential preferred signaling based on transcript levels.
Figure 2. A composite of SUM149 (A) and SUM190 (B) transcriptomic, proteomic, and interaction data for significant oncogenes observed in SUM149 and SUM190.
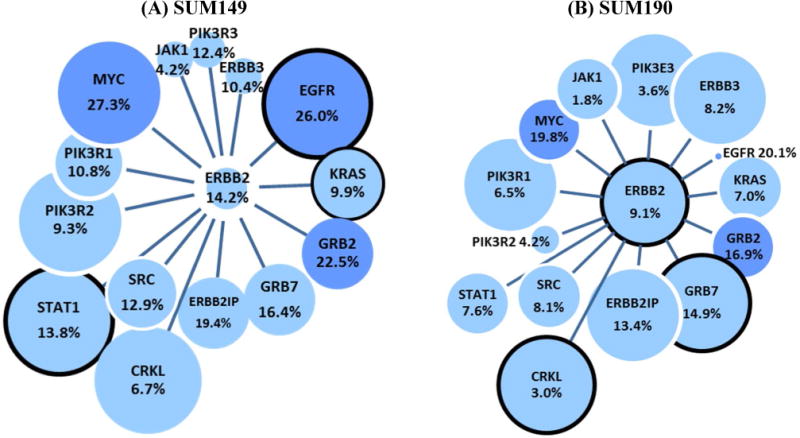
The following notations are used. Line length = Interaction score (shorter line, stronger interaction with ERBB2). Circle size = RPKM value (largest: RPKM>15, medium: RPKM between 3 and 15, small: RPKM between 1 and 3, spot: RPKM <1). Black circle = if observed in proteomic experiments. Percentage = percentage of proteins identified in SUM149 or 190 with specific oncogene interactions as listed by STRING or I2D in Genecards.org
To further explore the difference between EGFR and ERBB2 signaling in SUM190 and 149 transcriptome we used the ratio of the RPKM values to interrogate the NCI Erbb receptor signaling network and visualized the data by assigning different colors based on the ratio values. Firstly, EGFR and ERBB2 are the most differentially expressed genes in this network. As can be seen in Table 2 increased levels of EGFR transcript is associated with increased levels of the ligands amphiregulin (AR), epiregulin (EPR) and transforming growth factor, alpha (TGFA) for SUM 149 vs. 190 while the transcript levels for ERBB2 and associated receptors/ ligands HBEGF, ERBB3 and 4 are increased in SUM 190 vs. 149. Amphiregulin is identified as a ligand of EGFR26 and acts as an effective mitogen for epithelial cells30. Epiregulin is another EGFR ligand that binds directly to EGFR and regulates tyrosine phosphorylation of EGFR31. On the other hand, ERBB3 and ERBB4 are reported to be part of ERBB2 heterodimer in ERBB2 signaling and ERBB3 has been reported to be necessary for tumor cell proliferation in breast cancer29.
Table 2.
| Gene | RPKM-SUM149 | RPKM-SUM190 | RATIO (149/190)b | ERBB2 interact | Novoseek tumor hits |
|---|---|---|---|---|---|
| EGFR | 60.1 | 0.6 | 5.2 | + | 6585 |
| AREG (AR) | 73.7 | 4.9 | 3.7 | 121 | |
| EREG (EPR) | 9.1 | 0.6 | 2.7 | + | 27 |
| TGFA | 3.9 | 0.5 | 1.7 | + | 926 |
| BTC | 0.5 | 1.0 | −0.4 | + | 13 |
| EGF | ND | ND | – | + | 1513 |
| HBEGF | 1.5 | 4.7 | −1.2 | + | 122 |
| ERBB3 | 6.6 | 23.1 | −1.7 | + | 169 |
| ERBB4 | 0.0 | 3.0 | −2.0 | + | 103 |
| ERBB2 | 14.4 | 399.7 | −4.7 | 5807 | |
|
| |||||
Gene set in this pathway is retrieved from the following link: http://pid.nci.nih.gov/search/pathway_landing.shtml?pathway_id=erbb_network_pathway&pathway_name=ErbB%20receptor%20signaling%20network&source=NCI-Nature%20curated&what=graphic&jpg=on&ppage=1 All pathways from Nature Cancer Institute were released on October 12, 2011.
RPKM values are used to show the expression differences in two IBC cell lines, and the values in the ratio column are calculated as followed: . By adding 1 to RPKM values artificially, the ratio could still be calculated even if RPKM value is 0.
e) Proteomic Analysis of SKBR3, SUM 149 and 190 Cell Lines
With the importance of ERBB2 and EGFR signaling indicated by the RNA-Seq data we then examined the correlation between our proteomics data, transcript levels and chromosome location. In Supplementary Table S2 we have ranked the 20 most abundant proteins as measured by spectral count in the SKBR3 cell line (highest number of protein observations) and compared these values with the corresponding RNA-Seq levels as well as the proteomic values for SUM 149 and 190 cell lines. As has been reported elsewhere (9) there is a general correlation between the levels of a transcript and the corresponding proteins, although relative differences in transcript and protein stability as well as temporal events can result in exceptions to this rule. The genes TUBB, ACTB and GAPDH, which were selected as housekeeping proteins for normalization of the proteomic data, were indeed observed at high levels (spectral count rank 17, 8 and 7 respectively for SKBR3) and these genes were also observed with high transcript values (RPKM of 209, 1391 and 2966 respectively). Conversely, the genes HIST1H4A, EPPK1, ENO3 and FLNA offer examples of poor correlation with a rank of 15, 9, 10, 11 in the proteomic data and a RPKM of only 3, 4, 2 and 6 respectively. While the selection of 20 examples in Supplementary Table S2 as a representative protein set is arbitrary, it is of interest to note that 11 of the 20 proteins are located on just 3 chromosomes: 6, 12 and 17. The possible significance of this observation will be discussed in the next section. One of the proteins coded by the gene MYH9 is a known oncogene32 and such a high level of expression is of potential interest.
It has been reported there is a relationship between levels of gene expression and gene density in a chromosome region (9). Figure 3 shows the number of proteins identified in the SKBR3 study reported for each chromosome together with the % observed (number of protein observations divided by the number of protein coding genes on the chromosome). It is not surprising that the highest number of protein observations occurs for chromosome 1 and the lowest for chromosome 13 (largest chromosome and chromosome with lowest number of protein coding gene density respectively). The highest % values were observed for genes 17, 12, 20 and 22 and while there is some correlation with reported gene densities on each chromosome (order of gene density is 19, 17, 20 and 22, high to low) it is relevant to note that chromosome 12 had 5 of the 20 most abundant proteins in Supplementary Table S2, followed by chromosome 17 (3). Another factor is that chromosome 17 contains the highly expressed oncogene ERBB2 that can amplify a set of genes co-located near this oncogene (9).
Figure 3. Ratio of number of protein observations per number of genes for each chromosome.
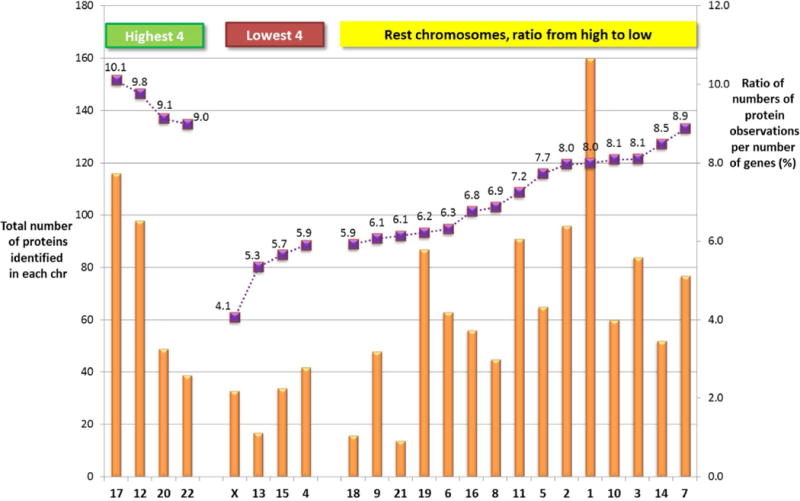
Solid bar = total number of proteins identified in each chromosome for proteomic analysis in SKBR3 Squares = ratio of proteins identified in proteomic experiments relative to total gene numbers for each chromosome (as a %)
f) A Comparison of Proteomic Observations between Cell Lines
One of the challenges of studies with cancer cell lines compared with patient derived tumor samples is the lack of a suitable control samples. We chose the levels of ERBB2 as the comparator and compared the relative abundance of proteins in the two ERBB2 expressing cell lines (SUM190 and SKBR3, RPKM = 400 and 300) with SUM149 (RPKM = 14) in terms of unique proteins and for proteins with a 10 fold higher expression (see Supplementary Tables S3). Examples of proteins observed with this approach include the RAS associated proteins that are commonly activated in tumors in which ERBB2 is over expressed31, 33. RAS-related proteins were preferentially observed in SUM190 and SKBR3 (ERBB2+) in that of the 24 different types of RAS-related proteins identified, SUM190 and SKBR3 accounted for 15 and 20 respectively, while only 6 were shared by all three cell lines. In addition, there are 5 RAS proteins with relative abundance two fold higher in SUM190 and SKBR3 compared to SUM149. Another example is cathepsin D which was elevated 6x and 10x more in SUM190 and SKBR3 compared to SUM149 and has previously been associated with Her2 amplification23 and is a marker of breast cancer marker12. While this type of data analysis did detect some proteins with cancer associations it did not lead to pathway discoveries similar to that observed with the RNA-Seq analysis and thus we explored alternative approaches.
g) Mapping of Oncogene Interactions with Proteomic Observations
With the use of interaction scores provided by Genecards (String, I2D) we recorded the values for interactions between the proteins identified in the proteomic studies of the two IBC cell lines and 21 oncogenes listed in Table 1. The large data set is given in Supplementary Table S3, 4 and a summary is given in Figure 2 with the proteomic and transcriptomic experimental data as well as number of interacting proteins. Firstly, the Figure shows oncogenes that are known to interact with ERBB2, and the oncogenes that show a high degree of interaction (EGFR, ERBB3, ERBB2IP, GRB2, GRB7, KRAS) are denoted by a shorter line. A relatively high RNA-Seq measurement is shown by the size of the circle e.g. ERBB2, GRB7 and MYC and those oncogenes with a proteomics value are shown with a black outline e.g. ERBB2, GRB7, CRKL, TOP2A (see Table 1 for numerical values). For each oncogene, the number of interactions with proteins observed in the proteomic studies of either SUM149 or 190 is given in the circle as a percentage of the total oncogene interactions. As shown in Figure 2 the top 3 oncogenes with the greatest number of interactions with observed proteins are MYC, GRB2 and EGFR with 268, 235 and 143 interactions respectively for SUM149. The basis for this approach has been used by others in the development of bioinformatic processes for prioritizing cancer associated genes with gene expression data combined with protein-protein interaction network information34, as well as the observation that proteomic data when combined with genomic information can add further discrimination to pathway analysis35. Thus in our approach we have combined mapping of oncogenes with RNA-Seq levels and identification of interacting proteins in the proteomic data set and we will now use this data to search for additional pathways of interest in breast cancer.
h) Identification of Pathways That Contain ERBB2, EGFR, GRB2 and MYC Interactors
As an example of our process we describe the selection process for ERBB2 interactors. From the proteomic data set 35 proteins were found to be interacted with ERBB2 based on I2D and STRING databases. We then selected a subset of 14 proteins according to levels of protein expression (spectral counts) and RNA-Seq values in the two IBC cell lines, SUM 149,190 and the model cell line SKBR3 (see Supplementary Table S3). The process was repeated for the 3 other oncogenes with greatest number of interactors with the proteomic data set (Figure 2), namely EGFR, GRB2 and MYC that resulted in172, 289, and 336 strong interactors with significant RNA-Seq or proteomics levels, respectively.
Supplementary Table S3 also lists the chromosome locations of the interacting proteins and it is noteworthy that many of the genes in these pathways are located on cytoband 17q12 which is the site of the ERBB2 amplicon21, 36. Of this group of chromosome 17 genes, ERBB2, GRB7, STAT3 and KRT17 are located in the same chromosome region (17q12 to q21.2) and have the following Novoseek tumor associations based on literature text-mining (Genecards): 5807, 22, 693, and 24. The next stage in our process was to select disease relevant pathways based on our integration of transcriptomic, proteomic and interaction data. Our goal was to find at least one pathway for each of the 4 oncogenes that were well represented by the proteins listed in Supplementary Table S3 and we used Cytoscape and Pathway Commons in this search. The pathways that we have selected are ERBB2, MYC, and PI3K signaling pathways from NCI Pathway Interaction Database, EGFR from the Cancer Cell Map and Integrin Signaling (GRB2) from GeneGo.
In Table 3 we have listed all the proteins identified in EGFR1 signaling pathway as well oncogenes (including those only observed with significant levels of transcript) in order of the ratio of SUM149/190 RNA-Seq values. This approach allows us to take advantage of the much greater dynamic range for RNA-Seq vs. proteomics to compare differences between the two cell lines. We then compared these ratios with the proteomics data obtained for these two cell lines. The control cell line SKBR3 expresses high levels of ERBB2 transcript (300) and lower levels of EGFR (1.4) and shows proteomic values that are mostly intermediate between SUM 149 and 190. In the Table we highlighted in yellow the proteins with higher expression in SUM149 and in blue those with higher levels in SUM190. In general there was good agreement between RNA-Seq and proteomic values, e.g. CAV1, PLEC for higher ratios of EGFR vs. ERBB2 and GRB7, CRKL and CTNND1 for higher ratios of ERBB2 vs. EGFR. CRKL has been shown to associate with lamellipodia formation in breast carcinoma37, and coactivation of CRKL and estrogen receptor alpha has been shown to be a promoter of tumorigenesis38. These observations are supported by literature reports, such as CTNND1 was genomically correlated to breast cancer and cell proliferation in ERBB2 positive breast cancer cell lines39–41. The overexpression of caveolin-1 (CAV1) is frequently related to breast cancer42 and has been reported to be associated with EGFR activation43. Interestingly, the overexpression of both CAV1 and CAV2 has been discovered in triple negative (TN) invasive breast cancer44. In our study, SUM149 is only the TN cell line, and CAV1 is only identified by proteomics in this cell line and a RPKM value (33.6) which is much higher than for two ERBB2+ cell lines; i.e. SUM190 (0.2) and SKBR3 (0.4). At the other extreme of the Table, higher levels of ERBB2 transcript is associated with the proteomic measurement of GRB7, growth factor receptor-bound protein 7, which is part of the ERBB2 amplicon in breast cancer45. In addition most of the proteins in the Table have been reported to interact with EGFR (30/34) and had literature associations with cancer (27/34).
Table 3.
EGFR1 signaling from NCI
| Gene | SKBR3a | SUM190a | SUM149a | SKBR3b | SUM190b | SUM149b | Ratio 149/190c | EGFR interact | Novoseek tomor hits |
|---|---|---|---|---|---|---|---|---|---|
| KRT17d | 66 | 73 | 27 | 1.6 | 0.2 | 197.8 | 7.3 | + | 24 |
| EGFRd | 12 | 22 | 1.4 | 0.6 | 60.1 | 5.2 | + | 6585 | |
| CAV1d | 4 | 0.4 | 0.2 | 33.6 | 4.9 | + | 434 | ||
| PLECd | 332 | 16 | 91 | 15.6 | 7.1 | 69.7 | 3.1 | + | 1 |
| SRCe | 6.2 | 0.1 | 7.5 | 3.0 | + | 397 | |||
| PIK3R2e | 7.4 | 1.7 | 16.0 | 2.7 | + | 2 | |||
| HTT | 1 | 0.5 | 1.9 | 9.0 | 1.8 | + | 4 | ||
| MTA2 | 3 | 2 | 19.5 | 11.5 | 37.6 | 1.6 | 5 | ||
| AP2A1 | 8 | 9.4 | 4.3 | 14.9 | 1.6 | + | 0 | ||
| HAT1d | 3 | 3.0 | 6.5 | 12.5 | 0.8 | 0 | |||
| STAT5B | 2 | 3.4 | 1.4 | 3.2 | 0.8 | + | 92 | ||
| EPS15 | 1 | 2.8 | 4.1 | 7.8 | 0.8 | + | 2 | ||
| KRT7d | 380 | 634 | 50 | 654.7 | 338.9 | 575.6 | 0.8 | + | 466 |
| YWHAB | 46 | 70 | 77 | 70.2 | 18.3 | 29.1 | 0.6 | + | 0 |
| CRK | 2 | 1 | 6.9 | 14.7 | 18.2 | 0.3 | + | 19 | |
| RALB | 3 | 1 | 11.2 | 6.6 | 8.1 | 0.3 | 9 | ||
| EEF1A1d | 162 | 250 | 903.9 | 309.6 | 357.8 | 0.2 | + | 20 | |
| STAT1 | 1 | 1.5 | 9.7 | 11.3 | 0.2 | + | 121 | ||
| KRT8d | 655 | 286 | 28 | 2025.0 | 60.0 | 61.3 | 0.0 | + | 116 |
| KRT18d | 334 | 131 | 21 | 1470.0 | 71.3 | 64.1 | −0.2 | + | 158 |
| KRAS | 2 | 1.5 | 8.5 | 6.9 | −0.3 | + | 615 | ||
| RAB5A | 8 | 5.4 | 6.7 | 5.2 | −0.3 | + | 0 | ||
| STAT3 | 35 | 23.4 | 13.8 | 10.6 | −0.3 | + | 693 | ||
| MAP2K1d | 2 | 2.4 | 10.3 | 7.8 | −0.4 | + | 45 | ||
| PEBP1d | 26 | 45 | 12 | 104.3 | 43.1 | 30.3 | −0.5 | 22 | |
| JAK1e | 1.8 | 12.0 | 7.9 | −0.6 | + | 9 | |||
| RAC1 | 15 | 14 | 12 | 207.9 | 23.0 | 12.0 | −0.9 | + | 88 |
| ARF4d | 11 | 35 | 17.2 | 24.9 | 12.2 | −1.0 | + | 0 | |
| CDC42d | 9 | 20 | 23.0 | 37.7 | 17.5 | −1.1 | + | 43 | |
| CTNND1d | 28 | 7 | 5.5 | 68.9 | 19.3 | −1.8 | + | 83 | |
| SH3BGRL | 2 | 2 | 0.7 | 18.6 | 3.7 | −2.1 | + | 0 | |
| CRKLd | 9 | 3.3 | 56.3 | 12.3 | −2.1 | + | 4 | ||
| GRB7 | 2 | 2 | 30.3 | 57.5 | 5.8 | −3.1 | + | 22 | |
| PIK3R3e | 4.5 | 28.1 | 1.5 | −3.5 | + | 0 | |||
|
| |||||||||
Spectral counts
RPKM values
RPKM values are used to show the expression differences in two IBC cell lines, and the values in the ratio column are calculated as followed: .
Proteins with higher expression in SUM149 are highlighted in yellow and in blue those with higher levels in SUM190.
Known oncogene.
Table 4 shows a similar analysis of the Integrin outside-in signaling pathway which was selected as an example of the oncogene GRB2 and shows an elevation of filamin A (FN1), actinin alpha1 (ACTN1) in both the transcriptome and proteome of SUM149 vs. 190 cell lines. Of interest, Filamin A phosphorylation has been shown to mediate the effects of caveolin-1 on cancer cell migration46. For the c-MYC pathway (Table 5) the higher ratios of EGFR transcript were associated with increased proteomic levels of branched chain amino-acid transaminase 1 (BCAT1), cytosolic, carbamoyl-phosphate synthetase 2 (CAD) and nucleolin (NCL), while higher ERBB2 ratios are associated with transferrin receptor (TFRC) and metadherin (MTDH). Examples of the significance of these proteins include the observation that nucleolin colocalizes with BRCA1 in breast carcinoma tissue47, and metahedrin is a valuable marker of breast cancer progression and high expression may play a role in tumorigenesis of breast cancer48–49. As was observed for the EGFR pathway, most of the proteins in Table 4 (GRB2) and Table 5 (MYC) contained a significant number of interactors (12/17 and 28/31) and literature associations with cancer (16/17 and 24/31) respectively.
Table 4.
Integrin outside-in signaling.
| Gene | SKBR3b | SUM190b | SUM149b | SKBR3c | SUM190c | SUM149c | Ratio 149/190d | GRB2 interact | Novoseek tomor hits |
|---|---|---|---|---|---|---|---|---|---|
| FN1e | 0 | 0 | 1 | 1.3 | 0.1 | 111.9 | 6.6 | + | 159 |
| FLNAe | 420 | 5 | 524 | 7.0 | 12.6 | 414.3 | 4.9 | + | 9 |
| ACTN1e | 75 | 54 | 154 | 8.9 | 8.6 | 81.9 | 3.1 | + | 5 |
| SRCf | 7.2 | 0.1 | 7.5 | 3.0 | + | 397 | |||
| ACTN4e | 158 | 52 | 103 | 73.7 | 11.4 | 71.2 | 2.5 | + | 14 |
| ACTB | 499 | 545 | 476 | 1083.8 | 196.1 | 559.5 | 1.5 | + | 3 |
| VCLe | 100 | 5 | 17 | 8.6 | 3.1 | 8.9 | 1.3 | 28 | |
| ITGB1e | 0 | 0 | 7 | 7.6 | 12.9 | 32.1 | 1.3 | + | 71 |
| TLN1e | 72 | 0 | 46 | 5.3 | 5.5 | 12.9 | 1.1 | 0 | |
| CTNNB1 | 0 | 12 | 12 | 8.4 | 21.9 | 49.0 | 1.1 | + | 1681 |
| ITGA2e | 0 | 0 | 6 | 0.2 | 2.4 | 3.7 | 0.4 | 28 | |
| GRB2f | 10.2 | 7.7 | 10.0 | 0.3 | + | 35 | |||
| VTN | 2 | 0 | 0 | 2.5 | 0.0 | 0.1 | 0.1 | 102 | |
| ITGAV | 2 | 0 | 0 | 1.3 | 7.1 | 7.9 | 0.1 | 23 | |
| ACTR3 | 28 | 16 | 17 | 15.6 | 20.4 | 20.8 | 0.0 | + | 5 |
| MAP2K1e | 0 | 2 | 0 | 3.1 | 10.3 | 7.8 | −0.4 | + | 45 |
| RAC1 | 15 | 14 | 12 | 190.8 | 23.0 | 12.0 | −0.9 | + | 88 |
|
| |||||||||
This pathway is retrieve from GeneGo in January, 2012.
Spectral counts
RPKM values
RPKM values are used to show the expression differences in two IBC cell lines, and the values in the ratio column are calculated as followed: .
Proteins with higher expression in SUM149 are highlighted in yellow and in blue those with higher levels in SUM190.
Known oncogene.
Table 5.
Validated targets of C-MYC transcriptional activation (a sub-pathway of c-MYC pathway)
| Gene | SKBR3a | SUM190a | SUM149a | SKBR3b | SUM190b | SUM149b | Ratio 149/190c | MYC interact | Novoseek tomor hits |
|---|---|---|---|---|---|---|---|---|---|
| RCC1 | 2 | 0.1 | 0.0 | 26.8 | 4.8 | + | 0 | ||
| HMGA1d | 1 | 35.6 | 3.5 | 119.0 | 4.7 | + | 99 | ||
| BCAT1d | 4 | 0.0 | 0.0 | 11.1 | 3.6 | + | 0 | ||
| CADd | 43 | 18 | 2.5 | 3.2 | 22.0 | 2.5 | 2 | ||
| RUVBL2d | 2 | 2 | 4 | 73.0 | 10.4 | 53.9 | 2.3 | + | 0 |
| NCLd | 60 | 45 | 142 | 118.1 | 14.9 | 70.0 | 2.2 | + | 21 |
| GAPDH | 522 | 495 | 539 | 2966.0 | 205.2 | 800.7 | 2.0 | + | 88 |
| BAXd | 2 | 2 | 12.8 | 2.8 | 13.3 | 1.9 | + | 848 | |
| RUVBL1 | 2 | 7 | 10 | 13.2 | 6.3 | 26.3 | 1.9 | + | 0 |
| CCNB1d | 1 | 17.3 | 8.8 | 32.3 | 1.8 | + | 138 | ||
| PFKM | 5 | 7.0 | 5.5 | 19.3 | 1.6 | + | 0 | ||
| EIF4A1 | 49 | 96 | 77 | 128.0 | 21.6 | 61.8 | 1.5 | + | 2 |
| ENO1 | 758 | 1073 | 661 | 481.8 | 169.7 | 464.3 | 1.4 | + | 49 |
| TRRAPd | 2 | 1 | 1.2 | 3.3 | 10.7 | 1.4 | + | 1 | |
| LDHAd | 179 | 115 | 215 | 213.6 | 19.2 | 48.2 | 1.3 | + | 27 |
| TK1 | 6 | 5 | 3 | 120.2 | 11.0 | 28.3 | 1.3 | + | 67 |
| SLC2A1 | 5 | 22.1 | 7.7 | 19.7 | 1.3 | + | 451 | ||
| HUWE1d | 15 | 37 | 3.3 | 16.1 | 36.0 | 1.1 | + | 6 | |
| HSPD1 | 216 | 117 | 107 | 73.6 | 14.5 | 31.8 | 1.1 | + | 85 |
| PRDX3 | 31 | 7 | 7 | 23.6 | 14.6 | 31.3 | 1.1 | + | 1 |
| ACTL6Ad | 4 | 12.1 | 12.6 | 24.1 | 0.9 | + | 0 | ||
| EIF4G1d | 25 | 12 | 45 | 35.8 | 37.8 | 60.9 | 0.7 | + | 16 |
| NME1 | 29 | 23 | 20 | 0.1 | 26.4 | 36.0 | 0.4 | 732 | |
| PTMAd | 6 | 3 | 550.7 | 77.5 | 88.0 | 0.2 | 18 | ||
| EIF2S1 | 6 | 9 | 6 | 5.9 | 13.1 | 12.9 | 0.0 | + | 14 |
| DDX18d | 2 | 2 | 4 | 6.9 | 6.7 | 6.5 | 0.0 | + | 5 |
| HSPA4 | 26 | 31 | 36 | 8.0 | 23.0 | 21.6 | −0.1 | + | 385 |
| HSP90-AA1 | 260 | 326 | 287 | 254.6 | 58.8 | 42.3 | −0.5 | + | 485 |
| EIF4E | 3 | 7.5 | 3.1 | 1.8 | −0.5 | + | 181 | ||
| MTDHd | 5 | 13.6 | 18.4 | 9.7 | −0.9 | + | 25 | ||
| TFRCd | 41 | 21 | 12 | 23.2 | 48.2 | 14.3 | −1.7 | + | 0 |
|
| |||||||||
Spectral counts
RPKM values
RPKM values are used to show the expression differences in two IBC cell lines, and the values in the ratio column are calculated as followed: .
Proteins with higher expression in SUM149 are highlighted in yellow and in blue those with higher levels in SUM190.
Known oncogene.
A similar analysis of the p53 pathway is shown in Table 6. This pathway is a sub pathway of Class I PI3K signaling events mediated by Akt, and was selected as an example of the oncogene PTEN (phosphatase and tensin homolog). Tumor suppressor PTEN has been observed to be deleted in TN breast cancer which shown related to resistance of EGFR targeting therapy50. In our data set, SUM149, which is a classic TN breast cancer, has a very low level transcript expression of PTEN (0.8), compared to SUM190 (6.1). Interestingly, another tumor suppressor, SERPINB5 (Serpin B5), has been reported to be negatively correlated with both ER and PGR genes in a quantitative DNA analysis51, was only observed in SUM149 (proteomics and trancriptomics), which is the only TN cell line in the study. Likewise, amplification of S100A2 (Protein S100-A2) was observed in both proteomics and transcriptomics experiments. This protein, as one of S100 families, has been reported to be upregulated in mRNA expression in ER-negative breast cancer patients and potentially promote cancer metastasis52. SFN (14-3-3 protein sigma), which acts as p53-regulated inhibitor of G2/M progression, has been reported to be silencing due to DNA hypermethylation in breast cancer53–54. A similar silencing due to methylation for PYCARD (or TMS1) has been observed in breast cancer cells55. However, both overexpression of SFN and PYCARD in transcript and proteomic level was detected in SUM149, which could provide a potential diagnostic marker for TN breast cancer. Similarly, EPH2, which overexpresses in more than 60% of breast cancer patients56, has been listed as potential clinical target in TN breast cancer44. Expression of EPH2 has been observed to be stimulated by the activation of EGFR57. This is consisting with the EPH2 expression in our experiment, in which EPH2 was only identified in SUM149 (proteomics) and greatly amplified in transcriptomic level.
Table 6.
p53 pathway (a sub-pathway of Class I PI3K signaling events mediated by Akt)
| Gene | SKBR3a | SUM190a | SUM149a | SKBR3b | SUM190b | SUM149b | Ratio 149/190c | PTEN interact | Novoseek tomor hits |
|---|---|---|---|---|---|---|---|---|---|
| S100A2d | 14 | 1.6 | 0.4 | 53.8 | 5.3 | 66 | |||
| EGFRd | 12 | 22 | 1.4 | 0.6 | 60.1 | 5.2 | 6585 | ||
| CAV1d | 4 | 0.4 | 0.2 | 33.6 | 4.9 | + | 434 | ||
| TP53e | 14.8 | 1.3 | 40.6 | 4.2 | + | 24003 | |||
| SERP-INB5d | 14 | 0.0 | 0.4 | 23.5 | 4.2 | 482 | |||
| SFNd | 6 | 23 | 88 | 15.2 | 2.8 | 64.2 | 4.1 | 25 | |
| PRMT1d | 2 | 58.8 | 7.4 | 94.2 | 3.5 | 10 | |||
| NDRG1 | 18 | 50.6 | 0.9 | 19.7 | 3.5 | 43 | |||
| PYCARDd | 3 | 0.1 | 0.0 | 9.5 | 3.4 | 21 | |||
| GPX1d | 1 | 0.1 | 13.5 | 132.2 | 3.2 | 12 | |||
| EPHA2d | 4 | 2.1 | 6.0 | 51.4 | 2.9 | 208 | |||
| PRKCD | 3 | 39.6 | 0.1 | 5.3 | 2.5 | 19 | |||
| CSE1Ld | 66 | 21 | 95 | 19.9 | 10.1 | 59.8 | 2.5 | 7 | |
| BAXd | 2 | 2 | 12.8 | 2.8 | 13.3 | 1.9 | 848 | ||
| TRIM28d | 12 | 9 | 5 | 42.8 | 18.1 | 69.7 | 1.9 | 1 | |
| HTTd | 1 | 0.5 | 1.9 | 9.0 | 1.8 | 4 | |||
| SMAR-CA4d | 5 | 2 | 21.7 | 8.4 | 31.4 | 1.8 | 61 | ||
| CCNB1d | 1 | 17.3 | 8.8 | 32.3 | 1.8 | 138 | |||
| MSH2d | 2 | 3 | 2.8 | 2.9 | 10.6 | 1.6 | 338 | ||
| PCNA | 25 | 16 | 20 | 47.2 | 22.6 | 63.8 | 1.5 | 2016 | |
| TRRAPd | 2 | 1 | 1.2 | 3.3 | 10.7 | 1.4 | 1 | ||
| BIDd | 2 | 2.5 | 1.4 | 5.4 | 1.4 | 24 | |||
| PRMT5d | 3 | 6.8 | 6.9 | 19.5 | 1.4 | 5 | |||
| HUWE1d | 15 | 37 | 3.3 | 16.1 | 36.0 | 1.1 | 6 | ||
| CTSDd | 52 | 31 | 5 | 346.5 | 34.9 | 68.6 | 1.0 | 430 | |
| MLH1e | 3.5 | 3.6 | 6.3 | 0.7 | 1123 | ||||
| METe | 0.8 | 5.6 | 9.3 | 0.7 | 379 | ||||
| RPL5 | 34 | 35 | 29 | 658.1 | 98.9 | 145.3 | 0.6 | 0 | |
| ATRd | 1 | 0.6 | 3.8 | 5.3 | 0.4 | 10 | |||
| NEDD8d | 9 | 11 | 100.7 | 15.1 | 19.7 | 0.4 | 4 | ||
| USP7 | 2 | 8.3 | 9.2 | 8.9 | 0.0 | 13 | |||
| RB1e | 1.2 | 2.0 | 1.7 | −0.1 | 1484 | ||||
| PPP2CAd | 5 | 6.4 | 22.0 | 15.1 | −0.5 | 0 | |||
| DDX5 | 6 | 5 | 8 | 32.2 | 40.2 | 19.8 | −1.0 | 6 | |
| APCe | 0.2 | 3.4 | 1.2 | −1.0 | 573 | ||||
| PTENe | 0.8 | 6.1 | 0.8 | −1.9 | 2252 | ||||
|
| |||||||||
Spectral counts
RPKM values
RPKM values are used to show the expression differences in two IBC cell lines, and the values in the ratio column are calculated as followed: .
Proteins with higher expression in SUM149 are highlighted in yellow and in blue those with higher levels in SUM190.
Known oncogene.
CONCLUSION
In view of the importance of EGFR/ERBB2 heterodimer signaling in breast cancer it is of interest to explore the transcriptomic and proteomic analysis of two primary cell lines isolated from inflammatory breast cancer patients, one (SUM149) which expresses high levels of EGFR transcript with much lower levels of ERBB2 (1/4) while the other expresses very high levels of ERBB2 transcript (SUM190) and no detectable EGFR transcript. As a control we used a SKBR3 cell line which expressed high levels of ERBB2 transcript and low levels of EGFR. Analysis of the transcript levels indicated that the most likely signaling pathway for SUM190 involved the ERBB2/ERBB3 heterodimer, while SUM149 had several possibilities with involvement of EGFR dimers, ERBB2 heterodimers with EGFR and ERBB2 or ERBB3. We then explored the proteome of the two cell lines in terms of correlations between the transcriptome and proteomic measurements, identification of a panel of 21 oncogenes expressed in the two cell lines, interaction analysis of the observed proteins with this panel of oncogenes and selection of relevant cancer pathways. The analysis resulted in 4 pathways in addition to ERBB2 signaling (EGFR, integrin, MYC signaling, and PI3K signaling, see Tables 4 to 6) that contained many of the oncogene interacting proteins. In general there was reasonable agreement between the RNA-Seq and proteomic values shown in these tables except for some housekeeping proteins (see Discussion section). We list here those proteins which were correlated with higher levels of EGFR or ERBB2 transcript respectively: EGFR signaling – caveolin 1 (CAV1), plectin (PLEC) (EGFR); growth factor receptor-bound protein 7 (GRB7), Crk-like protein (CRKL) and Catenin delta-1 (CTNND1) (ERBB2): Integrin signaling- filamin A (FLNA) and actinin alpha1 (ACTN1) (EGFR): MYC signaling – branched chain amino-acid transaminase 1 (BCAT1), carbamoyl-phosphate synthetase (CAD), nucleolin (NCL) (EGFR); transferrin receptor (TFRC), metadherin (MTDH) (ERBB2); p53 signaling: S100-A2 protein (S100A2), caveolin 1 (CAV1), Serpin B5 (SERPINB5), stratifin (SFN), PYD and CARD domain containing (PYCARD), and EPH receptor A2 (EPHA2) (EGFR). While the depth of the proteomic analysis was limited partly due to technical issues with analysis of the primary cell lines, this study was designed to use proteomics to identify higher level protein expressions that correlated with the transcriptome study. In this study we have demonstrated that one of the goals of the chromosome-centric human proteome project (C-HPP), which is to integrate RNA-Seq with proteomics measurement, is of value. We plan in a future study to explore the potential of the proteins identified in this study as markers of ERBB2 and EGFR signaling as well as activation of the oncogenes MYC and GRB2 in a study of breast cancer tumor samples.
Supplementary Material
Acknowledgments
This work was supported by following research grants: (Korea) The World Class University program through the National Research Foundation of Korea funded by the Ministry of Education, Science and Technology (R31-2008-000-10086-0 (W.S.H. and Y.-K.P.), National Project for the Personalized Genomic Medicine A111218-11-CP01 (to YKP) from the Korean Ministry of Health and Welfare: (USA) The National Institutes of Health grants, U01-CA128427 to WSH, U54DA021519, UL1 RR024986, RM-08-029, and U54ES017885 to G.S.O.; NIH grant (MPS and H.I.); Texas State Rider for the Morgan Welch Inflammatory Breast Cancer Program and the G. Morris Dorrance Jr. Chair in Medical Oncology (M.C., Z.M.).
Footnotes
Supporting Information
Supplemental figures and tables. This material is available free of charge via the Internet at http://pubs.acs.org.
References
- 1.Mortazavi A, Williams BA, McCue K, Schaeffer L, Wold B. Mapping and quantifying mammalian transcriptomes by RNA-Seq. Nature methods. 2008;5(7):621–8. doi: 10.1038/nmeth.1226. [DOI] [PubMed] [Google Scholar]
- 2.Yang Z, Harris LE, Palmer-Toy DE, Hancock WS. Multilectin Affinity Chromatography for Characterization of Multiple Glycoprotein Biomarker Candidates in Serum from Breast Cancer Patients. Clinical Chemistry. 2006;52(10):1897–905. doi: 10.1373/clinchem.2005.065862. [DOI] [PubMed] [Google Scholar]
- 3.Zeng Z, Hincapie M, Haab BB, Hanash S, Pitteri SJ, Kluck S, Hogan JM, Kennedy J, Hancock WS. The development of an integrated platform to identify breast cancer glycoproteome changes in human serum. Journal of chromatography A. 2010;1217(19):3307–15. doi: 10.1016/j.chroma.2009.09.029. [DOI] [PMC free article] [PubMed] [Google Scholar]
- 4.Zeng Z, Hincapie M, Pitteri SJ, Hanash S, Schalkwijk J, Hogan JM, Wang H, Hancock WS. A proteomics platform combining depletion, multi-lectin affinity chromatography (M-LAC), and isoelectric focusing to study the breast cancer proteome. Analytical chemistry. 2011;83(12):4845–54. doi: 10.1021/ac2002802. [DOI] [PMC free article] [PubMed] [Google Scholar]
- 5.Forozan F, Veldman R, Ammerman C, Parsa N, Kallioniemi A, Kallioniemi OP, Ethier S. Molecular cytogenetic analysis of 11 new breast cancer cell lines. British Journal of Cancer. 1999;81(8):7. doi: 10.1038/sj.bjc.6695007. [DOI] [PMC free article] [PubMed] [Google Scholar]
- 6.Liang Z, Zeng X, Gao J, Wu S, Wang P, Shi X, Zhang J, Li T. Analysis of EGFR, HER2, and TOP2A gene status and chromosomal polysomy in gastric adenocarcinoma from Chinese patients. BMC Cancer. 2008;8(363):12. doi: 10.1186/1471-2407-8-363. [DOI] [PMC free article] [PubMed] [Google Scholar]
- 7.Mendelsohn J, Baselga J. The EGF receptor family as targets for cancer therapy. Oncogene. 2000;19(56):16. doi: 10.1038/sj.onc.1204082. [DOI] [PubMed] [Google Scholar]
- 8.Ross JS, Fletcher JA. The HER-2/neu oncogene: prognostic factor, predictive factor and target for therapy. Seminars in cancer biology. 1999;9(2):125–38. doi: 10.1006/scbi.1998.0083. [DOI] [PubMed] [Google Scholar]
- 9.Kauraniemi P, Hautaniemi S, Autio R, Astola J, Monni O, Elkahloun A, Kallioniemi A. Effects of Herceptin treatment on global gene expression patterns in HER2-amplified and nonamplified breast cancer cell lines. Oncogene. 2004;23(4):1010–3. doi: 10.1038/sj.onc.1207200. [DOI] [PubMed] [Google Scholar]
- 10.Wu SL, Kim J, Bandle RW, Liotta L, Petricoin E, Karger BL. Dynamic Profiling of the Post-translational Modifications and Interaction Partners of Epidermal Growth Factor Receptor Signaling after Stimulation by Epidermal Growth Factor Using Extended Range Proteomic Analysis (ERPA) Molecular & Cellular Proteomics. 2006;5(9):18. doi: 10.1074/mcp.M600105-MCP200. [DOI] [PubMed] [Google Scholar]
- 11.Ahn ER, Vogel CL. Dual HER2-targeted approaches in HER2-positive breast cancer. Breast cancer research and treatment. 2012;131(2):371–83. doi: 10.1007/s10549-011-1781-y. [DOI] [PubMed] [Google Scholar]
- 12.Harris L, Fritsche H, Menne R, Norton L, Ravdin P, Taube Sheila, Somerfield MR, Hayes DF, B RC., Jr American Society of Clinical Oncology 2007 Update of Recommendations for the Use of Tumor Markers in Breast Cancer. Journal of Clinical Oncology. 2007;25(33):26. doi: 10.1200/JCO.2007.14.2364. [DOI] [PubMed] [Google Scholar]
- 13.Choi H, Fermin D, Nesvizhskii AI. Significance analysis of spectral count data in label-free shotgun proteomics. Molecular & Cellular Proteomics. 2008;7(12):2373–2385. doi: 10.1074/mcp.M800203-MCP200. [DOI] [PMC free article] [PubMed] [Google Scholar]
- 14.Ferguson RE, Carroll HP, Harris A, Maher ER, Selby PJ, Banks RE. Housekeeping proteins: A preliminary study illustrating some limitations as useful references in protein expression studies. Proteomics. 2005;5:6. doi: 10.1002/pmic.200400941. [DOI] [PubMed] [Google Scholar]
- 15.Zhang L, Li WH. Mammalian Housekeeping Genes Evolve More Slowly than Tissue-Specific Genes. Mol Biol Evol. 2004;21(2):4. doi: 10.1093/molbev/msh010. [DOI] [PubMed] [Google Scholar]
- 16.Chen R, Mias GI, Li-Pook-Than J, Jiang L, Lam HY, Miriami E, Karczewski KJ, Hariharan M, Dewey FE, Cheng Y, Clark MJ, Im H, Habegger L, Balasubramanian S, O’Huallachain M, Dudley JT, Hillenmeyer S, Haraksingh R, Sharon D, Euskirchen G, Lacroute P, Bettinger K, Boyle AP, Kasowski M, Grubert F, Seki S, Garcia M, Whirl-Carrillo M, Gallardo M, Blasco MA, Greenberg PL, Snyder P, Klein TE, Altman RB, Butte AJ, Ashley EA, Gerstein M, Nadeau KC, Tang H, Snyder M. Personal omics profiling reveals dynamic molecular and medical phenotypes. Cell. 2012;148(6):1293–307. doi: 10.1016/j.cell.2012.02.009. [DOI] [PMC free article] [PubMed] [Google Scholar]
- 17.Orazine CI, Hincapie M, Hancock WS, Hattersley M, Hanke JH. A proteomic analysis of the plasma glycoproteins of a MCF-7 mouse xenograft: a model system for the detection of tumor markers. J Proteome Res. 2008;7(4):1542–54. doi: 10.1021/pr7008516. [DOI] [PubMed] [Google Scholar]
- 18.Wu SL, Hancock WS, Goodrich GG, Kunitake ST. An approach to the proteomic analysis of a breast cancer cell line (SKBR-3) Proteomics. 2003;3(6):1037–46. doi: 10.1002/pmic.200300382. [DOI] [PubMed] [Google Scholar]
- 19.Wu SL, Taylor AD, Lu Q, Hanash SM, Im H, Snyder M, Hancock WS. Identification of potential glycan cancer markers with sialic acid attached to sialic acid and up-regulated fucosylated galactose structures in epidermal growth factor receptor secreted from A431 cell line. Molecular & cellular proteomics : MCP. 2013 doi: 10.1074/mcp.M112.024554. [DOI] [PMC free article] [PubMed] [Google Scholar]
- 20.Paik YK, Hancock WS. Uniting ENCODE with genome-wide proteomics. Nature biotechnology. 2012;30(11):1065–7. doi: 10.1038/nbt.2416. [DOI] [PubMed] [Google Scholar]
- 21.Greenbaum D, Colangelo C, Williams K, Gerstei M. Comparing protein abundance and mRNA expression levels on a genomic scale. Genome Biology. 2003;4(9) doi: 10.1186/gb-2003-4-9-117. [DOI] [PMC free article] [PubMed] [Google Scholar]
- 22.Lev D, Kim L, Melnikova V, Ruiz M, Ananthaswamy H, Price J. Dual blockade of EGFR and ERK1/2 phosphorylation potentiates growth inhibition of breast cancer cells. British Journal of Cancer. 2004;91(4):8. doi: 10.1038/sj.bjc.6602051. [DOI] [PMC free article] [PubMed] [Google Scholar]
- 23.Zhang CC, Rogalski JC, Evans DM, Klockenbusch C, Beavis RC, Kast J. In Silico Protein Interaction Analysis Using the Global Proteome Machine Database. J Proteome Res. 2011;10(2):13. doi: 10.1021/pr1008652. [DOI] [PubMed] [Google Scholar]
- 24.Bignell GR, Santarius T, Pole JC, Butler AP, Perry J, Pleasance E, Greenman C, Menzies A, Taylor S, Edkins S, Campbell P, Quail M, Plumb B, Matthews L, McLay K, Edwards PA, Rogers J, Wooster R, Futreal PA, Stratton MR. Architectures of somatic genomic rearrangement in human cancer amplicons at sequence-level resolution. Genome research. 2007;17(9):1296–303. doi: 10.1101/gr.6522707. [DOI] [PMC free article] [PubMed] [Google Scholar]
- 25.Ethier SP. Identifying and validating causal genetic alterations in human breast cancer. Breast cancer research and treatment. 2003;78(3):285–7. doi: 10.1023/a:1023078722316. [DOI] [PubMed] [Google Scholar]
- 26.Johnson GR, Kannan B, Shoyab M, Stromberg K. Amphiregulin induces tyrosine phosphorylation of the epidermal growth factor receptor and p185erbB2. Evidence that amphiregulin acts exclusively through the epidermal growth factor receptor at the surface of human epithelial cells. The Journal of biological chemistry. 1993;268(4):2924–31. [PubMed] [Google Scholar]
- 27.Franklin MC, Carey KD, Vajdos FF, Leahy DJ, de Vos AM, Sliwkowski MX. Insights into ErbB signaling from the structure of the ErbB2-pertuzumab complex. Cancer cell. 2004;5(4):317–28. doi: 10.1016/s1535-6108(04)00083-2. [DOI] [PubMed] [Google Scholar]
- 28.Hudelist G, Singer CF, Manavi M, Pischinger K, Kubista E, Czerwenka K. Co-expression of ErbB-family members in human breast cancer: Her-2/neu is the preferred dimerization candidate in nodal-positive tumors. Breast cancer research and treatment. 2003;80(3):353–61. doi: 10.1023/A:1024929522376. [DOI] [PubMed] [Google Scholar]
- 29.Holbro T, Beerli RR, Maurer F, Koziczak M, Barbas CF, 3rd, Hynes NE. The ErbB2/ErbB3 heterodimer functions as an oncogenic unit: ErbB2 requires ErbB3 to drive breast tumor cell proliferation. Proceedings of the National Academy of Sciences of the United States of America. 2003;100(15):8933–8. doi: 10.1073/pnas.1537685100. [DOI] [PMC free article] [PubMed] [Google Scholar]
- 30.Eckstein N, Servan K, Girard L, Cai D, von Jonquieres G, Jaehde U, Kassack MU, Gazdar AF, Minna JD, Royer HD. Epidermal growth factor receptor pathway analysis identifies amphiregulin as a key factor for cisplatin resistance of human breast cancer cells. The Journal of biological chemistry. 2008;283(2):739–50. doi: 10.1074/jbc.M706287200. [DOI] [PMC free article] [PubMed] [Google Scholar]
- 31.Komurasaki T, Toyoda H, Uchida D, Morimoto S. Epiregulin binds to epidermal growth factor receptor and ErbB-4 and induces tyrosine phosphorylation of epidermal growth factor receptor, ErbB-2, ErbB-3 and ErbB-4. Oncogene. 1997;15(23):2841–8. doi: 10.1038/sj.onc.1201458. [DOI] [PubMed] [Google Scholar]
- 32.Futreal PA, Coin L, Marshall M, Down T, Hubbard T, Wooster R, Rahman N, Stratton MR. A census of human cancer genes. Nature Reviews Cancer. 2004;4:7. doi: 10.1038/nrc1299. [DOI] [PMC free article] [PubMed] [Google Scholar]
- 33.Downward J. Targeting RAS signalling pathways in cancer therapy. Nat Rev Cancer. 2003;3(1):12. doi: 10.1038/nrc969. [DOI] [PubMed] [Google Scholar]
- 34.Wu C, Zhu J, Zhang X. Integrating gene expression and protein-protein interaction network to prioritize cancer-associated genes. BMC bioinformatics. 2012;13:182. doi: 10.1186/1471-2105-13-182. [DOI] [PMC free article] [PubMed] [Google Scholar]
- 35.Lessner DJ, Li L, Li Q, Rejtar T, Andreev VP, Reichlen M, Hill K, Moran JJ, Karger BL, Ferry JG. An unconventional pathway for reduction of CO2 to methane in CO-grown Methanosarcina acetivorans revealed by proteomics. Proceedings of the National Academy of Sciences of the United States of America. 2006;103(47):17921–6. doi: 10.1073/pnas.0608833103. [DOI] [PMC free article] [PubMed] [Google Scholar]
- 36.Kauraniemi P, Barlund M, Monni O, Kallioniemi A. New Amplified and Highly Expressed Genes Discovered in the ERBB2 Amplicon in Breast Cancer by cDNA Microarrays. Cancer Research. 2001;61:6. [PubMed] [Google Scholar]
- 37.Lamorte L, Royal I, Naujokas M, Park M. Crk adapter proteins promote an epithelial-mesenchymal-like transition and are required for HGF-mediated cell spreading and breakdown of epithelial adherens junctions. Molecular biology of the cell. 2002;13(5):1449–61. doi: 10.1091/mbc.01-10-0477. [DOI] [PMC free article] [PubMed] [Google Scholar]
- 38.Padmanabhan RA, Nirmala L, Murali M, Laloraya M. CrkL is a Co-Activator of Estrogen Receptor α That Enhances Tumorigenic Potential in Cancer. Molecular Endocrinology. 2011;25(9):1499–1512. doi: 10.1210/me.2011-0008. [DOI] [PMC free article] [PubMed] [Google Scholar]
- 39.Paredes J, Correia AL, Ribeiro AS, Milanezi F, Cameselle-Teijeiro J, Schmitt FC. Breast carcinomas that co-express E- and P-cadherin are associated with p120-catenin cytoplasmic localisation and poor patient survival. Journal of clinical pathology. 2008;61(7):856–62. doi: 10.1136/jcp.2007.052704. [DOI] [PubMed] [Google Scholar]
- 40.Paredes J, Correia AL, Ribeiro AS, Schmitt F. Expression of p120-catenin isoforms correlates with genomic and transcriptional phenotype of breast cancer cell lines. Cellular oncology : the official journal of the International Society for Cellular Oncology. 2007;29(6):467–76. doi: 10.1155/2007/395913. [DOI] [PMC free article] [PubMed] [Google Scholar]
- 41.Saijo Y, Perlaky L, Valdez BC, Busch RK, Henning D, Zhang WW, Busch H. The effect of antisense p120 construct on p120 expression and cell proliferation in human breast cancer MCF-7 cells. Cancer letters. 1993;68(2–3):95–104. doi: 10.1016/0304-3835(93)90134-u. [DOI] [PubMed] [Google Scholar]
- 42.Pinilla SM, Honrado E, Hardisson D, Benitez J, Palacios J. Caveolin-1 expression is associated with a basal-like phenotype in sporadic and hereditary breast cancer. Breast cancer research and treatment. 2006;99(1):85–90. doi: 10.1007/s10549-006-9184-1. [DOI] [PubMed] [Google Scholar]
- 43.Agelaki S, Spiliotaki M, Markomanolaki H, Kallergi G, Mavroudis D, Georgoulias V, Stournaras C. Caveolin-1 regulates EGFR signaling in MCF-7 breast cancer cells and enhances gefitinib-induced tumor cell inhibition. Cancer biology & therapy. 2009;8(15):1470–7. doi: 10.4161/cbt.8.15.8939. [DOI] [PubMed] [Google Scholar]
- 44.Tan DS, Marchio C, Jones RL, Savage K, Smith IE, Dowsett M, Reis-Filho JS. Triple negative breast cancer: molecular profiling and prognostic impact in adjuvant anthracycline-treated patients. Breast cancer research and treatment. 2008;111(1):27–44. doi: 10.1007/s10549-007-9756-8. [DOI] [PubMed] [Google Scholar]
- 45.Stein D, Wu J, Fuqua SA, Roonprapunt C, Yajnik V, D’Eustachio P, Moskow JJ, Buchberg AM, Osborne CK, Margolis B. The SH2 domain protein GRB-7 is co-amplified, overexpressed and in a tight complex with HER2 in breast cancer. EMBO J. 1994;13(6):1331–40. doi: 10.1002/j.1460-2075.1994.tb06386.x. [DOI] [PMC free article] [PubMed] [Google Scholar]
- 46.Ravid D, Chuderland D, Landsman L, Lavie Y, Reich R, Liscovitch M. Filamin A is a novel caveolin-1-dependent target in IGF-I-stimulated cancer cell migration. Experimental cell research. 2008;314(15):2762–73. doi: 10.1016/j.yexcr.2008.06.004. [DOI] [PubMed] [Google Scholar]
- 47.Tulchin N, Chambon M, Juan G, Dikman S, Strauchen J, Ornstein L, Billack B, Woods NT, Monteiro AN. BRCA1 protein and nucleolin colocalize in breast carcinoma tissue and cancer cell lines. The American journal of pathology. 2010;176(3):1203–14. doi: 10.2353/ajpath.2010.081063. [DOI] [PMC free article] [PubMed] [Google Scholar]
- 48.Li J, Yang L, Song L, Xiong H, Wang L, Yan X, Yuan J, Wu J, Li M. Astrocyte elevated gene-1 is a proliferation promoter in breast cancer via suppressing transcriptional factor FOXO1. Oncogene. 2009;28(36):3188–96. doi: 10.1038/onc.2009.171. [DOI] [PubMed] [Google Scholar]
- 49.Li J, Zhang N, Song LB, Liao WT, Jiang LL, Gong LY, Wu J, Yuan J, Zhang HZ, Zeng MS, Li M. Astrocyte elevated gene-1 is a novel prognostic marker for breast cancer progression and overall patient survival. Clinical cancer research : an official journal of the American Association for Cancer Research. 2008;14(11):3319–26. doi: 10.1158/1078-0432.CCR-07-4054. [DOI] [PubMed] [Google Scholar]
- 50.Marty B, Maire V, Gravier E, Rigaill G, Vincent-Salomon A, Kappler M, Lebigot I, Djelti F, Tourdès A, Gestraud P. Frequent PTEN genomic alterations and activated phosphatidylinositol 3-kinase pathway in basal-like breast cancer cells. Breast Cancer Res. 2008;10(6):R101. doi: 10.1186/bcr2204. [DOI] [PMC free article] [PubMed] [Google Scholar]
- 51.Cheol Kim D, Thorat MA, Lee MR, Cho SH, Vasiljević N, Scibior-Bentkowska D, Wu K, Ahmad AS, Duffy S, Cuzick JM. Quantitative DNA methylation and recurrence of breast cancer: A study of 30 candidate genes. Cancer Biomarkers. 2011;11(2):75–88. doi: 10.3233/CBM-2012-0266. [DOI] [PMC free article] [PubMed] [Google Scholar]
- 52.McKiernan E, McDermott EW, Evoy D, Crown J, Duffy MJ. The role of S100 genes in breast cancer progression. Tumour biology : the journal of the International Society for Oncodevelopmental Biology and Medicine. 2011;32(3):441–50. doi: 10.1007/s13277-010-0137-2. [DOI] [PubMed] [Google Scholar]
- 53.Ferguson AT, Evron E, Umbricht CB, Pandita TK, Chan TA, Hermeking H, Marks JR, Lambers AR, Futreal PA, Stampfer MR, Sukumar S. High frequency of hypermethylation at the 14-3-3 sigma locus leads to gene silencing in breast cancer. Proceedings of the National Academy of Sciences of the United States of America. 2000;97(11):6049–54. doi: 10.1073/pnas.100566997. [DOI] [PMC free article] [PubMed] [Google Scholar]
- 54.Lodygin D, Hermeking H. Epigenetic silencing of 14-3-3sigma in cancer. Seminars in cancer biology. 2006;16(3):214–24. doi: 10.1016/j.semcancer.2006.03.008. [DOI] [PubMed] [Google Scholar]
- 55.Levine JJ, Stimson-Crider KM, Vertino PM. Effects of methylation on expression of TMS1/ASC in human breast cancer cells. Oncogene. 2003;22(22):3475–3488. doi: 10.1038/sj.onc.1206430. [DOI] [PubMed] [Google Scholar]
- 56.Vaught D, Brantley-Sieders DM, Chen J. Eph receptors in breast cancer: roles in tumor promotion and tumor suppression. Breast Cancer Res. 2008;10(6):217. doi: 10.1186/bcr2207. [DOI] [PMC free article] [PubMed] [Google Scholar]
- 57.Larsen AB, Pedersen MW, Stockhausen MT, Grandal MV, van Deurs B, Poulsen HS. Activation of the EGFR gene target EphA2 inhibits epidermal growth factor–induced cancer cell motility. Molecular cancer research. 2007;5(3):283–293. doi: 10.1158/1541-7786.MCR-06-0321. [DOI] [PubMed] [Google Scholar]
Associated Data
This section collects any data citations, data availability statements, or supplementary materials included in this article.