

Abstract
Protein glycosylation represents one of the major post translational modifications and can have significant effects on protein function. Moreover, changes in the carbohydrate structure are increasingly being recognized as an important modification associated with cancer etiology. In this report, we describe the development of a proteomics approach to identify breast cancer related changes in either concentration and/or the carbohydrate structures of glycoprotein(s) present in blood samples. Diseased and healthy serum samples were processed by an optimized sample preparation protocol using multiple lectin affinity chromatography (M-LAC) that partitions serum proteins based on glycan characteristics. Subsequently, three separate procedures, 1D SDS-PAGE, isoelectric focusing and an antibody microarray, were applied to identify potential candidate markers for future study. The combination of these three platforms is illustrated in this report with the analysis of control and cancer glycoproteomic fractions. Firstly, a molecular weight based separation of glycoproteins by 1D SDS-PAGE was performed, followed by protein, glycoprotein staining, lectin blotting and LC-MS analysis. To refine or confirm the list of interesting glycoproteins, isoelectric focusing (targeting sialic acid changes) and an antibody microarray (used to detect neutral glycan shifts) were selected as the orthogonal methods. As a result, several glycoproteins including alpha-1B-glycoprotein, complement C3, alpha-1-antitrypsin and transferrin were identified as potential candidates for further study.
Keywords: High performance multi-lectin affinity chromatography, lectin blotting, isoelectric focusing, lectin – antibody microarray
1. Introduction
According to the World Health Organization, breast cancer is one of the most frequent types of cancer among women. In 2008, the estimated new cases and deaths from breast cancer in the United States were 182,460 and 40,480 for female; 1,990 and 450 for male [1]. Several studies have discovered a few breast cancer associated tissue markers, such as estrogen and progesterone receptors, HER2/neu (erbB2), p53, Ki-67/MIB-1 and vascular endothelial growth factor (VEGF), as well as circulating markers, such as carcinoembryonic antigen (CEA), CA15.3, CA549, tissue polypeptide antigen (TPA), mucin-like carcinoma associated antigen (MCA), protease cathepsin D, and chaperone 14-3-3 sigma [2,3]. However, breast cancer is such a heterogeneous disease that a study at the protein level without information about post translational modifications is probably insufficient for either diagnosis or monitoring of disease treatment.
As one of the most important post translational modifications, glycosylation modulates the physical, chemical and biological properties of a protein [4,5]. As a protein itself carries limited information derived from genome, the oligosaccharide variation greatly diversifies the biological functions. Glycan structures can be important determinants for many different processes, including protein-protein interactions, protein trafficking and folding, immune recognition, cell adhesion and migration, and inter-cellular signaling [6]. As has been observed for over 40 years, aberrant glycans have been considered to play a critical role in cancer biology by mediating tumor cell adhesion, motility and invasiveness [7–10]. In this manner, we and others [11, 12] believe that the discovery of breast cancer associated aberrant glycans has the potential of providing significant information to elucidate disease mechanisms, as well as improving diagnosis and treatment strategies.
Lectin chromatography is one of the most efficient strategies for fractionating glycoproteins because of the wide variety of lectins with different glycan specificities. We have shown that a multi-lectin affinity column (M-LAC) containing Concanavalin A (Con A), Wheat germ agglutinin (WGA) and Jacalin (JAC) provides a comprehensive capture of glycoproteins from biological fluids thus enhancing the glycoprotein or glycoform analysis [13, 14]. Also, it has been indicated that the multi-lectin affinity column (M-LAC) is sensitive to changes in the content of glycan present in serum glycoproteins, and has the potential to be used to screen serum proteins for glycosylation changes due to disease [11]. Recently, the multi-lectin HPLC column (high-performance multi-lectin affinity chromatography (HP-MLAC)) has been developed for fast chromatographic affinity separations. A single clinical sample can be fractionated in less than 10 min per run [15] into two glycoproteomes based on different lectin affinities. The combination of high abundance protein depletion and efficient glycoprotein fractionation can facilitate the analysis of plasma or serum sample sets for clinical glycoproteomic studies.
Cancer related aberrant glycan structures often include differences in sialylation, fucosylation and branching [5,16]. In view of the complexity of the potential glycan changes in disease, together with changes in protein abundance, it is challenging to identify candidate biomarkers for further studies. Therefore, we applied multiple orthogonal platforms to the M-LAC fractions to detect significant breast cancer associated glycan changes. We chose stage II, breast cancer sample for this study with the expectation that a higher level of glycan changes would be present than in the early disease state (stage I). The first platform used was 1D SDS-PAGE, which allowed the characterization of the glycoproteins by multiple detection methods such as protein, glycoprotein staining and in-gel digestion followed by LC-MS/MS analysis of proteins present in a given band. For example, we used the lectin Sambucus nigra bark (SNA) to detect glycan changes of sialic acid [17], and the lectin Aleuria aurantia (AAL) for fucose-containing disaccharides present on glycoconjugates [18]. To provide additional information about the significance of any detected protein(s), we then used two analytical platforms, an isoelectric focusing chip and an antibody microarray. The IEF digital ProteomeChip (dPC) was used to detect glycoproteins with sialic acid changes in disease relative to control samples. As a demonstration of the use of antibody microarrays with lectin read-out, we evaluated neutral sugar changes of a promising serum glycoprotein in individual samples. As a result, the effective integration of the M-LAC platform with the synergistic analytical platforms described above has allowed the identification of several glycoproteins for future studies of breast cancer association.
2. Experimental and methods
2.1. Sera samples
Ten serum samples were obtained from the repository held at the Fred Hutchinson Cancer Center and were provided by Dr. Samir Hanash’s laboratory; all samples have been collected with IRB approval. We received five samples from individual patients with breast cancer stage 2, and five healthy females’ serum matched by age and race. In this study, 250 μL aliquots from five control samples (50 μL from each individual) were pooled to give large sample amounts for our method development studies. Sera from breast cancer patients followed the same procedure. All the samples were stored at −75 °C and did not undergo more than two freeze / thaw cycles. In addition, ten female serum samples were purchased from Bioreclamation (Jericho, NY) and used as reference sera for method development, including testing the platform stability, recovery and reproducibility. The sera were aliquoted 50 μL per vial and stored at −75 °C.
2.2. Preparation of HPLC columns
The high-performance multi-lectin affinity column (HP-MLAC) was packed with POROS 20-AL beads (Applied Biosystems, Framingham, MA) to which concanavalin A (ConA), wheat germ agglutinin (WGA) and jacalin (JAC) (Vector Laboratories, Burlingame, CA) were immobilized through reductive amination reaction using cyanoborohydride [15]. Beads conjugated with different lectins (ConA, WGA and JAC) were mixed at a ratio of 1:1:1 and packed into a PEEK column (4.6mm × 100mm) (Isolation Technology, Milford, MA). The reversed-phase column (PEEK 4.6mm × 30mm) contained POROS® R1 50 μm Bulk Media (RP-trap) (Applied Biosystems, Framingham, MA). Both the HP-MLAC and the RP-trap were packed under high pressure using a self-packing device (Applied Biosystems, Framingham, MA). Albumin depletion beads and Capture-Select® affinity ligands with specificity for immunoglobulins M, A and G (BAC. B.V., the Netherlands) were prepared as 50% slurry with binding buffer (25mM Tris, 0.5M sodium chloride, 1mM MnCl2, 1mM CaCl2 and 0.05% sodium azide, pH 7.4) and gravity packed into omnifit glass columns (Biochem Fluidics, Boonton, New Jersey) to prepare the albumin (10mm × 20mm) and immunoglobulin (6.6mm × 20mm) depletion columns. The albumin, Ig M, A, G depletion column and HP-MLAC column were connected serially and equilibrated with binding buffer prior to serum fractionation.
2.3. High abundance proteins depletion and glycoprotein fractionation
Depletion and fractionation were performed on a BioCad chromatography workstation (Applied Biosystems, Foster City, CA). Depletion, M-LAC and RP-trap columns were placed at three valves in tandem. The on/off-line status of a column could be controlled by switching the valves. During the separation run, all the columns were firstly equilibrated with binding buffer at 3 mL/min for 5 min. Serum sample (50μL) was diluted with binding buffer (1:3) and loaded at 0.5 mL/min for 22 min onto the columns. The flow rate was then increased to 3 mL/min for an additional 4 min. The depleted, M-LAC unbound fraction was captured by the RP-trap column, and subsequently desalted by 0.1% trifluoroacetic acid (TFA)/5% acetonitrile (MeCN); proteins were eluted with 0.1% TFA/70% MeCN. RP-trap column was equilibrated again with 5% MeCN with 0.1% TFA after the elution. Albumin, IgM, IgA and IgG were eluted with four column volumes (CV) of glycine buffer (0.2M glycine and 0.05% sodium azide, pH 2.5) at 3 mL/min. The M-LAC bound glycoproteins were eluted from M-LAC column and captured by the RP-trap column with 5CV of 100mM acetic acid at a flow rate of 3 mL/min. Elution and equilibration of this M-LAC bound fraction from the RP-trap column was the same as the unbound. Albumin and Ig M, A, G depletion columns were then neutralized with neutralization buffer (0.5M Tris base, 1M sodium chloride and 0.05% sodium azide, pH 8.0) at 3 mL/min for 7 min. The M-LAC unbound and bound fractions were concentrated by SpeedVac and the collected albumin and Ig M, A, G were concentrated with an Amicon 5kDa molecular weight cut off filter (Millipore, MA) to 2mL at 3000 × g.
2.4. 1D SDS-PAGE analysis and lectin blotting of M-LAC bound fractions
The M-LAC bound fractions derived from breast cancer and control samples were loaded on the SDS-PAGE gel (NuPAGE® Novex 4–12% Bis-Tris) and run in the XCell SureLock™ Mini-Cell (Invitrogen, Carlsbad, CA) for 2 h at 200V. Twenty micrograms and ten micrograms were used for total protein detection (with SimplyBlue Safestain) and glycoprotein staining (with Pro-Q Emerald 300 Glycoprotein Gel and Blot Stain Kit), respectively. The staining procedures were performed following the manufacturer’s instruction.
For lectin blotting, two sets of breast cancer and control M-LAC bound fractions (2.5μg of each sample) were loaded onto a SDS-PAGE gel (NuPAGE® Novex 4–12% Bis-Tris) and run under the same condition as described above. Proteins were transferred to nitrocellulose membrane in the XCell II™ Blot Module (Invitrogen, Carlsbad, CA) for 1 h at 30V. The membrane was then blocked in 1X Tris-Buffered Saline with 0.5% Tween-20 (TBST) for 1 h at 4°C, followed by cutting into 2 panels. Each panel contains one breast cancer and one control M-LAC bound fraction. Each membrane piece was then incubated for 1 h at 4°C with different biotinylated lectins, including lectin Sambucus nigra (SNA) and lectin Aleuria aurantia (AAL) (Vector Laboratories, Burlingame, CA) at 1 μg/mL. The lectins were removed and the membranes were washed three times with 1X TBST for 15 min each time; streptavidin-HRP (Vector Laboratories, Burlingame, CA) was added to the membranes at the concentration of 1μg/mL and incubated for 1 h at 4°C; the membranes were then washed as indicated above; followed by a final wash with 1X PBS for 5 min. Chemiluminescence was accomplished by adding SuperSignal West Pico Chemiluminescent Substrate (Pierce, Rockford, IL) and lectin blotting was detected with FluorChem SP (Alpha Innotech, San Leandro, CA).
2.5. Trypsin in-gel digestion of gel bands of interest
Protein bands of interest (based on differential lectin binding) were excised from the gel stained with Coomassie blue, and minced into pieces (1mm×1mm×1mm). Destaining was performed by washing the gel pieces with ammonium bicarbonate buffer (0.1 M, pH 8.0) and acetonitrile in alternating fashion up to 3 cycles. After the last round of wash, proteins in the dehydrated gel pieces were subjected to reduction by adding 250 μL of 10 mM DTT in 0.1 M NH4HCO3 at 56 °C for 30 min. Alkylation was performed at room temperature in the dark for 1 h by adding 250 μL of 55 mM iodoacetamide (IAA) in 0.1 M NH4HCO3. Gel pieces were dehydrated again with acetonitrile, 250 μL of trypsin (8 ng/μL in 50 mM NH4HCO3, pH 8.0) was added, and the samples were incubated for 30 min at 4 °C. The solution was then replaced with 50 mM NH4HCO3 to cover the gel pieces and the samples were incubated at 37 °C overnight (~16 h). Digested peptides were extracted by adding acetonitrile, and the supernatant was removed and transferred to a clean vial. Thirty microliters of 3% formic acid was added to the gel pieces and incubated with shaking at 37 °C for 10 min. Acetonitrile was used to extract the remaining peptides from the gel, and the supernatant was combined with the previous collected fraction. The resulting solution was concentrated by SpeedVac and subjected to LC-MS/MS analysis.
2.6. Isoelectric focusing (IEF) analysis with a digital ProteomeChip (dPC)
Fifty micrograms of M-LAC bound proteins derived from control and breast cancer were subjected to denaturation, reduction and alkylation following the manufacturer’s instruction. Desalted samples were then applied to dPC pH4.20~6.20 or pH6.00~8.00. Forty-one gel plugs were extruded from each dPC, and each eight gel plugs were pooled together as one fraction. The resulting IEF fractions (five fractions for each dPC) were subjected to tryptic in-gel digestion following the manufacturer’s instruction.
2.7. Mass spectrometry analysis
The nano-LC-MS/MS was performed using an Eksigent 1D+ nano-LC system (Dublin, CA) interfaced with an LTQ-Orbitrap linear ion trap hybrid mass spectrometer (ThermoFisher Scientific, Waltham, MA). Buffer A was 0.1% v/v of formic acid (FA) in HPLC grade water (Honeywell, Morristown, NJ) and buffer B was 0.1% v/v of formic acid (FA) in HPLC grade acetonitrile (Honeywell). The peptide samples were loaded onto a Symmetry C18 trap column (5μm; 180μm × 20mm) (Waters, Millford, MA) by an autosampler and desalted at 5 μL/min for 12 min using 100% buffer A. The peptides were directed to a C18 analytical column, made from a PicoFrit (New Objective, Woburn, MA), packed with 5μm (75μm × 250mm) Magic C18AQ reversed phase beads (Michrom Bioresources, Auburn, CA). The peptides were separated using the following gradient: 4.8% of buffer B for the first 5 min; then buffer B was increased from 4.8% to 40% over 105 min; from 40% to 80% over 15 min and held isocratically at 80% for 10 min; Buffer B decreased from 80% to 4.8% in 1 min and held isocratically at 4.8% for 9 min. The flow rate was 300 nL/min and the method was 145min in total. The mass spectrometer conditions were as follows: ion transfer tube temperature, 200 °C; nano-electrospray voltage, 2.25 kV; normalized collision energy, 35%; ion isolation width. 2 m/z; Orbitrap FullMS target value, 1e6; Ion trap MSn target value, 1e4. The data dependent MS/MS analysis was carried out using the Xcalibur MS acquisition software (Xcalibur 2.0.7, ThermoFisher Scientific). Each scan cycle consisted of first a full scan MS acquired in profile mode at 60K resolution in the Orbitrap analyzer over the mass range 400 – 1800 m/z, followed by up to 5 data-dependent MS/MS scans of the 5 most intense peaks. The Dynamic exclusion parameters were set as follows: repeat count, 1; repeat duration, 30 sec.; exclusion list size, 100; exclusion list duration, 45 sec.; exclusion mass width, 0.55 m/z low and 1.55 m/z high. The FTMS preview scan was activated to allow parallel operation of the LTQ and Orbitrap. Charge state screening was used to allow only +2 and +3 peptides to be interrogated by MS/MS while rejecting +1, +4 and higher and unassigned charge states.
2.8. Bioinformatics
The generated MS/MS spectra were searched against the SwissProt 54.2 using the Computational Proteomics Analysis System (CPAS) version 8.2 [19]; Bioworks 3.2 (Thermo Electron Corp, San Jose, CA). To increase the confidence of the identifications, the false positive rate was calculated using a reverse database; in addition, the correlation scores (Xcorr) were set as follows: peptides of singly, doubly and triply charged would only be accepted if they have Xcorr values higher than 1.9, 2.2 and 3.8, respectively; the delta CN of peptides were set to be higher than 0.1; the PeptideProphet probability score was higher than 0.95; the criteria for the Fractional Delta Mass PPM for acceptance of parent ion masses were 50 ppm. Other parameters used in this search were as follows: full trypsin as enzyme; carboxyamidomethylation (C) as fixed modification; two missed cleavages; precursor ion mass tolerance was 2.5 Da and fragment ion mass tolerance was 1.0 Da. The resulting peptide list of each fraction was uploaded onto Mass Spec Results Analysis Tool (MSRAT) Bioinformatics Software (Protein Forest, Inc.) for the comparison between control and disease samples.
2.9. Antibody Microarray
2.9.1 Antibody microarray production and preparation
A piezoelectric non-contact printer (Piezorray, PerkinElmer Life Sciences, Waltham, MA) was used to spot approximately 350 pL of each antibody solution at a concentration of 250 μg/mL on the surfaces of ultrathin nitrocellulose-coated microscope slides (PATH slides, GenTel Biosciences, Madison, WI). Forty-eight identical arrays containing triplicates of anti-transferrin antibody were printed on each slide, spaced by 4.5 mm, arranged with four arrays across the width of the slide and 12 arrays along the length. A wax border was imprinted around each of the arrays to define hydrophobic boundaries (SlideImprinter, The Gel Company, San Francisco, CA) [20]. The slides were stored in a vacuum-sealed container with silicone desiccant at 4°C. When ready to use, the slides were restored to room temperature before breaking the vacuum seal (to prevent condensation on the slides) and washed in PBS buffer containing 0.1% Tween-20 (PBST-0.1) three times for 3 min each to remove unbound antibodies and to clean the surfaces.
Antibody arrays used for lectin detection were first chemically derivatized to prevent nonspecific binding of lectins to antibody glycans without interfering with antibody specificity [6]. This was achieved by incubating the slides in a coupling buffer (0.1M sodium acetate, pH5.5) with 0.1% Tween-20 for 10 min, then transferred to a 200 mM NaIO4 solution in coupling buffer (Pierce Biotechnology, Rockford, IL) and incubated at 4°C for 5 h in the dark to oxidize the glycan groups on printed antibodies. The slides were rinsed in coupling buffer and incubated with a solution containing 1mM MPBH (4-(4-N-Maleimidophenyl) butyric acid hydrazide hydrochloride) and 1 mM Cysteine-Glycine dipeptide (Pierce Biotechnology, Rockford, IL) in coupling buffer for 2 h at room temperature to derivatize the carbonyl groups. The slides were rinsed with PBST-0.1 and incubated with 1 mM Cysteine-Glycine in PBST-0.1 at 4°C overnight. After, the slides were returned to room temperature and rinsed thoroughly with PBS buffer containing 0.5% Tween-20 (PBST-0.5) and dried by centrifuging (Eppendorf 5810R, rotor A-4-62), at 900 RPM for 1 min.
2.9.2 Antibody microarray assays
The printed antibody arrays were used to detect glycan structures on captured proteins, using the high-throughput methods previously described [20, 21]. The slides printed with antibody arrays were blocked in a 1% BSA solution in PBST-0.5 for 1 h. After blocking, the slides were washed in PBST-0.1 three times, 3 min each, and dried by centrifugation. Control and breast cancer patient sera were diluted 2000-fold in PBST-0.1 with 1/10 volume of 10X protease inhibitor cocktail, and 6 μL of sample was applied to each array. After 1 h incubation, the slides were washed with PBST-0.1 and dried. Biotinlabeled Aleuria Aurantia Lectin (AAL), Ricinus Communis Agglutinin (RCA), Bauhinia Purpurea Lectin (BPL), Concanavalin A (ConA) and Soybean Agglutinin Lectin (SBA) (Vector Laboratories, Burlingame, CA) were diluted to a concentration of 10 μg/mL in PBST-0.1 containing 0.1% BSA. The arrays were incubated with the lectins for 1 h, washed and dried, and incubated with 2.5 μg/mL streptavidin-phycoerythrin (Invitrogen, Carlsbad, CA) for another hour. The slides were washed, dried, and scanned for fluorescence emission from phycoerythrine at 570 nm using a microarray scanner (LS Reloaded, TECAN, Durham, NC).
2.9.3 Microarray data analysis
All arrays probed with the same lectin were scanned in one batch at a single laser power and detector gain setting of 160 pmt. The produced image data was quantified using microarray image processing software (GenePix Pro 5.0, Axon Instruments, Union City, CA). Spots were identified using automated spot-finding with manual adjustments for sporadic irregularities. The local backgrounds were subtracted from the median intensity of each spot, yielding the net signal. Spots with morphology defects or highly abnormal backgrounds were eliminated from the analysis. The signal intensities from triplicate antibody measurements were averaged using the geometric mean, and the Student’s t-test in Microsoft Excel was used to compare data between control and cancer groups.
3. Results and Discussion
3.1. Description of experimental workflow
The workflow used in this study is shown in Fig. 1, which represents an integrated platform with depletion and fractionation steps for isolating the M-LAC bound glycoproteome, together with the application of three orthogonal analytical platforms (See i–iii in Fig. 1). Due to the large dynamic range of serum proteome, high abundance protein depletion is usually the initial step in proteomic studies. It has been suggested that the depletion of albumin and immunoglobulins, which account for ~76% protein abundance in normal serum [22], can facilitate the discovery and detection of medium to low abundance proteins [23,24]. Moreover, the depletion of the top 6 proteins (albumin, IgG, alpha-1-antitrypsin, IgA, transferrin and haptoglobin), which account for 85~90% of the whole proteome, by Multiple Affinity Removal System (MARS) can further extend the detected dynamic range of plasma/serum proteome [25–28]. Thus, a strategy of depleting 6 abundant proteins was applied to this study before the M-LAC fractionation to enhance the investigation of medium to low abundance proteins. However, depletion could lead to bias of results by introducing a counterbalancing problem, namely inadvertent removal of a protein of interest by non-specific binding to the column or through interactions with depleted proteins [29]. For example, complement C3 has been reported to be detected in MARS bound fraction [30], which is relevant to the study described here. Therefore, a different level of depletion, four-protein (albumin, Ig M, A, G) removal instead of MARS, was used to study this protein and it was shown to exhibit low level of non specific binding (manuscript in preparation). After depletion, the serum sample was fractionated by the high performance multi-lectin affinity column (HP-MLAC) into two glycoprotein fractions based on lectin affinities [15]. The M-LAC bound glycoprotein fraction was shown on SDS-PAGE to contain a more diverse range of glycoproteins than the unbound fraction [13] and thus was selected for this study where we will demonstrate the value of integration of three orthogonal analytical approaches. Platform (i) consists of the separation of the M-LAC bound fraction with 1D SDS-PAGE, followed by total protein (Coomassie Blue) and glycoprotein staining, as well as lectin blotting (see below). Also shown in Fig. 1 is the further analysis of M-LAC bound fraction (after different depletion strategies) by isoelectric focusing using platform (ii) with the digital ProteomeChip (d PC). As an orthogonal method to IEF (targeting glycan differences in terms of charge), platform (iii), an antibody array coupled with a fucose specific lectin, was used to monitor neutral sugar differences.
Fig. 1.
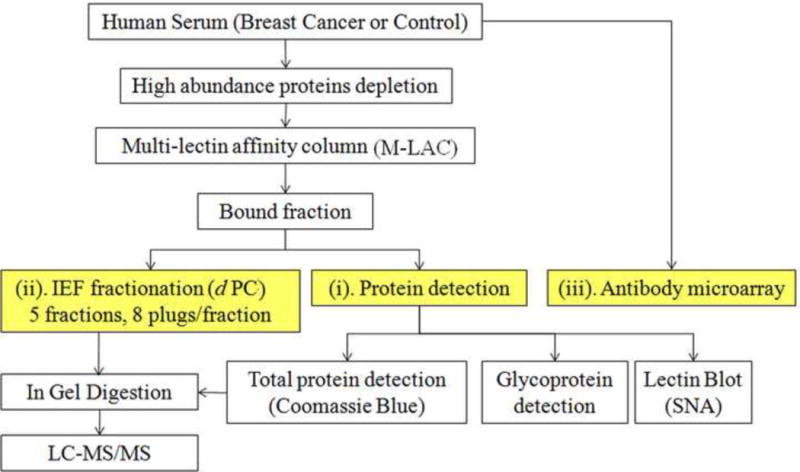
Work flow of the proteomics platform used to measure changes in the serum glycoproteome with breast cancer. The method involves immunodepletion of abundant proteins, glycoprotein fractionation using M-LAC and further analysis by isoelectric focusing (IEF) using the digital ProteomeChip (dPC). The M-LAC bound glycoproteins were also analyzed by 1D SDS-PAGE, followed by different protein detection methods.
3.2. Characterization of selected proteins from 1D SDS-PAGE (Platform i)
In Fig. 2, we show the result of 1D SDS-PAGE analysis of the isolated glycoproteome (M-LAC bound proteins). The depletion strategy upstream of platform (i) includes the removal of only albumin, Ig M, A, G because the abundant glycoproteins depleted by the MARS column, such as alpha-1-antitrypsin, transferrin and haptoglobin may be of interest in cancer studies. Protein bands were visualized by Coomassie blue staining (Fig. 2a) and the control and breast cancer (BC) samples show similar abundance patterns with approximately 20 bands that could be visualized with this stain; except for band 17, which shows a significant decrease in the cancer sample. Glycoprotein bands were detected by fluorescent staining through a periodic acid cleavage-Schiff base (Fig. 2b) and some differences in staining were observed between the disease and control sample. For example, reduced staining was observed for band 17 in lanes C and D. As a third detection method, glycan changes present in different gel bands were examined with lectin blotting. In Fig. 2c, we show the corresponding result for lectin blotting with biotinylated lectin sambucus nigra (SNA) and subsequent chemiluminescence detection. With this detection method, band 13, 14 and 15 in lanes E and F are found to be more intense in breast cancer than control serum and are denoted with arrows in Fig. 2c. We demonstrated the reproducibility of the biotinylated SNA staining of gel bands in lanes E and F in triplicate analyses (data not shown). In addition, some significant differences were observed between the glycoprotein and lectin staining, for example, band 9, 10, 17 and 19 in lanes D vs. F, which indicates that the glycoprotein concentration and glycan structures (as recognized by lectins) are independent variables.
Fig. 2.
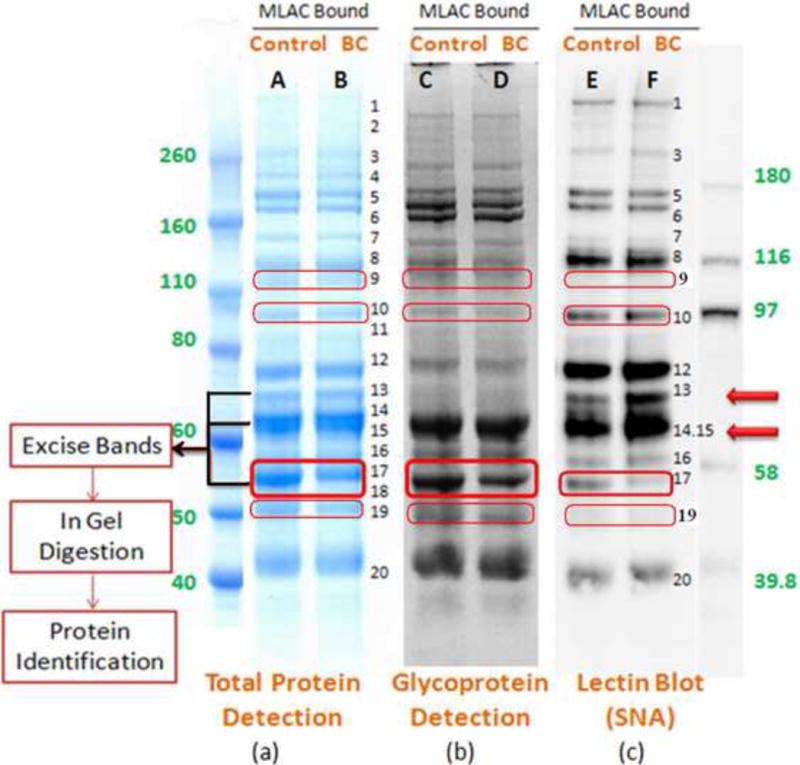
Analysis of the bound glycoprotein fractions from M-LAC on 1D SDS-PAGE followed by different detection methods. Equal amounts of M-LAC bound glycoproteins derived from control and breast cancers (BC) were separated, followed by (a) Coomassie Blue protein staining; (b) fluorescent glycoprotein staining; and (c) lectin blotting to detect glycoproteins with biotinylated SNA. Lane A, C and E were loaded with 20, 10 and 2.5μg of the control M-LAC bound fraction, respectively; Lane B, D and F were loaded with 20, 10 and 2.5μg of the breast cancer M-LAC bound fraction, respectively.
Since bands 13, 14, 15 and 17 contain proteins of interest based on differential lectin staining, they were excised from the SDS-PAGE gel stained with Coomassie Blue, followed by in gel digestion and LC-MS/MS analysis. Although lectin blotting has been shown to be a valuable approach for initial screening of glycoprotein changes in cancer samples [10, 31], the low resolution of the 1D SDS-PAGE results in a band containing more than one abundant protein of interest. In Table 1, we present the results of LC-MS/MS analysis of the gel bands showing differential lectin binding, and indeed these bands contain several proteins of significant relative abundance. Also in Table 1, we show the correlation between the observed molecular weights with literature values. We prioritized the identified glycoproteins based on amount (more likely to be a major contributor to the differential lectin response) and on degree of difference in the disease vs. control sample (MS based spectral count). In this manner, complement C3 (CO3) beta chain, complement C4-A (CO4A) beta chain, hemopexin (HEMO), alpha-1B-glycoprotein (A1BG), alpha-1-antitrypsin (A1AT), and antithrombin-III (ANT3) were given a high priority, together with transferrin (TRFE, identified in band 12) which will be discussed in section 3.4.
Table 1.
Identification of glycoproteins by 1D SDS-PAGE and MS analysisa
| Band | Protein / Fragments c | Molecular Weight (kDa)d | Peptide Hits (total)e | Glycosylation sitesf | ||
|---|---|---|---|---|---|---|
| No.b | Theoretical | Observed | Control | BC | ||
| 12 | Transferring | 75 | ~75 | 32 | 29 | N-251, 317, 727; O-104 |
| Inter-alpha-trypsin inhibitor heavy chain H1 | 71 | ~75 | 11 | 11 | N-285, 588, 750: O-653: S-60 | |
| Insulin-like growth factor binding protein complex acid labile chain | 63 | ~75 | 8 | 10 | N-64, 85, 96, 368, 515, 580 | |
| Afamin | 67 | ~75 | 9 | 9 | N-33, 109, 402, 488 | |
| 13 | Complement C3 β chaing | 71 | ~ 70 | 24 | 49 | N-85 |
| Complement C4-A β chain | 72 | ~ 70 | 20 | 28 | N-226 | |
| C4b-binding protein alpha chain | 62 | ~ 70 | 10 | 14 | N-221, 506, 528 | |
| Histidine-rich glycoprotein | 58 | ~ 70 | 6 | 7 | N-63, 125, 344, 345 | |
| Inter-alpha-trypsin inhibitor heavy chain H1 | 71 | ~ 70 | 5 | 8 | N-285, 588; O-653; S-60 | |
| 14, 15 | Hemopexin | 49 | ~62 | 30 | 30 | N-64, 187, 240, 246, 453; O-24 |
| Alpha-1B-glycoproteing | 52 | ~62 | 11 | 18 | N-44, 179, 363, 371 | |
| Vitronectin | 52 | ~62 | 8 | 3 | N-86, 169, 242 | |
| Angiotensinogen | 50 | ~62 | 4 | 5 | N-47, 170, 304, 328 | |
| Beta-Ala-His dipeptidase | 54 | ~62 | 4 | 5 | N-322, 382 | |
| N-acetylmuramoyl-L-alanine amidase | 60 | ~62 | 4 | 5 | N-77, 367, 485 | |
| 17 | Alpha-1-antitrypsing | 44 | ~55 | 88 | 24 | N-70, 107, 271 |
| Antithrombin – III | 49 | ~55 | 20 | 11 | N-128, 167, 187, 224 | |
| Kininogen-1 heavy chain | 41 | ~55 | 17 | 10 | N-48, 169, 205, 294; O-401, 533, 542, 546, 557, 571, 577, 628 | |
| Kallistatin | 46 | ~55 | 7 | 7 | N-33, 108, 157, 238 | |
| Vitamin D-binding protein | 51 | ~55 | 12 | 2 | N-288 | |
| Alpha-2-antiplasmin | 50 | ~55 | 8 | 1 | N-126, 295, 309, 316 | |
| Angiotensinogen | 50 | ~55 | 5 | 1 | N-47, 170, 304, 328 | |
| Alpha-1-antichymotrypsin | 45 | ~55 | 4 | 3 | N-33, 93, 106, 127, 186, 271 | |
| Corticosteroid-binding globulin | 43 | ~55 | 4 | 2 | N-31, 96, 176, 260, 330, 369 | |
Note:
1D SDS-PAGE was performed on M-LAC bound glycoproteome following 4 proteins (albumin, Ig M, A, G) depletion.
Band numbers in SDS-PAGE as measured by Coomassie blue detection
Major proteins identified by LC-MS/MS analysis
The observed molecular weight could be expected to be higher than the theoretical value due to either post translational modification or anomalous migration, which is the result of the altered hydrodynamic radius of the glycans vs. the polypeptide backbone [38,39]. Theoretical molecular weight of the polypeptide chain was calculated based on full length without signal peptide.
Abundance as measured by Spectral counts (MS/MS sequencing).
Glycosylation sites as recorded by the protein database in Swiss-Prot [40]
Proteins of interest with high level of peptide hits both in control and disease samples, and showing disease specific differences (protein and/or glycan level).
3.3. The application of isoelectric focusing to detect charged glycan change (Platform ii)
Another procedure for prioritizing the glycoproteins identified in the 1D SDS-PAGE gel (section 3.2) is to measure the corresponding pI profiles of individual proteins present in the starting glycoprotein fraction. We therefore applied platform (ii), using the digital ProteomeChip (dPC) which is a new chip based IEF system. The d PC uses parallel isoelectric focusing technology [32] and it is able to fractionate complex proteomic samples based on the protein isoelectric point (pI). In collaboration with the manufacturer, we have demonstrated excellent chip to chip reproducibility in replicate analysis (manuscript in preparation). One advantage of this new platform is that the pI profiles of abundant glycoproteins can be directly measured by semi-quantitative LC/MS analysis (spectral counts) followed by trypsin digestion of the IEF fractions.
Hence, the IEF profiles of all proteins listed in Table 1 could be obtained with the digital ProteomeChip (dPC) analysis. The resulting pI profiles were used to further prioritize proteins of interest present in a given gel band (see Fig. 2a). For example, for two closely migrating bands 14 and 15, which were excised together, hemopexin, alpha-1B-glycoprotein, vitronectin, angiotensinogen, beta-ala-his dipeptidase, and N-acetylmuramoyl-L-alanine amidase were identified (Table 1) and their corresponding pI profile analyses are shown in Fig. 3. Although hemopexin is the most abundant protein in bands 14 and 15, it is less likely to be responsible for the observation of increased SNA binding as the pI profile between control and disease are very similar, as shown in Fig. 3a. Similarly, vitronectin and beta-ala-his dipeptidase have equivalent patterns between control and disease samples (Fig. 3c and e). On the other hand, the pI profiles for angiotensinogen (Fig. 3d) and N-acetylmuramoyl-L-alanine amidase (Fig. 3f) indicate a decreased amount or a minor pI shift in the disease case. However, these two proteins are not considered to be the major contributor to the increased sialylation detected by lectin blotting in the disease case due to their low levels in the gel band (Table 1, band 14, 15). Hence, alpha-1B-glycoprotein is considered to be the protein of interest in this band because it is the second highest in abundance (based on spectral counts) identified in this region (Table 1, band 14, 15), and its pI profile shift (Fig. 3b) is consistent with the lectin blotting result (Fig. 2c, band 14, 15). With the same selection approach, complement C3 beta chain and alpha-1-antitrypsin were identified as proteins of interest in band 13 and 17, respectively (see underlining in Table 1).
Fig. 3.
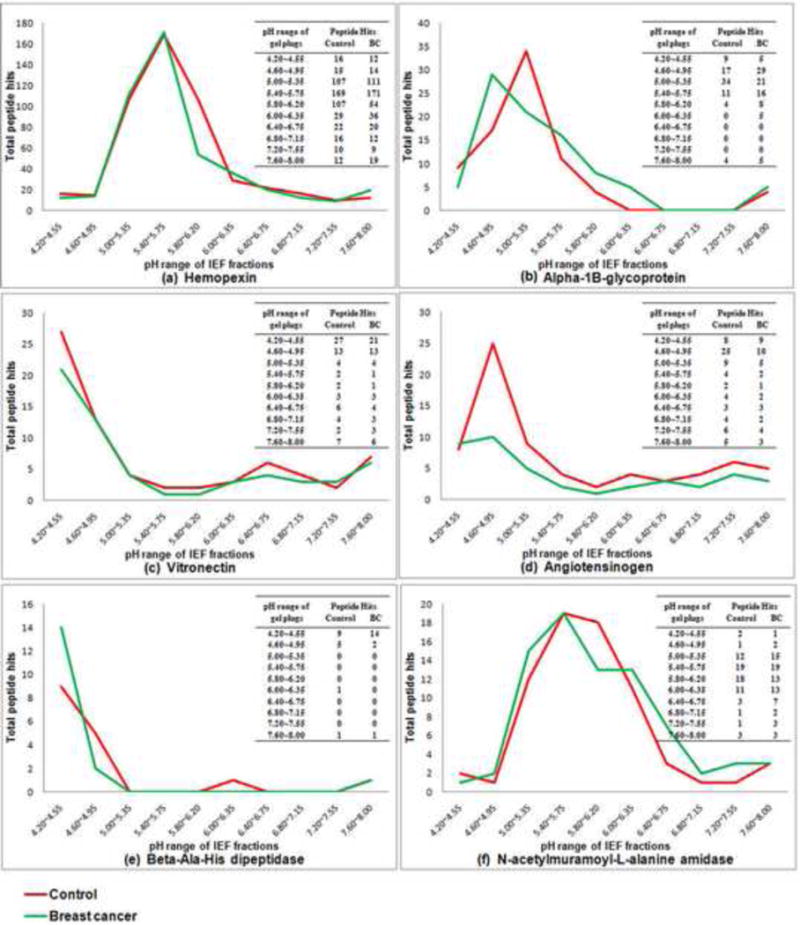
Digital ProteomeChip analysis of the M-LAC bound glycoprotein fraction showing the IEF profiles of selected glycoproteins. Proteins in Fig. 3 from (a) to (f) are ranked in order of the decreasing peptide hits in disease case (Table 1, band 14, 15). The comparison of resulting MS data between control and breast cancer was performed by Mass Spec Results Analysis Tool (MSRAT) Bioinformatics Software. (a) Hemopexin; (b) alpha-1B-glycoprotein; (c) vitronectin; (d) angiotensinogen; (e) beta-ala-his dipeptidase; (f) N-acetylmuramoyl-L-alanine amidase.
A further analysis of the IEF profiles of alpha-1B-glycoprotein, complement C3 beta chain, alpha-1-antitrypsin, and transferrin present in fractions prepared by selected depletions of control and disease serum samples are shown in Table 2. We also demonstrated that the observed pI were consistent with the corresponding literature values (see Table 2 c). For example, the reported pI of alpha-1B-glycoprotein (A1BG) (in Swiss-Prot 2D gel database) is pH 4.99~5.25; the observed/experimental pI range of the IEF fraction containing the most abundant isoform of A1BG is pH 5.00~5.35. On the other hand, the pI profiles of A1BG, CO3 beta chain and A1AT derived from breast cancer glycoproteome are recorded in the third columns of Table 2 i – iii. In case of A1BG and CO3 beta chain, the pI shifts between disease and control samples were consistent with the results of lectin blotting with SNA (Fig. 2c, band 13, 14, 15) with a shift to more acidic pI values (see arrows in Table 2). In case of band 17, there is a decrease in amount of protein, glycoprotein, and lectin staining (Fig. 2 a, b and c, respectively band 17). A decreased MS signal in the IEF analysis for alpha-1-antitrypsin was also observed in the disease case (Table 2 iii). Therefore, with A1AT, there is no clear evidence for a change in the level of sialylation based on the IEF result, but rather a decrease in the serum protein level, which is consistent with previous report of the down regulation of A1AT in breast cancer sera [33].
Table 2.
Measurement of pI profiles of selected glycoproteins from cancer (BC) and control (Con) samples, including alpha-1B-glycoprotein (A1BG), complement C3 (CO3), alpha-1-antitrypsin (A1AT), and transferrin (TRFE) with dPC.a
| pH range of gel plugs | AlBGb | CO3c | A1ATd | TRFEe | ||||
|---|---|---|---|---|---|---|---|---|
| Con | BC | Con | BC | Con | BC | Con | BC | |
| 4.20–4.55 | 9 | 5 29 
|
68 | 53 | 1 | 1 | ||
| 4.60~4.95f | 17 | g | 108 | 108 | 1 | 1 | ||
| 5.00~5.35f | 34 | 21

|
206 | 159
|
9 | 13 | ||
| 5.40–5.75 | 11 | 16 | 75 | 86 | 13 | 12 | ||
| 5.80–6.20 | 4 | 8 | 45 | 12 | 16 | 19 | ||
| 6.00–6.35 | 54 | 75
|
49 | 58 | ||||
| 6.40~6.75f | 56 | 74
|
71 | 81 | ||||
| 6.80~7.15f | 100 | 125
|
54 | 60 | ||||
| 7.20–7.55 | 79 | 79 | 32 | 37 | ||||
| 7.60–8.00 | 78 | 80 | 32 | 39 | ||||
Note:
The amount of protein in each IEF fraction was indicated by the total peptide hits in the MS analysis, which were measured after in gel digestion of the pool of 8 gel plugs within a pH range of a dPC.
Peptides specific for alpha-1B-glycoprotein observed in the dPC analysis of MARS depleted, M-LAC bound fraction.
Peptides specific for complement C3 observed in the dPC analysis of albumin and IgM, A, G depleted, M-LAC bound fraction.
Peptides specific for alpha-1-antitrypsin observed in the dPC direct analysis of MARS bound fraction.
Peptides specific for transferrin observed in the dPC analysis of albumin and IgM, A, G depleted, M-LAC bound fraction.
The reported pI range for the major glycoform derived from human plasma in Swiss-Prot 2D gel database [40]. The pI distributions of alpha-1B-glycoprotein, complement C3 beta chain, alpha-1-antitrypsin and transferrin in Swiss-Prot database are pH 4.99~5.25, pH 6.41~6.98, pH 4.87~5.10, and pH 6.14~6.64.
Up/down arrows indicate the increase/decrease of peptide hits for the disease case relative to the control sample in a given IEF fraction. In the case of transferrin, the MS measurement was performed on 10 IEF fractions in an attempt to better detect minor pI shifts.
3.4. The application of a lectin — antibody sandwich microarray to detect neutral glycan structure changes (Platform iii)
While the use of a sialic acid specific lectin (such as SNA) and a charge based separation method (such as IEF) are efficient methods to detect sialylation changes, we have investigated alternative approaches to provide information about neutral sugar changes, such as fucosylation. We report here on the use of lectin blotting and an antibody microarray to achieve this goal. Fig. 4a shows the result of 1D SDS-PAGE analysis followed by AAL blotting. A lesser extent of fucosylation in the breast cancer sample was observed for band 12, and LC/MS analysis of the corresponding band in the Coomassie blue stained gel identifies the major protein as transferrin (Table 1, band 12). The pI profile of transferrin shown in Table 2 (iv) indicates that there is no significant difference between control and disease, which is consistent with the observation of no change in lectin blotting with SNA as shown in Fig. 2c, band 12.
Fig. 4.
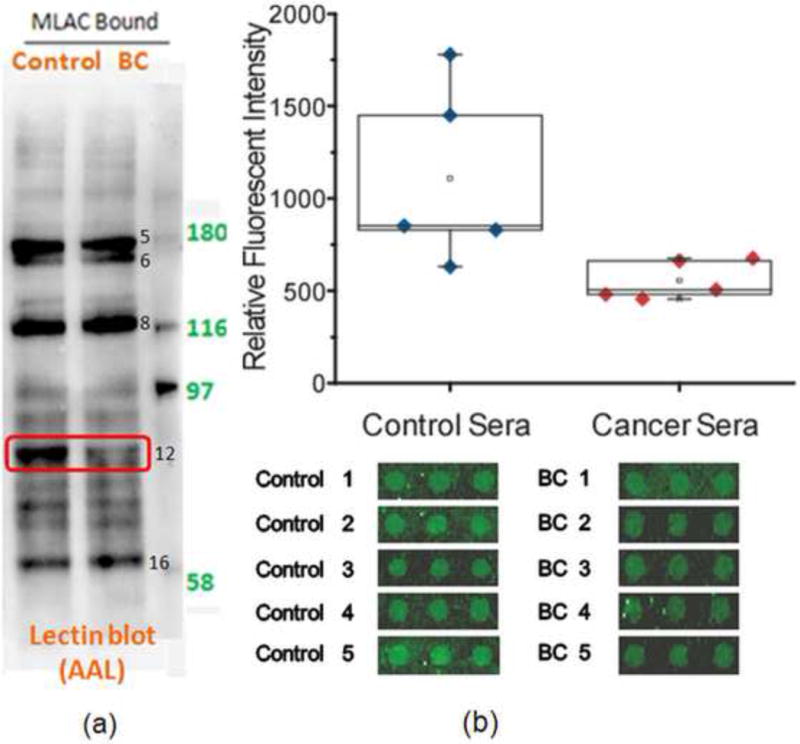
(a) Lectin blotting with AAL to detect fucosylation. (b) Antibody-lectin sandwich array analysis. Serum samples from breast cancer patients (n = 5) or control subjects (n = 5) were incubated on microscope slides spotted with anti-transferrin in triplicate. The captured proteins were probed with biotinylated AAL and streptaviding-phycoerythrin, and the slides were scanned for fluorescence. The images of the spots are shown below, and the quantification of the fluorescence from each group of samples is plotted above. The control sera showed consistently higher levels (p = 0.037) of AAL-reactive transferrin.
It has been previously shown that in an antibody-lectin sandwich microarray, the intensity of fluorescence signal due to lectin binding is proportional to the amount of captured glycoprotein. The Haab laboratory has successfully applied this technique in biomarker discovery and demonstrated excellent reproducibility between replicate array measurements [34–37]. To demonstrate the value of the antibody microarray (platform iii) to detect neutral glycan change of our M-LAC fractions, we chose transferrin as an example, and performed the study on ten individual serum samples. The targeted proteins were captured from a serum sample by specific antibodies which had been previously evaluated for minimal non specific binding. After several washes of the non-binding proteins, biotinylated AAL was applied to detect the presence of fucose in the corresponding array spots. As shown in Fig. 4b, the lower level of fucosylation of transferrin in a majority of the breast cancer cases was detected by the antibody microarray (p value = 0.037), which is consistent with the result of AAL lectin blotting (Fig. 4a). No significant differences for the transferrin signal between control and disease samples were observed with other lectin probes (RCA, BPL, ConA and SBA) (Data not shown). A key feature of this array format is a much higher through put relative to SDS-PAGE gel analysis and this facilitates the investigation of the reproducibility of glycan changes across individuals.
4. Conclusions
In this study, we have integrated 1D SDS-PAGE with the M-LAC technology to investigate changes both at the protein and glycan level in resultant glycoprotein fractions. Previous studies have shown that the M-LAC fractionation is based on glycan differences [11] and we report here that these observations are confirmed and extended by the molecular weight based separation with staining/blotting of the gel bands. The use of 1D SDS-PAGE, however, is compromised by the low resolution of the separation with the result that each band is a mixture of proteins, particularly in a complex sample such as serum. We have overcome this disadvantage by the use of LC/MS analysis to characterize gel band components, the application of IEF separation with dPC (targeting charged glycan motifs), as well as an antibody microarray (detecting neutral sugar motifs). We use this combination of 1D SDS-PAGE with orthogonal analytical platforms to detect glycoprotein/glycan changes in breast cancer serum samples and have observed changes in sialylation of complement C3 beta chain and alpha-1B-glycoprotein, a lower amount of alpha-1-antitrypsin, and a decreased level of fucosylation of transferrin in disease relative to control case. Future work will include the mass spectrometry characterization of the associated glycan structures, as well as the study of the observed glycan changes in more patient samples.
Acknowledgments
This study was supported by National Cancer Institute grant U01-CA128427. The authors thank Russell Garlick, Jim Dasch, Oren Kagan and Andrew Johnson from Protein Forest, Inc. for providing dPC, technical support and helpful discussion. We are grateful to Dr. Shiaw-Lin Wu and Dr. Tomas Rejtar for advice on this project. Thanks also to Majlinda Kullolli and Manohar Akella for technical support.
Abbreviations
- A1BG
alpha-1B-glycoprotein
- A1AT
alpha-1-antitrypsin
- AAL
Aleuria aurantia Lectin
- ANT3
antithrombin-III
- BC
breast cancer
- CO3
complement C3
- CO4A
complement C4-A
- CPAS
Computational Proteomics Analysis System
- dPC
digital ProteomeChip
- FA
formic acid
- HEMO
hemopexin
- HP-MLAC
high performance multi-lectin affinity chromatography
- IAA
iodoacetamide
- IEF
isoelectric focusing
- MARS
multiple affinity removal system
- MeCN
acetonitrile
- MS
mass spectrometry
- MSRAT
Mass Spec Results Analysis Tool
- PBST-0.1
PBS buffer containing 0.1% Tween-20
- PBST-0.5
PBS buffer containing 0.5% Tween-20
- pI
isoelectric point
- SDS-PAGE
sodium dodecyl sulfate polyacrylamide gel electrophoresis
- SNA
Sambucus Nigra Lectin
- TBST
tris-buffered saline Tween 20
- TFA
trifluoroacetic acid
- TRFE
transferrin
- Xcorr
correlation score
Footnotes
Publisher's Disclaimer: This is a PDF file of an unedited manuscript that has been accepted for publication. As a service to our customers we are providing this early version of the manuscript. The manuscript will undergo copyediting, typesetting, and review of the resulting proof before it is published in its final citable form. Please note that during the production process errors may be discovered which could affect the content, and all legal disclaimers that apply to the journal pertain.
Conflict of interest
W. S. H and M. H. disclose that they have a financial interest in current efforts by Northeastern University and PeptiFarma to license the M-LAC technology for biomarker discovery.
References
- 1.Cancer.gov. http://www.cancer.gov/cancertopics/types/breast (accessed June 20, 2008)
- 2.Nicolini A, Carpi A, Tarro G. Front Biosci. 2006;11:1818. doi: 10.2741/1926. [DOI] [PubMed] [Google Scholar]
- 3.Hondermarck H, Tastet C, El Yazidi-Belkoura I, Toillon R-A, Le Bourhis X. J Proteome Res. 2008;7:1403. doi: 10.1021/pr700870c. [DOI] [PubMed] [Google Scholar]
- 4.Bertozzi CR, Kiessling LL. Science. 2001;291:2357. doi: 10.1126/science.1059820. [DOI] [PubMed] [Google Scholar]
- 5.Dube DH, Bertozzi CR. Nat Rev Drug Discov. 2005;4:477. doi: 10.1038/nrd1751. [DOI] [PubMed] [Google Scholar]
- 6.Chen S, LaRoche T, Hamelinck D, Bergsma D, Brenner D, Simeone D, Brand RE, Haab BB. Nat Meth. 2007;4:437. doi: 10.1038/nmeth1035. [DOI] [PubMed] [Google Scholar]
- 7.Matsumoto K, Shimizu C, Arao T, Andoh M, Katsumata N, Kohno T, Yonemori K, Koizumi F, Yokote H, Aogi K, Tamura K, Nishio K, Fujiwara Y. J Proteome Res. 2009;8:457. doi: 10.1021/pr800655p. [DOI] [PubMed] [Google Scholar]
- 8.Hakomori S. Proceedings of the National Academy of Sciences of the United States of America. 2002;99:10231. doi: 10.1073/pnas.172380699. [DOI] [PMC free article] [PubMed] [Google Scholar]
- 9.Hakomori S-i. Cancer Res. 1996;56:5309. [PubMed] [Google Scholar]
- 10.Zhao J, Patwa TH, Qiu W, Shedden K, Hinderer R, Misek DE, Anderson MA, Simeone DM, Lubman DM. J Proteome Res. 2007;6:1864. doi: 10.1021/pr070062p. [DOI] [PubMed] [Google Scholar]
- 11.Yang Z, Hancock WS. J Chromatogr A. 2005;1070:57. doi: 10.1016/j.chroma.2005.02.034. [DOI] [PubMed] [Google Scholar]
- 12.Abd Hamid UM, Royle L, Saldova R, Radcliffe CM, Harvey DJ, Storr SJ, Pardo M, Antrobus R, Chapman CJ, Zitzmann N, Robertson JF, Dwek RA, Rudd PM. Glycobiology. 2008;18:1105. doi: 10.1093/glycob/cwn095. [DOI] [PubMed] [Google Scholar]
- 13.Yang Z, Hancock WS. J Chromatogr A. 2004;1053:79. [PubMed] [Google Scholar]
- 14.Wang Y, Wu S-l, Hancock WS. Glycobiology. 2006;16:514. doi: 10.1093/glycob/cwj091. [DOI] [PubMed] [Google Scholar]
- 15.Kullolli M, Hancock WS, Hincapie M. J Sep Sci. 2008;31:2733. doi: 10.1002/jssc.200800233. [DOI] [PubMed] [Google Scholar]
- 16.Turner GA, Skillen AW, Buamah P, Guthrie D, Welsh J, Harrison J, Kowalski A. J Clin Pathol. 1985;38:588. doi: 10.1136/jcp.38.5.588. [DOI] [PMC free article] [PubMed] [Google Scholar]
- 17.Shibuya N, Goldstein I, Broekaert W, Nsimba-Lubaki M, Peeters B, Peumans W. J Biol Chem. 1987;262:1596. [PubMed] [Google Scholar]
- 18.Wimmerova M, Mitchell E, Sanchez JF, Gautier C, Imberty A. J Biol Chem. 2003;278:27059. doi: 10.1074/jbc.M302642200. [DOI] [PubMed] [Google Scholar]
- 19.Rauch A, Bellew M, Eng J, Fitzgibbon M, Holzman T, Hussey P, Igra M, Maclean B, Lin CW, Detter A, Fang R, Faca V, Gafken P, Zhang H, Whitaker J, States D, Hanash S, Paulovich A, McIntosh MW. J Proteome Res. 2006;5:112. doi: 10.1021/pr0503533. [DOI] [PubMed] [Google Scholar]
- 20.Forrester S, Hung KE, Kuick R, Kucherlapati R, Haab BB. Molecular Oncology. 2007;1:216. doi: 10.1016/j.molonc.2007.06.001. [DOI] [PMC free article] [PubMed] [Google Scholar]
- 21.Yue T, Goldstein IJ, Hollingsworth MA, Kaul K, Brand RE, Haab BB. Mol Cell Proteomics. 2009 doi: 10.1074/mcp.M900135-MCP200. In Press. [DOI] [PMC free article] [PubMed] [Google Scholar]
- 22.Huang L, Harvie G, Feitelson JS, Gramatikoff K, Herold DA, Allen DL, Amunngama R, Hagler RA, Pisano MR, Zhang WW, Fang X. Proteomics. 2005;5:3314. doi: 10.1002/pmic.200401277. [DOI] [PubMed] [Google Scholar]
- 23.Zolotarjova N, Martosella J, Nicol G, Bailey J, Boyes B, Barrett W. Proteomics. 2005;5:3304. doi: 10.1002/pmic.200402021. [DOI] [PubMed] [Google Scholar]
- 24.Chromy BA, Gonzales AD, Perkins J, Choi MW, Corzett MH, Chang BC, Corzett CH, McCutchen-Maloney SL. J Proteome Res. 2004;3:1120. doi: 10.1021/pr049921p. [DOI] [PubMed] [Google Scholar]
- 25.Maccarrone G, Milfay D, Birg I, Rosenhagen M, Holsboer F, Grimm R, Bailey J, Zolotarjova N, Turck CW. Electrophoresis. 2004;25:2402. doi: 10.1002/elps.200305909. [DOI] [PubMed] [Google Scholar]
- 26.Gao M, Deng C, Yu W, Zhang Y, Yang P, Zhang X. Proteomics. 2008;8:939. doi: 10.1002/pmic.200600099. [DOI] [PubMed] [Google Scholar]
- 27.Liu T, Qian WJ, Gritsenko MA, Camp DG, Monroe ME, Moore RJ, Smith RD. J Proteome Res. 2005;4:2070. doi: 10.1021/pr0502065. [DOI] [PMC free article] [PubMed] [Google Scholar]
- 28.Whiteaker JR, Zhang H, Eng JK, Fang R, Piening BD, Feng L-C, Lorentzen TD, Schoenherr RM, Keane JF, Holzman T, Fitzgibbon M, Lin, Zhang H, Cooke K, Liu T, Camp DG, Anderson L, Watts J, Smith RD, McIntosh MW, Paulovich AG. J Proteome Res. 2007;6:828. doi: 10.1021/pr0604920. [DOI] [PubMed] [Google Scholar]
- 29.Gilbert JA, Goetz MP, Reynolds CA, Ingle JN, Giordano KF, Suman VJ, Blair HE, Jenkins RB, Lingle WL, Reinholz MM, Adjei AA, Ames MM. Mol Cancer Ther. 2008;7:944. doi: 10.1158/1535-7163.MCT-07-0570. [DOI] [PMC free article] [PubMed] [Google Scholar]
- 30.He P, He HZ, Dai J, Wang Y, Sheng QH, Zhou LP, Zhang ZS, Sun YL, Liu F, Wang K, Zhang JS, Wang HX, Song ZM, Zhang HR, Zeng R, Zhao X. Proteomics. 2005;5:3442. doi: 10.1002/pmic.200401301. [DOI] [PubMed] [Google Scholar]
- 31.Qiu Y, Patwa TH, Xu L, Shedden K, Misek DE, Tuck M, Jin G, Ruffin MT, Turgeon DK, Synal S, Bresalier R, Marcon N, Brenner DE, Lubman DM. J Proteome Res. 2008;7:1693. doi: 10.1021/pr700706s. [DOI] [PMC free article] [PubMed] [Google Scholar]
- 32.Zilberstein G, Korol L, Bukshpan S, Baskin E. Proteomics. 2004;4:2533. doi: 10.1002/pmic.200300794. [DOI] [PubMed] [Google Scholar]
- 33.El-Akawi ZJ, Sawalha DH, Nusier MK. J Health Sci. 2008;54:493. [Google Scholar]
- 34.Miller JC, Zhou H, Kwekel J, Cavallo R, Burke J, Butler EB, Teh BS, Haab BB. Proteomics. 2003;3:56. doi: 10.1002/pmic.200390009. [DOI] [PubMed] [Google Scholar]
- 35.Haab BB. Proteomics. 2003;3:2116. doi: 10.1002/pmic.200300595. [DOI] [PubMed] [Google Scholar]
- 36.Gao WM, Kuick R, Orchekowski R, Misek D, Qiu J, Greenberg A, Rom W, Brenner D, Omenn G, Haab BB, Hanash S. BMC Cancer. 2005;5:110. doi: 10.1186/1471-2407-5-110. [DOI] [PMC free article] [PubMed] [Google Scholar]
- 37.Orchekowski R, Hamelinck D, Li L, Gliwa E, VanBrocklin M, Marrero JA, Vande Woude GF, Feng Z, Brand R, Haab BB. Cancer Res. 2005;65:11193. doi: 10.1158/0008-5472.CAN-05-1436. [DOI] [PubMed] [Google Scholar]
- 38.Segrest JP, Jackson RL, Andrews EP, Marchesi VT. Biochem Biophys Res Commun. 1971;44:390. doi: 10.1016/0006-291x(71)90612-7. [DOI] [PubMed] [Google Scholar]
- 39.Marciani DJ, Papamatheakis JD. J Virol. 1978;26:825. doi: 10.1128/jvi.26.3.825-827.1978. [DOI] [PMC free article] [PubMed] [Google Scholar]
- 40.The ExPASy (Expert Protein Analysis System) proteomics server of the Swiss Institute of Bioinformatics (SIB) http://www.expasy.org (accessed June 20, 2009)