

Abstract
Cells generate mechanical stresses via the action of myosin motors on the actin cytoskeleton. Although the molecular origin of force generation is well understood, we currently lack an understanding of the regulation of force transmission at cellular length scales. Here, using 3T3 fibroblasts, we experimentally decouple the effects of substrate stiffness, focal adhesion density, and cell morphology to show that the total amount of work a cell does against the substrate to which it is adhered is regulated by the cell spread area alone. Surprisingly, the number of focal adhesions and the substrate stiffness have little effect on regulating the work done on the substrate by the cell. For a given spread area, the local curvature along the cell edge regulates the distribution and magnitude of traction stresses to maintain a constant strain energy. A physical model of the adherent cell as a contractile gel under a uniform boundary tension and mechanically coupled to an elastic substrate quantitatively captures the spatial distribution and magnitude of traction stresses. With a single choice of parameters, this model accurately predicts the cell’s mechanical output over a wide range of cell geometries.
Introduction
Cells maintain a tensional homeostasis that regulates diverse physiological processes including cell motility, differentiation, and division during development and pathogenesis (1–4). The disruption of cellular tension affects the coordination of processes such as migration (5), and has been suggested as a factor in driving malignant transformations (6). In adherent cells, tension is generated by the interactions of myosin II motors with the actin cytoskeleton (7), and transmitted via focal adhesions to the extracellular matrix (8). Although previous work has predominantly focused on the role of individual cytoskeletal and adhesion molecules in regulating traction stress (9–15), models on the scale of an entire cell are still being proposed and have not been rigorously tested (16–22). Such knowledge is essential to construct predictive models involving morphological changes at the cell and tissue levels.
The roles of cell morphology and substrate stiffness in regulating force transmission have been of particular interest. Previous studies have observed correlations between traction stress and cell spread area (23–28), changes in cell geometry (29), focal adhesions (30–32), and stress fiber assembly (33,34). Correlations have also been observed between the substrate stiffness and traction stress magnitude (6,23,27,30–32,35). These correlations have been attributed to effects of cell geometry on both RhoA activity (36,37) and stress fiber assembly (38–41). This tangled web of reported correlations in the literature arises from the inherent coupling of the suspected regulatory parameters: substrate stiffness, spread area, cell morphology, actomyosin organization, and focal adhesion assembly and morphology. The inability to isolate and test each parameter separately has made it difficult to decipher causal relationships, limiting findings to the observation of correlations. To formulate a viable model of cellular force generation, these parameters must be decoupled in a manner that allows rigorous measurement of their regulatory roles.
Methods
Cell culture
NIH 3T3 fibroblasts (American Type Culture Collection, Manassas, VA) were cultured in DMEM media (Mediatech, Herndon, VA) and supplemented with 10% FBS (HyClone; Thermo Fisher Scientific, Hampton, NH), 2 mM L-glutamine (Invitrogen, Carlsbad, CA), and penicillin-streptomycin (Invitrogen). Cells treated with blebbistatin (Sigma-Aldrich, St. Louis, MO) were incubated in media containing the indicated amount of blebbistatin for at least 30 min before imaging. Cells were transiently transfected with plasmid DNA constructs encoding for GFP-actin (from G. Borisy, Northwestern University, Evanston, IL), and Apple-paxillin and GFP-MLC (both from M. Davidson, University of Florida, Gainesville, FL) using the transfection reagent FuGENE HD (Hoffman-La Roche, Basel, Switzerland). Cells were plated on polyacrylamide gels 24 h after transfection and imaged 6–24 h later.
Polyacrylamide traction force substrates
Polyacrylamide substrates were prepared as previously described in Oakes et al. (15) and Aratyn-Schaus et al. (42). Briefly, various mixtures of acrylamide/bis-acrylamide (40,42) were used to create substrates of different stiffness. Gels were polymerized containing 40-nm fluorescent microspheres (Invitrogen) on prepared glass coverslips. Fibronectin (Millipore, Billerica, MA) was covalently crosslinked to the gel surface using sulfo-sanpah (Thermo Fisher Scientific).
Ultraviolet micropatterning
Micropatterning via deep-ultraviolet illumination was adapted from Tseng et al. (43). A chrome-plated quartz photomask (Microtronics, Newtown, PA) was cleaned with water and wiped with 0.5 mL hexane (Sigma-Aldrich). A polyacrylamide gel mixture containing 100-nm sulfate beads was polymerized for 30 min between the photomask and an activated glass coverslip. Once the gel was polymerized, the photomask was placed in a UVO-Cleaner 342 (Jelight, Irvine, CA) and illuminated with a combination of 185- and 254-nm ultraviolet light for 90 s. The coverslip and gel were then detached from the photomask by submerging the entire complex in water and gently lifting a corner of the coverslip with a tweezers. Gels were incubated in a solution containing 5 mg/mL EDC (Thermo Fisher Scientific) and 10 mg/mL NHS (Thermo Fisher Scientific) for 10 min. The EDC-NHS solution was then aspirated and replaced with a solution containing 10 μg/mL fibronectin in a buffer of HEPES (pH 8.5) for 20 min. Gels were washed 3× for 5 min in phosphate-buffered saline (PBS) before cells were plated.
Microscopy and live cell imaging
Cells were imaged on an inverted microscope (Ti-E; Nikon, Melville, NY) with a confocal scanhead (CSU-X; Yokogawa Electric, Musashino, Tokyo, Japan), laser merge module containing 491, 561, and 642 laser lines (Spectral Applied Research, Richmond Hill, Ontario, Canada), and an HQ2 charge-coupled device camera (Roper Scientific, Trenton, NJ). METAMORPH acquisition software (Molecular Devices, Eugene, OR) was used to control the microscope hardware. Images were acquired using a 60× 1.2 NA Plan Apo water-immersion objective or a 60× 1.49 NA ApoTIRF oil-immersion objective. Cells were mounted in a perfusion chamber (Warner Instruments, Hamden, CT) and maintained at 37°C. Media for live cell imaging was supplemented with 10 mM HEPES and 30 μL/mL Oxyrase (Oxyrase Inc., Mansfield, OH).
Immunofluorescence
Cells were rinsed in warm cytoskeleton buffer (10 mM MES, 3 mM MgCl2, 1.38 M KCl, and 20 mM EGTA) and then fixed and permeabilized in 4% PFA (Electron Microscopy Sciences, Hatfield, PA), 1.5% bovine serum albumin (Thermo Fisher Scientific), and 0.5% Triton X-100 in cytoskeleton buffer for 10 min at 37°C. Coverslips were then rinsed three times in PBS and incubated with phalloidin (1:1000; Invitrogen) and mouse anti-paxillin (1:400; Millipore) for 1 h at room temperature. The coverslips were then rinsed 3× in PBS and incubated with an AlexaFluor 647 donkey anti-mouse secondary antibody (1:400; Invitrogen). Fibronectin was visualized by directly labeling the protein using an AlexaFluor 568 Protein Labeling Kit (Invitrogen) or a rabbit anti-fibronectin primary antibody (1:400; Sigma-Aldrich) and Alexa Fluor 568 goat anti-rabbit secondary (1:400; Invitrogen). Coverslips were mounted on glass slides using the SlowFade Antifade kit (Invitrogen).
To determine the number of focal adhesions, cells were plated for 4–24 h, fixed, and stained for paxillin on the various micropatterns. Line-scans 20 pixels thick were drawn along the curved region of each pattern, smoothed with a running average filter, and plotted as a function of distance along the perimeter using the software MATLAB (The MathWorks, Natick, MA) (see Fig. S1 in the Supporting Material). Focal adhesions were counted as the number of peaks in the line scan >1.5 times the background fluorescence.
Traction force reconstruction
Methods for traction force reconstruction have been previously described in the literature (15,42,44). Briefly, after imaging, cells were removed from the substrate using 0.5% sodium dodecyl sulfate and a reference image of the embedded fluorescent beads was taken. Images were aligned to correct for drift, and compared with the reference image taken after the cell had been removed using particle imaging velocimetry software (http://www.oceanwave.jp/softwares/mpiv/) in the software MATLAB to produce a displacement field with a grid spacing of 1.43 μm. Displacement vectors were filtered and interpolated using the Kriging interpolation method. Traction stresses were reconstructed from the displacement field via Fourier transform traction cytometry (44,45), using zeroth-order regularization. The same regularization parameters were used for all datasets.
Average traction maps for cells on micropatterns were produced by aligning the images using the fluorescent fibronectin channel. The original displacement us and traction stress vectors T were then rotated and shifted, as determined from the fibronectin channel, and interpolated onto a uniform grid. The interpolated vector fields were then averaged across the set of images for each pattern.
Results
Here we used traction force microscopy (44,45) to measure traction stresses of NIH 3T3 fibroblasts adhered to fibronectin-coated polyacrylamide substrates (see Fig. S2, a–d). We characterized the mechanical output of the cell by calculating the strain energy (45) as
| (1) |
where us(r) represents the displacement of a point on the substrate surface and T(r) is the traction stress applied by the cell. Consistent with previous results relating traction stress and area (23–28), we observed a correlation between the cell spread area and the strain energy (see Fig. S2 e). This correlation provides a measure of the characteristic strain energy per unit area, equivalent to a surface tension. Similar trends were seen in other cell types, including MDCK epithelial and human osteosarcoma (U2OS) cells (see Fig. S2 and Fig. S3). We were able to modulate this characteristic surface tension by treating the cells with the myosin II ATPase inhibitor blebbistatin (see Fig. S2, f and g), illustrating that the surface tension originates from myosin-dependent cellular contractility. Interestingly, we did not observe any strong evidence to show that substrate stiffness impacted the surface tension (see Fig. S2 e), which suggests that substrate stiffness may not impact the cell’s mechanical output.
Motivated by these initial results, we sought to precisely determine the parameters regulating strain energy and traction stress distribution. To decouple these effects, we adapted our traction force microscopy to be used on substrates micropatterned with fibronectin (43). Controlling the cell shape enabled us to examine effects of single parameters that are often coupled (e.g., the concomitant increase in spread area and number of focal adhesions). By measuring the distribution and magnitude of traction stresses over a range of cell spread areas, geometries, and substrate stiffnesses, we were able to isolate and define the roles of spread area, local curvature, focal adhesions, and substrate stiffness in the regulation of traction stress generation.
We first created 800 μm2 patterns on substrates with shear moduli ranging from 2.8 to 30 kPa (Fig. 1). Immunofluorescence images revealed actin and focal adhesion architectures that were indistinguishable between different substrate stiffnesses (Fig. 1 a). We found that the substrate stiffness affected both the average substrate strain and the average traction stress magnitude, although in opposite ways. Cells on soft substrates exhibited large strains with small stresses, whereas cells on stiff substrates exhibited small strains and large stresses (Fig. 1, b, d, and e). When calculating the strain energy, these competing effects tended to balance, resulting in the cell performing approximately the same amount of work on each substrate (Fig. 1 f). The dependencies of strain, traction stress, and strain energy on substrate stiffness are consistent with a previously described model of the cell as a uniformly contracting sheet (46) (see the Supporting Material and Fig. S4). Thus, although substrate stiffness affected the traction stress magnitude, the amount of work performed by the cell remained effectively invariant over the range of stiffnesses probed.
Figure 1.
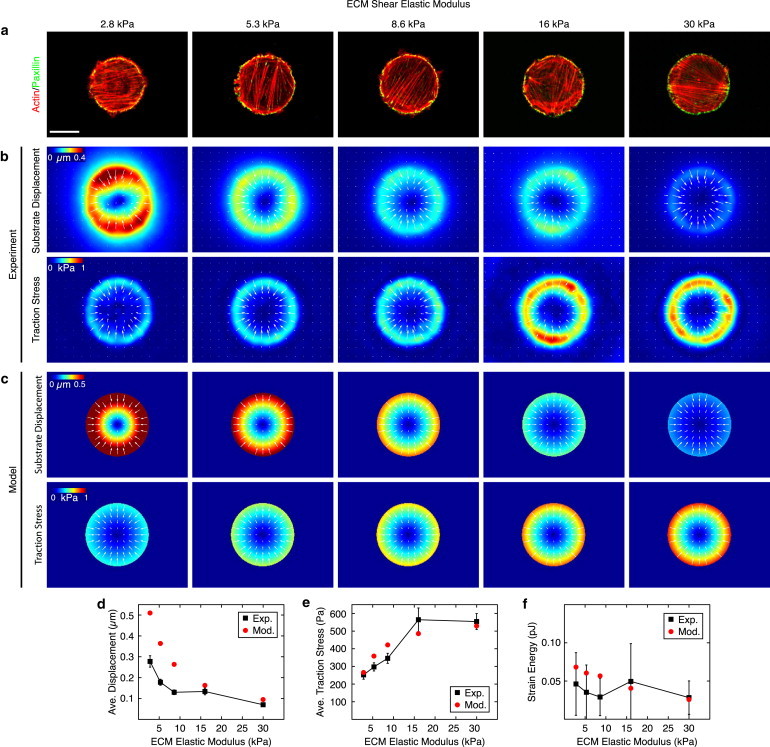
Strain energy is independent of substrate stiffness. (a) Representative immunofluorescence of fibroblasts plated on 800 μm2 patterns of fibronectin on gels of varying shear modulus. (Red) Actin; (green) focal adhesion protein paxillin. Scale bar is 15 μm. (b) Average experimental substrate displacement and traction stress maps for gels of each shear modulus. (c) Substrate displacement and traction stress maps produced using the model of a contractile gel with a uniform line tension on substrates of different stiffness. (d and e) Average substrate displacement and traction stress along the pattern edge, as measured experimentally (black squares) and predicted by the model (red circles). Error bars represent standard error of the mean with a minimum of 17 cells per point. (f) Mean strain energy as measured experimentally (black squares) and predicted by the model (red circles) as a function of substrate stiffness. Error bars represent standard deviation with a minimum of 17 cells per point. Model parameters: Ecell = 5.4 kPa, ν = 0.43, σa = 2.4 kPa, and fm = 0.7 nN/μm. To see this figure in color, go online.
We next chose a single substrate stiffness (16 kPa) and created stadium-shaped patterns that maintained a constant end curvature but increased in total area from A ≈ 700 μm2 to 2400 μm2 (Fig. 2, a–c). Immunofluorescence staining of the focal adhesion protein paxillin revealed that focal adhesions were primarily constrained to the curved regions, and that the number of focal adhesions in these regions remained constant as the total spread area increased (Fig. 2, a and d), or as the internal adhesive area was reduced (see Fig. S5). The traction stresses were also constrained to the curved regions such that the area over which stress was exerted remained constant as the cell spread area increased. Despite a fixed number of focal adhesions, the maximum stress within these regions increased with spread area, resulting in greater strain energy of the cell (Fig. 2, e and f). As a result, the cell’s mechanical output was proportional to spread area even when there were no changes in the number of focal adhesions (Fig. 2, f and g). Focal adhesion density, therefore, did not regulate the magnitude of traction stresses or the work done by the cell.
Figure 2.
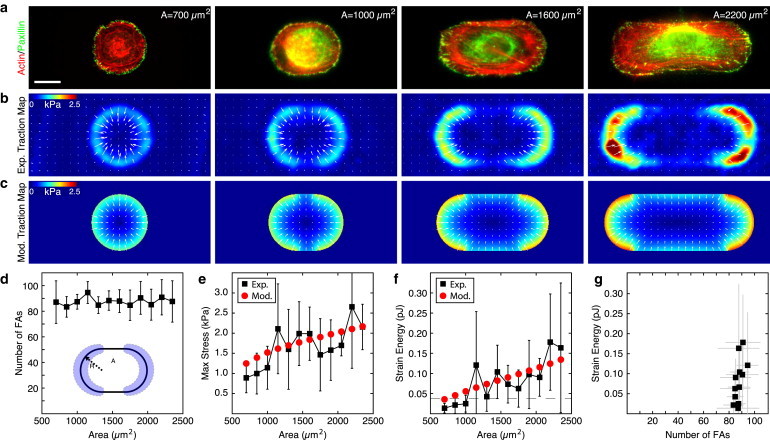
Strain energy scales with cell size independent of number of focal adhesions. (a) Immunofluorescence images of actin (red) and the focal adhesion protein paxillin (green) in fibroblasts plated on micropatterns that increase with area and maintain a constant radius of curvature at the ends. Scale bar is 20 μm. (b) Average experimental traction force maps (n > 4 for each image). (c) Traction maps produced using the model of a contractile gel with a uniform line tension. (d) Number of focal adhesions in the regions of curvature of the pattern. Error bars represent standard deviation with a minimum of three cells per point. (Inset) Schematic indicating the radius of curvature, R, and area, A of the pattern. (Shaded) Regions used to calculate the number of focal adhesions. (e and f) Mean maximum stress and mean strain energy plotted as a function of pattern area. (Black squares) Experimental results. Error bars represent standard deviation with a minimum of four cells per point. (Red circles) Model results. Model parameters: Ecell = 5.4 kPa, ν = 0.43, σa = 2.4 kPa, and fm = 0.7 nN/μm. (Dashed line) Mean strain energy for 800 μm2 circles of different stiffness (from Fig. 1f). (g) Strain energy plotted as a function of the number of focal adhesions bearing the load. To see this figure in color, go online.
To explore the consequences of cell geometry we created a series of stadium-shaped patterns that held the spread area constant, while changing the end radius of curvature from R = 22.5 to 7.5 μm (Fig. 3 a). Similar to previous patterns, the focal adhesions and traction stresses were again constrained to the curved regions (Fig. 3 b). Changes to the radius of curvature did not affect the focal adhesion density, and thus the number of focal adhesions and area over which traction stress was exerted varied proportionally with R (Fig. 3, b and f). The maximum stress exerted by the cell increased with increased aspect ratio (Fig. 3, b and d), such that the strain energy of the cells remained constant across all patterns (Fig. 3, e and f). Thus, cells with identical spread area generated the same mechanical output, and this value was independent of aspect ratio and total number of focal adhesions (Fig. 3, e and f). For a given spread area, the local curvature of the cell regulated the spatial distribution and local magnitude of the traction stress applied to the substrate.
Figure 3.
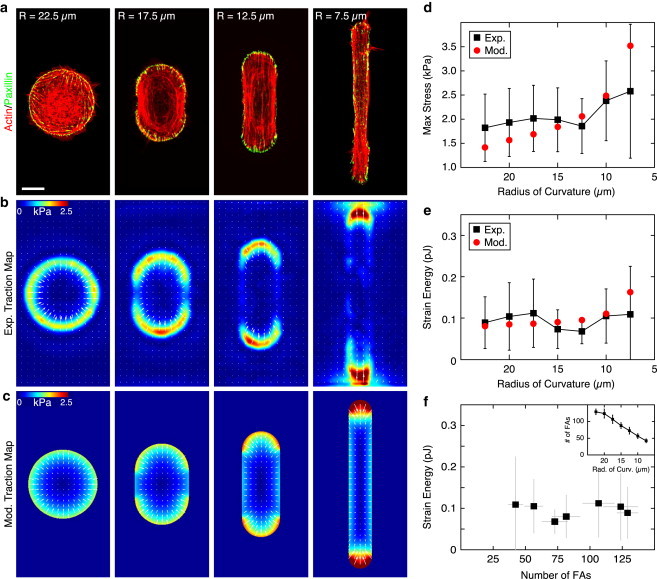
Local curvature regulates the distribution of traction stress for a constant area. (a) Immunofluorescence images of actin (red) and the focal adhesion protein paxillin (green) in fibroblasts plated on micropatterns of a constant area (1600 μm2) and changing radius of curvature. Scale bar is 15 μm. (b) Average experimental traction-force maps (n > 7 for each image). (c) Traction maps produced using the model of a contractile gel with a uniform line tension. (d and e) Mean maximum stress and mean strain energy plotted as a function of pattern area. (Black squares) Experimental results. Error bars represent standard deviation with a minimum of seven cells per point. (Red circles) Model results. Model parameters: Ecell = 5.4 kPa, ν = 0.43, σa = 2.4 kPa, and fm = 0.7 nN/μm. (f) The strain energy plotted as a function of the number of focal adhesions bearing the load. (Inset) Number of focal adhesions bearing the load plotted as a function of the radius of curvature of the pattern. Error bars represent standard deviation with a minimum of three cells per point. To see this figure in color, go online.
Our measurements on cells with well-controlled geometry yielded robust trends in the spatial distribution and magnitude of traction stresses. To elucidate the physics underlying these observations, we explored a model of the cell as a thin elastic film subject to a homogeneous contractile pressure, and anchored uniformly to the substrate via linear springs (19,20). We considered the stationary state of a fully spread adherent cell of average height h, much smaller than its in-plane dimensions, and neglected any out-of-plane deformations. We focused on the contractile elastic response of the cell to the adhesion pattern and assumed that the underlying cytoskeleton behaved as an elastic gel on short timescales. The cellular material was thus modeled as a homogeneous and isotropic elastic medium characterized by a Young’s modulus Ecell and Poisson ratio ν, and subject to myosin-induced contractile stresses. In mechanical equilibrium, the total energy of the cell is given by the sum of elastic and adhesion energies as
| (2) |
where σij is the stress tensor of the cell, u is the elastic displacement field, and uij = (∂iuj + ∂jui)/2 is the symmetrized strain tensor. The stress tensor σij can be decomposed in two parts—σij = σijel + σaδij, where σijel represents the elastic contribution to the internal cellular stress; and σa < 0, which is a homogeneous contractile pressure stemming from active processes in the bulk. The constitutive relation for the elastic stress tensor σijel follows from the linear elasticity of an isotropic and homogeneous medium (47), as
The second term in Eq. 2 describes the energy due to adhesion to the substrate, where Y denotes the substrate rigidity parameter that is proportional to the substrate stiffness and the strength of focal adhesions (46). The elastic reference state, u ≡ 0, is thus given by the limit of rigid anchoring to the substrate.
A model with uniform contractility alone, however, results in traction stresses being smeared along the entire cell contour, and hence cannot account for the pronounced concentration of traction stresses at regions of nonzero boundary curvature (see Fig. S6 and Fig. 4, d and e). In addition, such a model does not reproduce the increase in traction stresses with the increase in local curvature (see Fig. S6 and Fig. 3, b and d). These observations motivated us to introduce a uniform positive line tension (energy/length), λ, acting along the cell boundary, and describing the tendency of the cell to minimize its contact perimeter with the substrate. This line tension contributes a local force (per unit length) on the boundary, −λκn, where κ is the curvature and n is the outward unit normal at the cell boundary. Thus, on boundaries of positive curvature, the line tension generates an inward contractile force, whereas no force is generated on flat boundaries. Finally, our data indicated that the maximum traction stress increased with spread area even when the local curvature was held constant (Fig. 2, b and e). To account for this finding, we introduced a feedback between the line tension λ and the geometry, namely that λ scales with the cell perimeter, P: λ = fmP0, where fm is a contractile force per unit length acting across the cell boundary. Thus, we modify our original equilibrium energy equation to read
| (3) |
where the third term describes the line energy due to edge contractility, depending on the square of the cell’s perimeter P.
Figure 4.
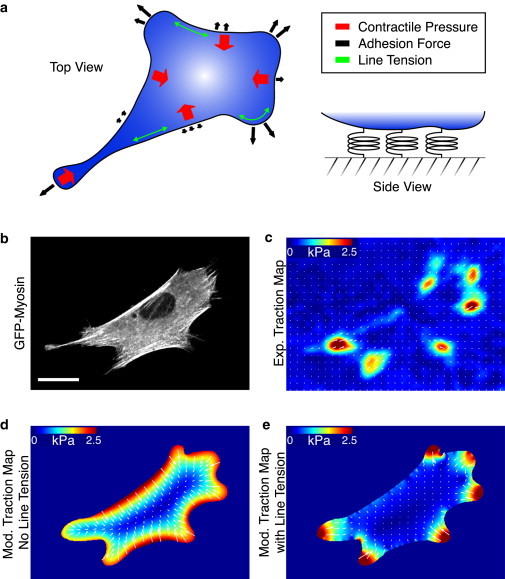
Model of unconstrained fibroblasts. (a) A force-balance diagram illustrating the components in the model, including an isotropic contractile pressure throughout the cell, uniform line tension along the periphery, and the adhesion force dependent on local boundary curvature. (b) A cell expressing GFP-myosin on an 8-kPa polyacrylamide substrate uniformly coated with fibronectin. Scale bar is 20 μm. (c) Experimental traction map for the cell in panel b. (d) The traction map produced by a model of a uniformly contracting gel without including a line tension, σa = 7 kPa and fm = 0. (e) The traction map produced from the model of the cell as a contractile gel with a uniform line tension, σa = 2.4 kPa and fm = 0.7 nN/μm. Other model parameters: Ecell = 5.4 kPa and ν = 0.43. To see this figure in color, go online.
We then minimized the total energy in Eq. 3 and solved the resultant force-balance equations numerically (Fig. 4 a; and see the Supporting Material). The best fit parameters were found to be Ecell = 5.4 kPa for the cellular Young’s modulus, σa = 2.4 kPa for the bulk contractility, and fm = 0.7 nN/μm for the line tension (Fig. 1, c–f; Fig. 2, c, e, and f; and Fig. 3, c–e). With these parameter values held constant, the contractile gel model accurately captures the magnitude and spatial distribution of traction stresses for experiments for constant A with varying ECM stiffness (Fig. 1 c), with constant R and varying A (Fig. 2 c), and with constant A and varying R (Fig. 3 c). The model also accurately predicts the magnitude and trends for both the maximum stress and the strain energy (Fig. 1, e and f; Fig. 2, e and f; and Fig. 3, e and e). Thus, with a single choice of parameters, the model quantitatively captures the experimental results over a large range of conditions.
Finally, we sought to determine whether this model could also apply to cells with more complex geometries, such as a cell adhered to a uniformly coated substrate (Fig. 4, a–e). A cell expressing GFP-myosin was plated on an 8-kPa uniformly-coated polyacrylamide gel and the traction stresses were measured (Fig. 4, b and c). A smoothed cell outline was generated from the GFP image, and using the values of σa and fm determined above, the model was used to reconstruct a traction map with the contour as the only input parameter. In the absence of the line tension term (i.e., fm = 0), the model results in a smoothing out of the traction forces along the entire perimeter of the cell (Fig. 4 d). When the line tension is included, it acts to minimize the cell perimeter, and forces are localized to regions of higher curvature (Fig. 4 e). Although there are minor discrepancies with the direction of some stresses produced locally by the model, because stresses always point normal to the boundary, the model reflects the contractile behavior on the scale of the whole cell. This discrepancy can result, in part, from assuming uniform adhesion along the edge; however, some cell edges are not adhered to the substrate (18). Therefore, we can successfully reproduce a traction map that accurately captures the distribution and magnitudes of traction stresses in unconstrained geometries using the cell shape as the sole input into the model.
Discussion
By combining micropatterning with traction force microscopy, we were able to decouple and rigorously probe parameters suspected of regulating cellular force generation. Surprisingly, we found that substrate stiffness, the number of focal adhesions, and the cell geometry did not regulate the work, as defined by the strain energy, and performed by the cell on the extracellular matrix. Instead, we found that the mechanical output of the cell was regulated by spread area alone, with local curvature regulating the distribution of traction stresses on the substrate. Using a simple model of the cell as a contractile sheet under a uniform boundary tension, we found that with a single choice of two parameters, the model could successfully predict the magnitudes and distributions of traction stresses in cells over the wide variety of geometries, spread areas, and substrate stiffnesses studied. We were able to distill the complex interactions governing cellular force generation down to two parameters related to cellular morphology: a global contractile pressure (σa = 2.4 kPa), and a uniform line tension (fm = 0.7 nN/μm). This simple approach highlights the physical mechanisms regulating contractility while retaining predictive power.
That we found strain energy to be independent of substrate stiffness and focal adhesion number was unexpected, given previous data (6,23,27,30–32,35). It illustrates the importance of parsing the effects of coupled pathways in complex systems and the need to standardize parameterization of cellular force generation. Changes in cellular geometry coincident with changes in traction stress affect a number of different parameters simultaneously (e.g., spread area, local curvature, actin organization, focal adhesion density, and area). Although an increase in spread area does result in an increased number of focal adhesions (30–32), our results demonstrate that focal adhesion number is only coincidental with an increase in strain energy in unconfined geometries; it does not affect the mechanical output of the cell. In conjunction with our previous works illustrating the poor correlation between focal adhesion morphology and traction stress (15,48,49), we can conclude that focal adhesions are not regulating the mechanical work done by the whole cell. Similarly, while substrate stiffness may affect a cell’s spread area (6,23,27,30,31,33–35,40), cells of the same area do a constant amount of work on their environment, independent of substrate stiffness. Stiffer substrates do result in an increase in traction stress magnitude (6,23,27,30–32,35), eventually plateauing on the stiffest substrates, but are accompanied by a decrease in strain, resulting in an essentially constant mechanical output. These nuanced relationships and parameterizations only become apparent when isolated from their coincidental effects.
Perhaps more surprisingly, the model is successful without the introduction of any explicit parameters describing the organization of the actin cytoskeleton into bundles or stress fibers. Although we also saw evidence of increased bundling with increased spread area (Fig. 2) (38–40), we found no direct link to the cell’s mechanical output. This is consistent with our previous work demonstrating that cells can exert significant traction stresses in the absence of large actin stress fibers (50). It is possible that bundling actin into stress fibers serves other purposes, such as locally regulating the direction of applied stresses. In such a role, potential molecular regulatory mechanisms of the line tension could include proteins that facilitate cytoskeletal organization such as formins and α-actinin. Future work will target knockdowns of these proteins to determine their affect on both the line tension and distribution of traction stresses.
Our mechanical model is remarkably successful despite the assumption of uniform adhesion with the substrate. Previous works have suggested that adhesion geometry could have an effect on cell shape and the distribution of stresses on the substrate (18,51,52), and our future work will aim to incorporate this aspect into the model. This simple predictive model based solely on geometry, however, is a significant first step in developing physical models of morphological behaviors on the cellular scale. It also clarifies the regulatory roles of numerous simultaneously acting parameterizations of cellular force generation. In the future, it will be interesting to test this model against not only other cell types, but also multicellular length scales (53,54). In the meantime, these data provide fundamental insights into the physical mechanisms regulating force generation on the cellular scale.
Acknowledgments
We thank Venkat Maruthamuthu for supplying the MDCK data and Ulrich Schwarz for helpful discussions.
S.B. was supported by National Science Foundation award No. DMR-1004789. M.C.M. was supported by National Science Foundation awards No. DMR-1004789 and No. DGE-1068780 and by the Simons Foundation. M.L.G. was supported by a Burroughs Wellcome Career Award, a Lucile Packard Fellowship, an American Asthma Early Excellence Award, and the University of Chicago Materials Research Science and Engineering Center.
Supporting Material
References
- 1.Lecuit T., Lenne P.-F. Cell surface mechanics and the control of cell shape, tissue patterns and morphogenesis. Nat. Rev. Mol. Cell Biol. 2007;8:633–644. doi: 10.1038/nrm2222. [DOI] [PubMed] [Google Scholar]
- 2.Parsons J.T., Horwitz A.R., Schwartz M.A. Cell adhesion: integrating cytoskeletal dynamics and cellular tension. Nat. Rev. Mol. Cell Biol. 2010;11:633–643. doi: 10.1038/nrm2957. [DOI] [PMC free article] [PubMed] [Google Scholar]
- 3.DuFort C.C., Paszek M.J., Weaver V.M. Balancing forces: architectural control of mechanotransduction. Nat. Rev. Mol. Cell Biol. 2011;12:308–319. doi: 10.1038/nrm3112. [DOI] [PMC free article] [PubMed] [Google Scholar]
- 4.Hoffman B.D., Grashoff C., Schwartz M.A. Dynamic molecular processes mediate cellular mechanotransduction. Nature. 2011;475:316–323. doi: 10.1038/nature10316. [DOI] [PMC free article] [PubMed] [Google Scholar]
- 5.Gupton S.L., Waterman-Storer C.M. Spatiotemporal feedback between actomyosin and focal-adhesion systems optimizes rapid cell migration. Cell. 2006;125:1361–1374. doi: 10.1016/j.cell.2006.05.029. [DOI] [PubMed] [Google Scholar]
- 6.Paszek M.J., Zahir N., Weaver V.M. Tensional homeostasis and the malignant phenotype. Cancer Cell. 2005;8:241–254. doi: 10.1016/j.ccr.2005.08.010. [DOI] [PubMed] [Google Scholar]
- 7.Schwarz U.S., Gardel M.L. United we stand: integrating the actin cytoskeleton and cell-matrix adhesions in cellular mechanotransduction. J. Cell Sci. 2012;125:3051–3060. doi: 10.1242/jcs.093716. [DOI] [PMC free article] [PubMed] [Google Scholar]
- 8.Geiger B., Yamada K.M. Molecular architecture and function of matrix adhesions. Cold Spring Harb. Perspect. Biol. 2011 doi: 10.1101/cshperspect.a005033. [DOI] [PMC free article] [PubMed] [Google Scholar]
- 9.Balaban N.Q., Schwarz U.S., Geiger B. Force and focal adhesion assembly: a close relationship studied using elastic micropatterned substrates. Nat. Cell Biol. 2001;3:466–472. doi: 10.1038/35074532. [DOI] [PubMed] [Google Scholar]
- 10.Wang N., Tolić-Nørrelykke I.M., Stamenović D. Cell prestress. I. Stiffness and prestress are closely associated in adherent contractile cells. Am. J. Physiol. Cell Physiol. 2002;282:C606–C616. doi: 10.1152/ajpcell.00269.2001. [DOI] [PubMed] [Google Scholar]
- 11.Beningo K.A., Hamao K., Hosoya H. Traction forces of fibroblasts are regulated by the Rho-dependent kinase but not by the myosin light chain kinase. Arch. Biochem. Biophys. 2006;456:224–231. doi: 10.1016/j.abb.2006.09.025. [DOI] [PMC free article] [PubMed] [Google Scholar]
- 12.Bhadriraju K., Yang M., Chen C.S. Activation of ROCK by RhoA is regulated by cell adhesion, shape, and cytoskeletal tension. Exp. Cell Res. 2007;313:3616–3623. doi: 10.1016/j.yexcr.2007.07.002. [DOI] [PMC free article] [PubMed] [Google Scholar]
- 13.Lynch C.D., Gauthier N.C., Sheetz M.P. Filamin depletion blocks endoplasmic spreading and destabilizes force-bearing adhesions. Mol. Biol. Cell. 2011;22:1263–1273. doi: 10.1091/mbc.E10-08-0661. [DOI] [PMC free article] [PubMed] [Google Scholar]
- 14.Cai Y., Rossier O., Sheetz M.P. Cytoskeletal coherence requires myosin-IIA contractility. J. Cell Sci. 2010;123:413–423. doi: 10.1242/jcs.058297. [DOI] [PMC free article] [PubMed] [Google Scholar]
- 15.Oakes P.W., Beckham Y., Gardel M.L. Tension is required but not sufficient for focal adhesion maturation without a stress fiber template. J. Cell Biol. 2012;196:363–374. doi: 10.1083/jcb.201107042. [DOI] [PMC free article] [PubMed] [Google Scholar]
- 16.Paul R., Heil P., Schwarz U.S. Propagation of mechanical stress through the actin cytoskeleton toward focal adhesions: model and experiment. Biophys. J. 2008;94:1470–1482. doi: 10.1529/biophysj.107.108688. [DOI] [PMC free article] [PubMed] [Google Scholar]
- 17.Deshpande V.S., McMeeking R.M., Evans A.G. A bio-chemo-mechanical model for cell contractility. Proc. Natl. Acad. Sci. USA. 2006;103:14015–14020. doi: 10.1073/pnas.0605837103. [DOI] [PMC free article] [PubMed] [Google Scholar]
- 18.Bischofs I.B., Schmidt S.S., Schwarz U.S. Effect of adhesion geometry and rigidity on cellular force distributions. Phys. Rev. Lett. 2009;103:048101. doi: 10.1103/PhysRevLett.103.048101. [DOI] [PubMed] [Google Scholar]
- 19.Banerjee S., Marchetti M.C. Substrate rigidity deforms and polarizes active gels. Europhys. Lett. 2011;96:28003. [Google Scholar]
- 20.Edwards C.M., Schwarz U.S. Force localization in contracting cell layers. Phys. Rev. Lett. 2011;107:128101. doi: 10.1103/PhysRevLett.107.128101. [DOI] [PubMed] [Google Scholar]
- 21.Farsad M., Vernerey F.J. An XFEM-based numerical strategy to model mechanical interactions between biological cells and a deformable substrate. Int. J. Numer. Methods Eng. 2012;92:238–267. [Google Scholar]
- 22.Guthardt Torres P., Bischofs I.B., Schwarz U.S. Contractile network models for adherent cells. Phys. Rev. E Stat. Nonlin. Soft Matter Phys. 2012;85:011913. doi: 10.1103/PhysRevE.85.011913. [DOI] [PubMed] [Google Scholar]
- 23.Lo C.-M., Wang H.-B., Wang Y.L. Cell movement is guided by the rigidity of the substrate. Biophys. J. 2000;79:144–152. doi: 10.1016/S0006-3495(00)76279-5. [DOI] [PMC free article] [PubMed] [Google Scholar]
- 24.Wang N., Ostuni E., Ingber D.E. Micropatterning tractional forces in living cells. Cell Motil. Cytoskeleton. 2002;52:97–106. doi: 10.1002/cm.10037. [DOI] [PubMed] [Google Scholar]
- 25.Reinhart-King C.A., Dembo M., Hammer D.A. Endothelial cell traction forces on RGD-derivatized polyacrylamide substrata. Langmuir. 2003;19:1573–1579. [Google Scholar]
- 26.Reinhart-King C.A., Dembo M., Hammer D.A. The dynamics and mechanics of endothelial cell spreading. Biophys. J. 2005;89:676–689. doi: 10.1529/biophysj.104.054320. [DOI] [PMC free article] [PubMed] [Google Scholar]
- 27.Califano J.P., Reinhart-King C.A. Substrate stiffness and cell area predict cellular traction stresses in single cells and cells in contact. Cell Mol. Bioeng. 2010;3:68–75. doi: 10.1007/s12195-010-0102-6. [DOI] [PMC free article] [PubMed] [Google Scholar]
- 28.Mertz A.F., Banerjee S., Dufresne E.R. Scaling of traction forces with the size of cohesive cell colonies. Phys. Rev. Lett. 2012;108:198101. doi: 10.1103/PhysRevLett.108.198101. [DOI] [PMC free article] [PubMed] [Google Scholar]
- 29.Rape A.D., Guo W.H., Wang Y.L. The regulation of traction force in relation to cell shape and focal adhesions. Biomaterials. 2011;32:2043–2051. doi: 10.1016/j.biomaterials.2010.11.044. [DOI] [PMC free article] [PubMed] [Google Scholar]
- 30.Fu J., Wang Y.-K., Chen C.S. Mechanical regulation of cell function with geometrically modulated elastomeric substrates. Nat. Methods. 2010;7:733–736. doi: 10.1038/nmeth.1487. [DOI] [PMC free article] [PubMed] [Google Scholar]
- 31.Weng S., Fu J. Synergistic regulation of cell function by matrix rigidity and adhesive pattern. Biomaterials. 2011;32:9584–9593. doi: 10.1016/j.biomaterials.2011.09.006. [DOI] [PMC free article] [PubMed] [Google Scholar]
- 32.Han S.J., Bielawski K.S., Sniadecki N.J. Decoupling substrate stiffness, spread area, and micropost density: a close spatial relationship between traction forces and focal adhesions. Biophys. J. 2012;103:640–648. doi: 10.1016/j.bpj.2012.07.023. [DOI] [PMC free article] [PubMed] [Google Scholar]
- 33.Solon J., Levental I., Janmey P.A. Fibroblast adaptation and stiffness matching to soft elastic substrates. Biophys. J. 2007;93:4453–4461. doi: 10.1529/biophysj.106.101386. [DOI] [PMC free article] [PubMed] [Google Scholar]
- 34.Tee S.-Y., Fu J., Janmey P.A. Cell shape and substrate rigidity both regulate cell stiffness. Biophys. J. 2011;100:L25–L27. doi: 10.1016/j.bpj.2010.12.3744. [DOI] [PMC free article] [PubMed] [Google Scholar]
- 35.Ghibaudo M., Saez A., Ladoux B. Traction forces and rigidity sensing regulate cell functions. Soft Matter. 2008;4:1836–1843. [Google Scholar]
- 36.McBeath R., Pirone D.M., Chen C.S. Cell shape, cytoskeletal tension, and RhoA regulate stem cell lineage commitment. Dev. Cell. 2004;6:483–495. doi: 10.1016/s1534-5807(04)00075-9. [DOI] [PubMed] [Google Scholar]
- 37.Kilian K.A., Bugarija B., Mrksich M. Geometric cues for directing the differentiation of mesenchymal stem cells. Proc. Natl. Acad. Sci. USA. 2010;107:4872–4877. doi: 10.1073/pnas.0903269107. [DOI] [PMC free article] [PubMed] [Google Scholar]
- 38.Parker K.K., Brock A.L., Ingber D.E. Directional control of lamellipodia extension by constraining cell shape and orienting cell tractional forces. FASEB J. 2002;16:1195–1204. doi: 10.1096/fj.02-0038com. [DOI] [PubMed] [Google Scholar]
- 39.Théry M., Racine V., Bornens M. Anisotropy of cell adhesive microenvironment governs cell internal organization and orientation of polarity. Proc. Natl. Acad. Sci. USA. 2006;103:19771–19776. doi: 10.1073/pnas.0609267103. [DOI] [PMC free article] [PubMed] [Google Scholar]
- 40.Yeung T., Georges P.C., Janmey P.A. Effects of substrate stiffness on cell morphology, cytoskeletal structure, and adhesion. Cell Motil. Cytoskeleton. 2005;60:24–34. doi: 10.1002/cm.20041. [DOI] [PubMed] [Google Scholar]
- 41.Roca-Cusachs P., Alcaraz J., Navajas D. Micropatterning of single endothelial cell shape reveals a tight coupling between nuclear volume in G1 and proliferation. Biophys. J. 2008;94:4984–4995. doi: 10.1529/biophysj.107.116863. [DOI] [PMC free article] [PubMed] [Google Scholar]
- 42.Aratyn-Schaus Y., Oakes P.W., Gardel M.L. Preparation of complaint matrices for quantifying cellular contraction. J. Vis. Exp. 2010 doi: 10.3791/2173. [DOI] [PMC free article] [PubMed] [Google Scholar]
- 43.Tseng Q., Wang I., Balland M. A new micropatterning method of soft substrates reveals that different tumorigenic signals can promote or reduce cell contraction levels. Lab Chip. 2011;11:2231–2240. doi: 10.1039/c0lc00641f. [DOI] [PubMed] [Google Scholar]
- 44.Sabass B., Gardel M.L., Schwarz U.S. High resolution traction force microscopy based on experimental and computational advances. Biophys. J. 2008;94:207–220. doi: 10.1529/biophysj.107.113670. [DOI] [PMC free article] [PubMed] [Google Scholar]
- 45.Butler J.P., Tolić-Nørrelykke I.M., Fredberg J.J. Traction fields, moments, and strain energy that cells exert on their surroundings. Am. J. Physiol. Cell Physiol. 2002;282:C595–C605. doi: 10.1152/ajpcell.00270.2001. [DOI] [PubMed] [Google Scholar]
- 46.Banerjee S., Marchetti M.C. Contractile stresses in cohesive cell layers on finite-thickness substrates. Phys. Rev. Lett. 2012;109:108101. doi: 10.1103/PhysRevLett.109.108101. [DOI] [PubMed] [Google Scholar]
- 47.Landau L., Lifshitz E. Course of Theoretical Physics. 3rd Ed. Elsevier; New York: 1986. Theory of Elasticity, Vol. 7. [Google Scholar]
- 48.Stricker J., Aratyn-Schaus Y., Gardel M.L. Spatiotemporal constraints on the force-dependent growth of focal adhesions. Biophys. J. 2011;100:2883–2893. doi: 10.1016/j.bpj.2011.05.023. [DOI] [PMC free article] [PubMed] [Google Scholar]
- 49.Stricker J., Beckham Y., Gardel M.L. Myosin II-mediated focal adhesion maturation is tension insensitive. PLoS ONE. 2013;8:e70652. doi: 10.1371/journal.pone.0070652. [DOI] [PMC free article] [PubMed] [Google Scholar]
- 50.Aratyn-Schaus Y., Oakes P.W., Gardel M.L. Dynamic and structural signatures of lamellar actomyosin force generation. Mol. Biol. Cell. 2011;22:1330–1339. doi: 10.1091/mbc.E10-11-0891. [DOI] [PMC free article] [PubMed] [Google Scholar]
- 51.Banerjee S., Marchetti M.C. Controlling cell-matrix traction forces by extracellular geometry. New J. Phys. 2013;15:035015. [Google Scholar]
- 52.Banerjee S., Sknepnek R., Marchetti M.C. Optimal shapes and stresses of adherent cells on patterned substrates. Soft Matter. 2014;10:2424–2430. doi: 10.1039/c3sm52647j. [DOI] [PubMed] [Google Scholar]
- 53.Boghaert E., Gleghorn J.P., Nelson C.M. Host epithelial geometry regulates breast cancer cell invasiveness. Proc. Natl. Acad. Sci. USA. 2012;109:19632–19637. doi: 10.1073/pnas.1118872109. [DOI] [PMC free article] [PubMed] [Google Scholar]
- 54.Gjorevski N., Nelson C.M. Mapping of mechanical strains and stresses around quiescent engineered three-dimensional epithelial tissues. Biophys. J. 2012;103:152–162. doi: 10.1016/j.bpj.2012.05.048. [DOI] [PMC free article] [PubMed] [Google Scholar]
Associated Data
This section collects any data citations, data availability statements, or supplementary materials included in this article.