

Abstract
Single-molecule tracking has become a widely used technique for studying protein dynamics and their organization in the complex environment of the cell. In particular, the spatiotemporal distribution of membrane receptors is an active field of study due to its putative role in the regulation of signal transduction. The SNAP-tag is an intrinsically monovalent and highly specific genetic tag for attaching a fluorescent label to a protein of interest. Little information is currently available on the choice of optimal fluorescent dyes for single-molecule microscopy utilizing the SNAP-tag labeling system. We surveyed 6 green and 16 red excitable dyes for their suitability in single-molecule microscopy of SNAP-tag fusion proteins in live cells. We determined the nonspecific binding levels and photostability of these dye conjugates when bound to a SNAP-tag fused membrane protein in live cells. We found that only a limited subset of the dyes tested is suitable for single-molecule tracking microscopy. The results show that a careful choice of the dye to conjugate to the SNAP-substrate to label SNAP-tag fusion proteins is very important, as many dyes suffer from either rapid photobleaching or high nonspecific staining. These characteristics appear to be unpredictable, which motivated the need to perform the systematic survey presented here. We have developed a protocol for evaluating the best dyes, and for the conditions that we evaluated, we find that Dy 549 and CF 640 are the best choices tested for single-molecule tracking. Using an optimal dye pair, we also demonstrate the possibility of dual-color single-molecule imaging of SNAP-tag fusion proteins. This survey provides an overview of the photophysical and imaging properties of a range of SNAP-tag fluorescent substrates, enabling the selection of optimal dyes and conditions for single-molecule imaging of SNAP-tagged fusion proteins in eukaryotic cell lines.
Introduction
Single-molecule fluorescence microscopy has emerged in recent years as a powerful tool to investigate the structural dynamics and biological functions of proteins and macromolecular protein complexes (1–5). Single-molecule fluorescence approaches can reveal the dynamic interactions of individual proteins and heterogeneity in the spatial distribution of proteins that are difficult to detect using other fluorescence microscopy approaches (6–8). Despite the extraordinary advances in single-molecule fluorescence achieved to date, there remain many technical challenges that must be overcome to systematically study proteins in their native, highly complex, cellular environment. One of the challenges involves the specific and monovalent labeling of proteins of interest with a photostable fluorescent probe. In the last decade, several technologies have been developed that permit proteins to be specifically tagged with organic dyes in live cells (2,3,9–11). In this article, we focus on the fluorescent labeling of proteins for single-molecule tracking.
Single-molecule fluorescence microscopy allows the tracking of proteins in a living cell at high resolution for a short period of time (12–15). The trajectories obtained contain valuable spatiotemporal information on interactions of proteins with their microenvironment (16–18). For instance, a protein may interact with other molecules, resulting in transient slowed diffusion or confinement by the cytoskeletal or other nanoscale compartmentalization structures in the plasma membrane (11,15,19–23). One of the main advantages of single-molecule fluorescence microscopy is the ability to track single protein molecules to provide details on the kinetics of protein association and dissociation. When the trajectories of a single protein species are recorded in multiple colors, they can reveal the kinetics of homodimerization interactions by comovement of the labeled molecules (11,24). For this comovement analysis, the protein species needs to be labeled with fluorophores emitting light at spectrally distinct wavelengths to allow simultaneous visualization at high resolution of two distinct proteins (of one protein species). Knowledge of protein interactions and their kinetics is important to understand the underlying signal transduction mechanisms and to model the cellular signal regulatory system (25–27).
A common approach to fluorescent labeling of proteins is to clone and express the protein of interest fused to an autofluorescent protein (FP). Several FPs are currently available that are suitable for single-molecule tracking, such as mCitrine, mCherry (28), and the infra-red iRFP (29). Although these genetically encoded labels allow multicolor tracking, FPs cannot match the photostability of small organic dyes (2,30), limiting the timescale over which a protein can be tracked and the accuracy with which it can be localized. To permit imaging of longer trajectories, fluorescent probes should ideally be bright and photostable (i.e., slow to photobleach) in addition to being specifically linkable to the protein of interest. The tools of choice in this case are organic dyes and quantum dots (Qdots). Although Qdots are extremely bright and photostable, they are larger than most proteins themselves, which might sterically hinder the movement of the protein (31). In addition, the use of monovalent quantum dots requires custom fabrication (32–34), and they might suffer from nonspecific labeling or aggregation (35,36).
More recent genetic techniques allow the specific and monovalent labeling of recombinant proteins with small organic fluorophores in live cells. Labeling by means of protein tags complements other approaches to labeling proteins with organic fluorophores, such as labeling with fluorescently labeled ligands and immunostaining with antibodies or Fab fragments. Since the tag does not compete with ligand binding and has no antagonistic function, the effects of ligands or inhibitors on ligand-free and fully functional receptors can be studied. The monovalency of the substrates ensures that no artificial clustering is induced. Among the most versatile of the protein tags is the SNAP-tag, a 20 kDa mutant of the human DNA repair protein O6-alkylguanine-DNA alkyltransferase (hAGT) that reacts specifically and rapidly with benzylguanine (BG) or benzylchloropyrimidine (CP) derivatives, leading to a covalent labeling of the SNAP-tag with a synthetic probe (37–41). The reaction occurs through a well-defined mechanism and predictable monovalent stoichiometry. For example, BG substrates derived from organic fluorophores react with SNAP-tag to provide specific labeling of a protein species with a fluorescent label at physiologically relevant conditions in the cell (Fig. 1). For labeling at the single-molecule level, SNAP-tag is especially suitable to label plasma membrane resident proteins using membrane-impermeable substrates.
Figure 1.
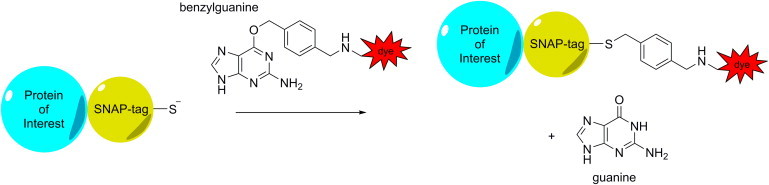
Schematic of the binding of a benzylguanine (BG) substrate to a SNAP-tag fusion protein. The SNAP-tag is fused to a protein of interest. Upon binding, the benzyl group reacts with a cysteine in the active site of SNAP-tag, releasing the guanine group. In this survey, the BG was conjugated to fluorescent dyes, but BG can in principle be coupled to any molecule of choice. To see this figure in color, go online.
There are a wide variety of reported applications in protein labeling for the SNAP-tag system, including super-resolution imaging (42–44), analysis of protein function (45) and protein half-life (46), observation of protein-protein interactions (47), sensing cell metabolites (48), and identification of drug targets (49). SNAP-tag labeling has also been utilized to study several protein complexes at the single-molecule level (50–59). Although the application of the SNAP-tag labeling system for single-molecule tracking had already been suggested (14), only recently did Calebiro et al. demonstrate the first example, to our knowledge, of this tagging technology for single-color fluorescence tracking (60). These authors used direct receptor labeling with SNAP-tag to dynamically monitor the adrenergic receptors β1AR and β2AR and the γ-aminobutyric acid GABAB receptor on intact cells, and compared their spatial arrangement, mobility, and supramolecular organization. Benke et al. have recently shown a new approach to single-molecule tracking by using the blinking properties of synthetic dyes attached to SNAP-tag (61). Although this approach optimizes the total number of observable diffusion steps, it does not facilitate the observation of a single protein for as extended a period of time as possible, a requirement for the study of binding associations.
Here we report a comprehensive survey on the photostability and binding specificity of several SNAP-tag fluorescent substrates using widefield and total internal reflection fluorescence (TIRF) single-molecule microscopy. We have investigated the suitability of 22 fluorescent substrates (BG dyes) by characterizing their properties in living cells using a C-terminal (extracellular) SNAP-tag fusion to the epidermal growth factor receptor (EGFR), a plasma membrane resident protein. Due to the significant autofluorescence of cells when using blue-excitable dyes, we limited our survey to green- and red-excitable dyes. Since a lot of dyes are available in this spectral range, we selected dyes from different manufacturers that are commonly available and used, trying to include dyes from various chromophore families. We emphasize that it is essential to study the fluorophores in the cellular setting, because photophysical properties are known to differ depending on the nature of their conjugate and their microenvironment. For example, different photostabilities have been observed for fluorescent proteins on different interfaces, due to the apparent role of the protein shell rigidity for each chromophore (62). In addition, the fluorescence of a number of fluorophores may be quenched by electron donors like guanine, tryptophan, etc. (63). Therefore, the photophysical properties of free substrates in solution or immobilized on a glass surface do not necessarily reflect their properties after reaction with the SNAP-tag fused protein. Very recently, the photostability of two red-excitable fluorescent substrates was measured for another protein tag (A-TMP) at the single-molecule level (64). The binding specificity for these substrates was not determined.
Methods
Chemicals, purification, and analysis of SNAP-tag substrates
Commercially available compounds were used without further purification. SNAP-Surface Alexa Fluor 546 (BG-Alexa 546), SNAP-Surface 549 (BG-Dy 549), SNAP-Surface 632 (BG-Dy 632), SNAP-Surface 647 (BG-Dy 647), SNAP-Surface Alexa Fluor 647 (BG-Alexa 647), and SNAP-Surface 649 (BG-Dy 649) were obtained from New England Biolabs (Ipswich, MA).
BG-Atto 550, BG-Atto 565, BG-Atto 620, BG-Atto 633, BG-Atto 647N, BG-Atto 655, and BG-TF5 have been described previously (40–42,65). The remaining substrates for the labeling of SNAP-tag fusion proteins were prepared by reacting the building block BG-NH2 (S9148, New England Biolabs) with commercially available N-hydroxysuccinimide esters (NHS) of the corresponding fluorophores. Atto Rho6G and Atto 532 were obtained from Atto-Tec (Siegen, Germany); Dy 549, Dy 630, Dy 634, Dy 648, and Dy 651 were obtained from Dyomics (Jena, Germany). CF633 and CF640R were obtained from Biotium (Hayward, CA), and Star635 was obtained from Abberior (Göttingen, Germany).
BG-549-549, BG-Dy 651, BG-CF 633, BG-CF 640R, and BG-Star 635 were purified and analyzed with the following equipment. Reverse-phase high-performance liquid chromatography (HPLC) was performed on an Agilent LC/MS Single Quad System 1200 Series (analytical) and Agilent 1100 Preparative-Scale Purification System (semi-preparative). Analytical HPLC was performed on a Waters Atlantis T3 C18 column (2.1 × 150 mm, 5 μm particle size) at a flow rate of 0.5 mL/min with a binary gradient from Phase A (0.1 M triethyl ammonium bicarbonate (TEAB) or 0.1% trifluoroacetic acid (TFA) in water) to Phase B (acetonitrile) and monitored by absorbance at 280 nm. Semipreparative HPLC was performed on VYDAC 218TP series C18 polymeric reverse-phase column (22 × 250 mm, 10 μm particle size) at a flow rate of 20 mL/min. Mass spectra were recorded by electrospray ionization (ESI) on an Agilent 6120 Quadrupole LC/MS system. BG-Atto Rho6G, BG-Dy 630, BG-Dy 634, and BG-Dy 648 were purified and analyzed as follows. Reverse-phase high-performance liquid chromatography (HPLC) was performed on the Shimadzu SCL-10 AD VP series (analytical) and the Shimadzu LC-20 AD System (preparative). Analytical HPLC was performed on a reverse-phase HPLC column (GraceSmart PP18, 50 mm × 2.1 mm, 3 μm) at a flow rate of 0.20 mL/min and a binary gradient of acetonitrile in water (both containing 0.1% formic acid) at 298 K. Mass and ultraviolet-visible spectra were recorded with an ion trap (LCQ Fleet Ion Trap Mass Spectrometer, Thermo Scientific, Waltham, MA) and a diode array detector (Finnigan Surveyor PDA Plus detector, Thermo Electron, Waltham, MA). Preparative reverse-phase HPLC was performed on a reverse-phase HPLC column (GraceAlpha C18, 5 μ, 250 mm × 4.6 mm; Fisher Scientific, Waltham, MA) at a flow rate of 1 mL/min with an isocratic gradient of Phase A (0.1% formic acid in water or 25 mM ammonium acetate in water, pH 4) to Phase B (0.1% formic acid in acetonitrile) and monitored with an ultraviolet-visible detector (SPD-10AV VP series, Shimadzu, Kyoto, Japan).
Further details of the synthesis of the SNAP-tag substrates are described in the Supporting Material.
Cell culture
All cell culture materials were obtained from PAA Laboratories (Pasching, Austria) unless stated otherwise. MCF7 cells were cultured in high-glucose Dulbecco’s modified Eagle’s medium (DMEM) supplemented with 10% fetal bovine serum and penicillin streptomycin at 37°C with 5% CO2. The H441 epithelial human lung adenocarcinoma cancer cell line was a gift from Anton Terwisscha van Scheltinga (Department of Medical Oncology, University of Groningen, Groningen, The Netherlands). These cells were cultured in Roswell Park Memorial Institute (RPMI) 1640 medium supplemented as above. The HeLa epithelial human cervix adenocarcinoma cancer cell line was a gift from Wilma Petersen (University of Twente, Twente, The Netherlands), and was cultured in Iscove's modified Dulbecco's media (IMDM) supplemented as above.
We created stably expressing SNAP-EGFR HeLa cells by transfecting HeLa cells in a 60 cm2 well of 40%-confluent cells using 9 μg of SNAP-EGFR plasmid DNA plus 20 μL lipofectamine LTX and 9 μL Plus reagent (Invitrogen, Carlsbad, CA) in 15 mL penicillin-streptomycin-free cell medium, as described in the suppliers’ protocol. Selection (1400 μg/mL of active G418) was applied after 24 h. After 5 days, the cells were split over two six-well plates. After 10 days, the wells were screened for expression of SNAP-EGFR by labeling with 500 nM BG-Alexa 546 for 15 min and fluorescence microscopy analysis on the single-molecule sensitive microscope, as described later. Note that the expression level can be very low at this stage, and the imaging required a single-molecule-sensitive fluorescence microscope. One well contained positive cells with an expression level slightly above the single-molecule level; these cells were further cultured. For culturing, the concentration of active G418 was 350 μg/mL.
Sample preparation
For each dye, video recordings were taken of four samples: the SNAP-tag-positive cells and the three negative cell lines. Before measurements, HeLa cells stably expressing SNAP-EGFR, HeLa cells, MCF7 cells, and H441 cells were plated in Greiner Bio CellView dishes (product no. 627870) in full medium, and left overnight to allow the cells to adhere to the glass. The HeLa cells stably expressing SNAP-EGFR were also starved in fetal-bovine-serum-free medium and left for another night to reduce the activity and internalization of the EGFR fusion protein. On the day of the experiment, cells were washed with starvation medium containing 0.5% bovine serum albumin. Labeling of the SNAP-EGFR proteins was carried out thereafter by incubating the cells for 2 min (±10 s) with 400 nM of each BG dye in starvation medium containing 0.5% bovine serum albumin. Samples were washed immediately by replacing the labeling solution with phosphate-buffered saline supplemented with magnesium and calcium. This washing step was repeated at least three times. Incubation and washing of the SNAP-tag negative cells with the substrates was performed using the same conditions.
Microscopy settings
The microscope hardware is described in the Supporting Material. Measurements to determine nonspecific binding of the SNAP substrates were performed using widefield and TIRF illumination. Measurements to determine the photobleaching of the substrates were performed using widefield illumination. The illumination time differed for each fluorescent substrate, and was chosen in such a way that single molecules were clearly visible over the autofluorescence background of the cell. We sought to collect the same average number of photons per molecule in a frame for each fluorescent substrate. Since the quantum yield has not been previously determined for all fluorescent substrates, the illumination time to yield an equal number of emitted photons per molecule could not be calculated beforehand. Videos were recorded at 20–30 fps, which is the highest allowed frame rate of the camera at the maximum readout rate of 10 MHz and frame size of 512 × 512 pixels. Each video recording consisted of 800 frames. Before recording each video, a minimal number of frames (∼10–30 frames) were used to focus on the basal membrane of the cell.
Single-molecule brightness
To allow conversion of pixel counts to photons, a calibration of the gain of the two EMCCD cameras was performed by the mean-variance method (Fig. S1 in the Supporting Material). The slope of the line in this curve is equal to the inverse gain of the camera. A gain of 49.9 ± 0.1 was found for the camera recording the green-excitable dyes, and a gain of 32.5 ± 0.1 was found for the camera recording the red-excitable dyes. The pixel intensities in counts are divided by the camera gain to convert the pixel intensities to photons. The brightness of one molecule (sometimes also termed spot intensity) was calculated as the integrated intensity of a single molecule using a Gaussian fit performed by the tracking algorithm used (66). This yields for all single molecules the number of detected photons per single molecule per frame. We defined the single-molecule brightness, B, as the average of these numbers in one recording.
The brightness of the dye conjugates can be compared between dyes by a relative brightness (Table S1), which is a normalized value given by the single-molecule brightness, B (Fig. S2), divided by the acquisition time, the excitation efficiency , the emission efficiency, and the laser excitation power. The excitation efficiency, , is equal to the fraction of the maximum value of the excitation spectrum of the dye at the wavelength of the lasers, i.e., 532 nm for the green dyes and 637 nm for the red dyes. The spectra of the dyes were downloaded from the SemRock website (http://www.semrock.com), except for the CF dyes, TF5, and Star635; we measured the spectra for these dyes with a Varian Cary Eclipse fluorescence spectrophotometer (Palo Alto, CA).
Tracking of single molecules
To obtain trajectories from the raw videos, we used previously described tracking software (11,66). The settings used for the cost matrices in this software can be found in the Supporting Material. For the initial detection of molecules, the tracking algorithm uses an intensity threshold. This threshold was taken as the same for all video series of one fluorescent substrate to obtain a fair comparison of the level of specific and nonspecific labeling. The threshold was determined in the situation where the substrates are incubated with SNAP-tag-expressing cells (specifically attached); we used the same threshold values in the detection of nonspecifically attached substrates.
After obtaining the single-molecule trajectories, two filtering operations were applied with the purpose of discarding very short tracks, and differentiating between completely immobile and (transiently) mobile molecules. Very short tracks (having fewer than seven localizations in total) were excluded, as they did not contain much significant information; there is also a higher chance that a fluorescent spot that is detected only for a few frames was attributable to noise rather than to a specifically labeled fluorescent molecule. A segment of a track was defined as the subsequent positions of a fluorescent molecule in adjacent frames. This meant that blinking of a dye resulted in multiple segments within a track. Immobile tracks were discarded because they often represented dye molecules bound to the glass surface; they were detected using a radius-of-gyration algorithm (67). The threshold for the trajectory area was defined by a gyration radius of 40 nm, as this corresponded to the apparent area traveled by an immobile molecule due to the localization accuracy.
Analysis of single-molecule photobleaching rate
The number of fluorescent molecules, N(i), in each frame i was determined for each recording. Since photobleaching follows an exponential decay profile, the photobleaching rates are obtained for each video recording by fitting the number of molecules over time with a one-component exponential function without offset:
| (1) |
where i is the frame number, τ is the mean photobleaching time (in frames), hence is the rate of photobleaching per frame, and N(1) is the fitted number of molecules in the first frame (i = 1). The fit was performed over frame numbers 20–600. In the first few frames, the autofluorescence of the cells might obscure a proper detection of single molecules by the algorithm. Because the autofluorescence bleaches rapidly, the fluorescent molecules can be reliably detected after 20 frames. At frame 600, the number of molecules was reduced to a basal level in most recordings. The fluorophore’s mean photobleaching time, τ, is multiplied by the single-molecule brightness, B. This yields the expected average number of detected photons per molecule, P.
Since the dye conjugates have different emission spectra, we corrected for the transmission efficiency of the filter set to obtain a precise comparison of the dyes. The most relevant parameter to compare is the photobleaching rate per emitted photon and not per detected photon. This is because not all the emitted photons pass the filters placed before the camera. Not all of the emitted photons are collected by the objective, but the fraction of photons collected is the same for all the dyes, and it is therefore not necessary to correct for this. Furthermore, the quantum efficiency of the CCD chip is similar around the measured wavelengths. Therefore, the photobleaching rates were only corrected for the efficiency of the filter set, , which describes the efficiency with which the emitted fluorescence passed the filter set used. The expected number of detectable photons, Pcorr, is given by the expected detected number of photons, P, divided by the detection efficiency, . The detection efficiency, , of a dye was determined by integration over the combined transmission spectrum of the dichroic mirrors and the emission filter multiplied by the normalized emission spectrum of the dye. This efficiency is listed for each dye in Table S1. The expected number of detectable photons per molecule, Pcorr, was calculated as
| (2) |
Results
Nonspecific binding of the SNAP substrates
We first screened the dyes to assess the level of nonspecific staining of the dye conjugates in cells not expressing the SNAP-tag fusion protein (SNAP-tag-negative cells). We excluded from further analyses substrates leading to high nonspecific staining of intracellular structures. The microscopy video recordings of H441 cells incubated with each dye conjugate are shown in Fig. 2 (widefield illumination) and in Fig. S3 (TIRF illumination). In all the images, there was full confluence of cells in the field of view. Although TIRF images are often preferred over widefield images to record receptor proteins due to the reduced background level, likewise, only nonspecific staining near and at the plasma membrane of the cells will be observed with TIRF imaging. Nonspecifically stained intracellular structures were better observed using widefield imaging, and were used for screening of nonspecific staining. The screening for nonspecific binding was based on observations of at least 50 cells per sample, and resulted in the exclusion of the following substrates: Atto-550, Atto-565, Atto-620, Atto-633, Atto-647N, Dy-630, Dy-651, and Star-635.
Figure 2.
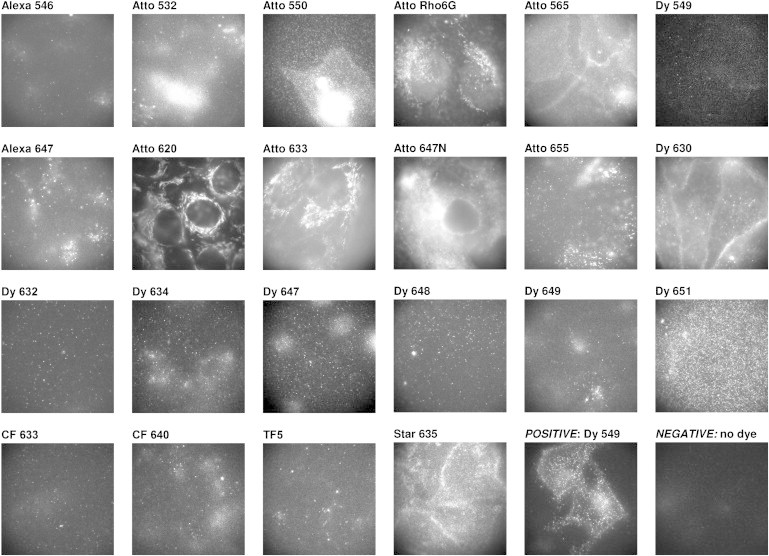
Fluorescence images of SNAP-tag-negative cells incubated with SNAP-tag fluorescent substrates. Incubation of the fluorescent substrates with SNAP-tag-negative cells reveals large differences in nonspecific binding to cellular components or the glass surface. An image showing the staining on SNAP-tag-positive cells is included for comparison. The images are recorded in widefield mode on a single-molecule-sensitive microscope. The field of view was completely confluent with cells. The size of the images is 61 × 61 μm. The photon intensity scale has not been determined, and varies between images.
The fluorescent substrates tested exhibited similar levels of nonspecific staining in HeLa cells (data not shown). The nonspecific staining observed did not appear to substantially vary among cells in the same sample, or between samples prepared on different days. Dead cells usually showed much more nonspecific staining than healthy cells.
The remaining dye conjugates were incubated with SNAP-tag-negative HeLa, MCF7, and H441 cells. Microscopy recordings were taken for each SNAP substrate in the different cell lines, with the focus of the microscope at the basal membrane of the cells. The tracking algorithm provided the number of detected molecules in each frame. For each substrate, the camera acquisition time used was the same as that used in the recordings with the SNAP-tag-positive cells (see Table S1). This ensured that the number of detectable nonspecific molecules was determined under the same imaging and tracking conditions as for the imaging of specifically bound molecules. Next we differentiated completely immobile molecules from (transiently) mobile molecules. Completely immobile molecules are often molecules bound to the glass substrate; these are typically of less concern, since they can usually be readily excluded before further analysis. In contrast, nonspecific mobile molecules obscure the analysis of the specifically labeled protein molecules.
The average number of mobile molecules, as well as the total number of molecules (mobile and immobile), detected in frame numbers 20–40 are shown in Fig. 3. The first 20 frames were excluded because the autofluorescence of the cells is then particularly high, which obscures the specific detection of labeled proteins. Only regions with full confluence of cells were recorded. The total number of nonspecific molecules per field of view is a measure of the expected number of molecules adsorbed on the glass substrate (underneath the cells), the immobile molecules, plus the number of false-positive molecules on the plasma membrane, the (transiently) mobile molecules. The number of nonspecific molecules in frame numbers 120–140 is also shown to gain insight into the photobleaching of nonspecifically bound substrates.
Figure 3.
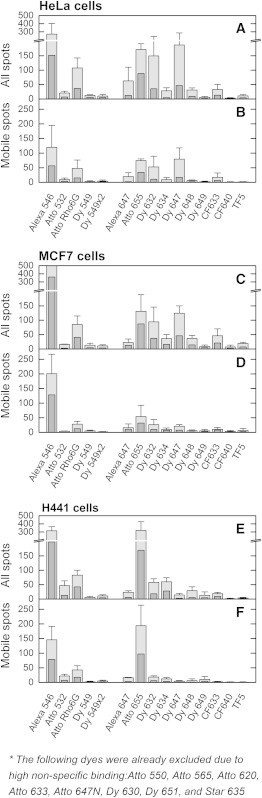
Quantification of the nonspecific binding of SNAP-tag fluorescent substrates in live cells. The values show the number of mobile fluorescent substrates and the total number of fluorescent substrates (mobile and immobile) that were nonspecifically bound to cells. The values were determined per field of view area in HeLa, MCF7, and H441 cell lines for each dye showing nonspecific binding on the single-molecule level. Some dyes had extremely high levels of nonspecific binding, and since no individual spots could be detected, these were excluded from this graph. Shown are the average number of molecules detected in frame numbers 20–40 (light gray) and 120–140 (dark gray). The field of view is a circular area (1520 μm2) with a radius of ∼22 μm. The values were determined in multiple recordings, and the average number is shown here, with the error representing the sample standard deviation.
Photostability of the substrates bound to SNAP-tag
To determine the photostability of the dyes bound to SNAP-tag, we incubated them with cells expressing the SNAP-EGFR fusion protein. Microscopy recordings were taken for each dye conjugate to determine the photobleaching rate of the dyes bound to SNAP-tag. To avoid variance between cells of different samples as a result of transfection, we used a stably transfected HeLa cell line, which had low expression levels of SNAP-EGFR (single-molecule density). We optimized the incubation concentration and time for high labeling efficiency and low nonspecific binding using a titration series with BG-Alexa 546, and found that 2 min incubation with 400 nM of substrate was enough for a complete labeling with this dye (and also used these incubation conditions in the nonspecific binding assay). Note that incubation using elevated dye concentrations or prolonged incubation time might result in higher nonspecific binding levels. For each dye conjugate, we observed a similar percentage of labeled cells (estimated to be 15%) irrespective of the specific dye choice. We believe that this percentage of labeled cells was caused by a large population of cells that do not express the SNAP-tag. The fraction of SNAP-tag receptors labeled in cells appeared to vary slightly from dye to dye.
For an accurate comparison, we aimed to obtain the same number of detected photons per frame (single-molecule brightness, B) for all green and all red dyes. All the dyes were bright enough to be detected at a single-molecule level in a widefield setup in the presence of cellular autofluorescence background. A widefield setup is more appropriate than a TIRF setup for an accurate comparison as the single-molecule brightness, B, is very difficult to control in TIRF due to varying TIRF angles and the presence of molecules at different depths. Furthermore, the expected number of photons emitted from a fluorophore does not depend on the type of illumination. For the characterization procedure followed, we found that optimal single-molecule brightness was B = 150 photons for red-excitable dyes and B = 200 photons for green-excitable dyes. Some dyes needed a relatively long acquisition time to obtain the targeted single-molecule brightness, B (see Table S1 for the acquisition times used and Fig. S2 for the resulting single-molecule brightness, B). Table S1 also lists the relative brightness of each dye conjugate to SNAP-tag. At least four movies of different cells per dye conjugate were recorded and analyzed (Fig. 4 A and Movie S1). The brightness (spot intensity) of the molecules follows a Poisson-like distribution, as shown in Fig. 4 B.
Figure 4.
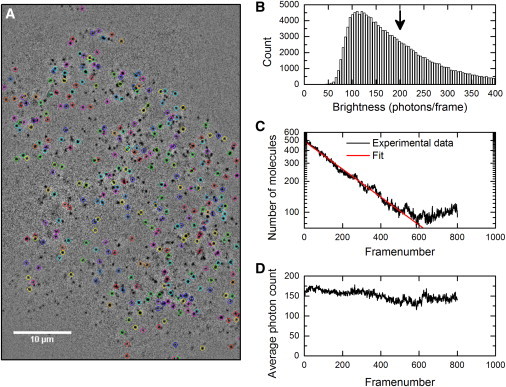
Example of the performed photobleaching analysis on one video recording. A fluorescence image series of SNAP-EGFR labeled with a BG-Dy 549 was recorded. (A) The tracking algorithm finds the molecules in the raw microscope recording, and after exclusion of immobile molecules and very short trajectories, the detected molecules are encircled in the microscopy recording, where colors are used to differentiate tracks; see also Movie S1. (B) Histogram of the number of detected photons per frame of all the found molecules (brightness or spot intensity). The arrow indicates the average of the values, which we defined as the single-molecule brightness, B. (C) Number of detected molecules per frame, N(i), as a function of frame number i. In red, a fit of the data using a single-exponential decay function according to Eq. 1 to yield the mean photobleaching time, τ, for each fluorophore. (D) The average brightness of the molecules in one frame does not change over time, confirming that we indeed looked at single molecules. To see this figure in color, go online.
Due to photobleaching, the number of observed fluorescent molecules, N(i), decreased over time (Fig. 4 C). We fitted the rate of photobleaching using Eq. 1 to extract the mean photobleaching time, τ, for each fluorophore. Using Eq. 2, the expected number of detectable photons per molecule, Pcorr, was calculated. A basal level of detected molecules was observed even after a long imaging time. We believe that these remaining molecules are the result of molecules in an intermittent state (blinking) and a constant influx of molecules from out-of-focus areas into focus. The expected number of detectable photons per molecule, Pcorr, was obtained from multiple recordings per fluorescent substrate, and the average value and standard deviation are shown in Fig. 5. The conversion from numbers of molecules to photons requires that single molecules be detected. This was checked by confirming that the number of emitted photons per molecule does not vary over time (Fig. 4 D).
Figure 5.
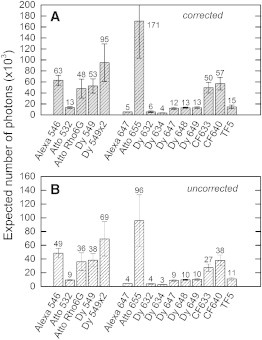
Expected number of detectable photons per molecule, Pcorr, for each SNAP-tag fluorescent substrate. The expected number of photons provides a value for the photostability of a dye conjugate. The values were determined in multiple recordings, and the average number is shown here, with the error representing the sample standard deviation. (A) Values are corrected for the detection efficiency of the microscope for each dye. (B) Values are not corrected for the detection efficiency, and represent the expected number of photons detected in our setup.
In Fig. 6, we summarize the results for nonspecific binding versus the photostability for each dye. From this figure, it is clear that both green- (e.g., Dy 549) and red-excitable dyes (e.g., CF633 and CF640) are suitable for single-molecule tracking. This result allowed us to examine the possibility of simultaneously labeling the SNAP-tag with two spectrally different dyes. The simultaneous incubation of a 1.0:0.67 mixture of BG-CF633 and BG-Dy 549 resulted in roughly equal labeling of the SNAP-tag receptor with these two dyes (Fig. 7). Movie S2 shows SNAP-EGFR proteins labeled with these two dyes diffusing in the plasma membrane of a live cell. The disappearance of receptors is due to photobleaching.
Figure 6.
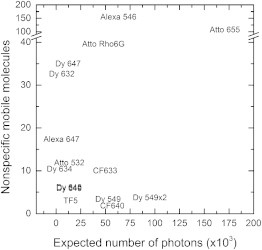
Comparison of the performance of the SNAP-tag fluorescent substrates for use in single-molecule tracking microscopy. The performance is shown in terms of photostability and nonspecific binding. BG-Dy 648 and BG-Dy 649 overlap in the graph. Fluorescent substrates in the lower right corner show little nonspecific attachment to cells, and the most emitted photons per molecule before photobleaching. These substrates are the preferred choice for single-molecule tracking microscopy.
Figure 7.
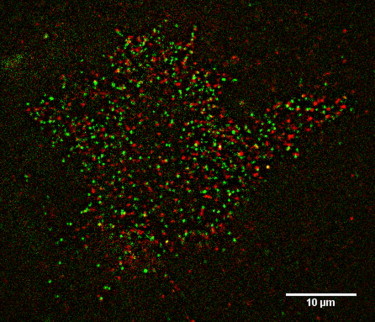
A TIRF image demonstrating dual-color labeling of SNAP-tag receptors at the single-molecule level. The labeling was performed on SNAP-EGFR with BG-Dy549 (green) and BG-CF633 (red). The combination of relatively photostable dye conjugates with little nonspecific staining allows multicolor single-molecule tracking microscopy. Using this technique, receptor homodimers can be directly visualized. See also Movie S2. To see this figure in color, go online.
Discussion
The results show that a careful choice of the dye to conjugate to the SNAP-substrate to label SNAP-tag fusion proteins is very important, as many fluorescent substrates suffer from either rapid photobleaching or high nonspecific staining. We found that of the 22 fluorescent substrates tested, three can be used for single-molecule tracking applications, as these substrates combine both a low level of nonspecific binding and a high photostability. Among the green-excitable fluorescent substrates, BG-Dy 549 showed the highest photostability with the lowest nonspecific staining (Fig. 6). As an alternative, BG-Alexa 546 could be used in ensemble measurements (e.g., FRET studies), as it is photostable and only results in detectable nonspecific binding at the single-molecule level. Among the red-excitable fluorescent substrates, BG-CF640 and BG-CF633 exhibited the best results (Fig. 6). Whereas BG-CF640 showed slightly lower nonspecific staining, CF633 might be relatively brighter depending on the filter sets available. Even though BG-Atto 655 showed the highest photostability among the substrates tested (Fig. 5), its use is limited to ensemble measurements, since it showed high levels of nonspecific binding to membrane components of all the three cell lines (Fig. 3).
Nonspecific binding of the SNAP substrates
One of the main advantages of single-molecule tracking techniques is the ability to discriminate single mobile molecules from cellular autofluorescence, immobile fluorescent molecules, and clusters of fluorescent molecules. We utilized this to characterize the nonspecific binding of the fluorescent substrates. Dealing with the nonspecific binding of fluorophores to any cellular components is one of the biggest challenges in microscopy. Several of the BG dyes tested showed high levels of nonspecific binding (Fig. 2). We found that the amount of nonspecific binding of the BG dyes is roughly the same among the cell lines tested (Fig. 3). None of the dyes that led to appreciable levels of nonspecific staining photobleached within a short period (Fig. 3); hence, differences in photobleaching of specifically and nonspecifically bound dyes cannot be used advantageously to discriminate between the two cases.
The cause of nonspecific binding might be explained from a molecular perspective. Several dyes contain long-chain hydrocarbons that are lipophilic; therefore, they easily incorporate into lipid-rich structures such as cellular membranes. Sulfonate acid groups are often added to dyes to enhance their solubility in water. These groups are negatively charged and electrostatically repelled away from the negatively charged lipid headgroups in cellular membranes. Negatively charged dyes include sulfonated fluorescein- and cyanine-based dyes (68). On the other hand, cationic (positively charged) dyes, such as many rhodamine-based dyes have been reported to bind to mitochondria in live cells (69). Therefore, the major factors influencing nonspecific binding might be the lipophilic character of a dye in combination with localized electronic charges. Furthermore, the inability of certain dyes to penetrate the plasma membrane hinders access to intracellular structures. In general, neutral and anionic (negatively charged) dyes in this survey appeared to have less of a tendency to bind to cellular substructures (e.g., Alexa 546/647, Dy 632/634, Dy 648/649). Some dyes (e.g., Atto 647N and Dy 651) adhered to a large extent to the glass coverslip (which may be avoided by optimizing cleaning procedures), obscuring the detection of specifically bound single molecules in the adjacent plasma membrane of the cell. The complex effects of local charges in combination with polar and lipophilic groups in a dye molecule make it difficult to predict the nonspecific binding ability of dyes beforehand. For example, the net charge of a molecule does not completely explain the nonspecific interaction, such as for the negatively charged BG-Dy 651 and the neutrally charged BG-Dy 630. Both showed a considerable amount of nonspecific binding to cellular components. We also did not find a correlation between the chromophore family and the nonspecific labeling level. For example, the incubation of cells with the rhodamine-derived dyes BG-Alexa 546 and BG-Atto 532 resulted in low nonspecific levels, whereas BG-Atto 550 and BG-Atto 565 led to much higher nonspecific levels. Likewise, the cyanine-based BG-Alexa 647 showed almost no nonspecific binding, whereas the BG-Dy 630 exhibited extremely high nonspecific binding.
Benke et al. have reported the use of five BG dyes for single-molecule tracking in eukaryotic cells (61). In their approach, the fluorescence of these dyes was stochastically activated for superresolution microscopy; however, no data on nonspecific binding was provided. Stöhr et al. described the quenching of several dyes after conjugation to BG and subsequent SNAP-tag binding (63,70). Their data demonstrate that the photophysics (i.e., the photobleaching time and fluorescence quenching) of a given dye can be altered by its molecular environment. Furthermore, they conclude that it is impossible to predict the changes in fluorescence beforehand due to the complex effects of local charges in the dye molecule. Stöhr et al. also reported on the background levels of remaining unreacted dyes inside Escherichia coli after washing protocols. Interestingly, some substrates, such as BG-Atto 620 and BG-Atto 633, which reportedly exhibited a low background staining in E. coli, led to a surprisingly high nonspecific binding in our experiments with mammalian cell lines. Stöhr et al. also reported the labeling of 3T3 fibroblast cells with BG-Atto 550, BG-Atto 633, and BG-Atto 647N. In a similar way, we noticed that BG-Atto 550 and BG-Atto 647N produced high levels of nonspecific binding. However, in contrast to the results of Stöhr et al., in our case, BG-Atto 633 showed a very intense nonspecific staining of cytosolic and membrane structures (Fig. 2 and Fig. S2). This discrepancy could be caused by the difference in fluorescence intensity levels between the two studies, as we looked at nonspecific staining in the context of single molecules.
Photostability of the substrates bound to SNAP-tag
Whereas many red-excitable dye conjugates did not show any substantial nonspecific binding levels, these dyes appeared to be less photostable than the green-excitable dyes. Two dyes, CF633 and CF640, are photostable enough to permit prolonged imaging with low nonspecific staining (Fig. 6). Between these two dyes, CF640 showed marginally less nonspecific staining (Fig. 3).
Another noteworthy observation was that the photostabilities of the Dy dyes of relatively close excitation wavelengths were very similar (Fig. 5), for instance, those of Dy 647, Dy 648, and Dy 649, as well as Dy 632 and Dy 634. From a molecular perspective, Dy 647, Dy 648, and Dy 649 are typical cyanine dyes, whereas Dy 632 and 634 have one indole group with a polymethine chain linked to a benzopyrylium group. The slight differences in these chromophores did not seem to have a large effect on its photobleaching rate.
Complications and validity
We have performed the photobleaching experiments on SNAP-tag fused transmembrane EGFR proteins, which have a basal internalization rate even when the cells are starved (71,72). This might lead to a false enhanced bleaching detection. During the 30 s of imaging, however, the internalization rate of the receptor is small compared to the photobleaching rate (73). Even 1 h after the labeling, no significant decrease of receptor molecules was observed at the plasma membrane of the cells. However, in some instances, a small increase in fluorescence in the cytosol was noticeable, which could be attributed to the basal level of receptor internalization and the recycling process. Another complication stems from the fact that this receptor seems to localize more in filopodia and the periphery of the cells (74); these receptors can diffuse more easily in and out of focus. Because molecules diffusing in and out of the plane of focus will likely be in equilibrium, this should not influence the recorded bleaching rate at the beginning of a recording, when receptors in focus have not been bleached yet. Later, however, as bleached receptors leave the plane, unbleached receptors can enter the focal plane from outside the plane, causing the bleaching rate to appear slower than it actually is. Therefore, we derived the bleaching rate from that part of the recordings where the number of molecules is still decreasing. Furthermore, the rate of receptors entering the focal plane within the 30 s of imaging will be limited, and this rate will be independent of the dye used.
Improvements to fluorescent SNAP substrates
The attachment of two Dy 549 dyes on a single SNAP substrate (Dy 549×2) seems to be an interesting approach to prolonging imaging of the protein, as its photostability almost doubled in comparison to the substrate with single-loaded Dy 549 (Fig. 5). The brightness of the double-loaded SNAP substrate was similar to that of the single-loaded substrate (Table S1). This might be due to self-quenching, which is commonly observed when the number of fluorophores on a protein is increased, and which affects the fluorescence intensity but not the photobleaching rate per photon for the complex. Further studies are needed to confirm that the (single-molecule) brightness is indeed similar in SNAP substrates with one, two, or even more Dy 549 fluorophores.
Another interesting approach is the incorporation of a strong fluorescence quencher in the guanine group. Such a fluorogenic method ensures that the benzylguanine coupled fluorophore becomes dramatically more fluorescent upon binding to the SNAP-tag (40). Although the guanine itself already acts as a relatively good quencher for several dyes (63), the more dramatic fluorogenic approach could bypass the issue of nonspecific binding for extremely photostable dyes such as Atto-655. Another interesting idea is to use a SNAP-tag substrate derivatized with a fluorophore and a triplet-state quencher (e.g., a molecular oxygen reducing agent) (75). This strategy has led to an overall decrease in the number of dark-state transitions, which led to imaging periods up to 25-fold longer (75). Prolonged imaging may allow observation and tracking of many more interactions of the protein on its path through the cell.
Conclusions
We have screened and analyzed the photostability and nonspecific binding properties of a wide range of green- and red-excitable dyes for labeling proteins in cells by means of the SNAP-tag technology. The SNAP-tag labeling strategy is particularly useful for labeling proteins on the plasma membrane, since there are no restrictions on the membrane permeability of the fluorescent label. Properties of dyes have generally been determined in ensemble fluorescence imaging and on relatively large biomolecules such as antibodies. However, properties of dyes can be rather different at the single-molecule level and when conjugated to a small biomolecule, such as the SNAP substrate (BG), and in the local microenvironment of the SNAP-tag. We have characterized the photostability and specificity for several SNAP-substrate dye conjugates in different cell lines at the single-molecule level. We performed the characterization in widefield mode to prevent illumination variations experienced in a TIRF setup, and at high single-molecule brightness to adequately count most dye molecules in the recordings. To provide a meaningful comparison, we used similar photon counts per single molecule for each spectrally similar dye, corrected for the detection efficiency of our microscope for the dye’s emission spectrum, and tracked the bound dyes to differentiate the motion of the nonspecifically bound molecules.
We found that in our system, the SNAP substrates labeled with Dy 549, CF633, and CF 640 are the best choices to label SNAP-tag fusion proteins for single-molecule tracking among the fluorescent substrates tested. Also, we show that the attachment of two Dy-549 dyes on one BG probe is an interesting approach for prolonging imaging of the protein. Finding two spectrally different SNAP-tag-labeling dyes that were suitable for single-molecule imaging proved to be a challenge, as most of the fluorescent substrates tested either showed a large amount of nonspecific fluorescence or were rapidly photobleached.
Since both green- and red-excitable fluorescent SNAP substrates have been identified, multicolor single-molecule imaging of the same protein species can become a routine experiment by simultaneously incubating these substrates with the SNAP-tag fusion proteins in live cells. This should allow direct observation of homodimers. For an extension to three-color single-molecule imaging, BG-Alexa 488 could be used as the third dye conjugate, since it is already known to be a suitable dye for single-molecule tracking (61), although the intense cellular autofluorescence at this excitation wavelength limits its use to TIRF microscopy. In addition, we anticipate that our conclusions could be applied to the chemically similar tagging technology CLIP-tag, which also has the guanine moiety in its substrate. Our results are probably not directly translatable to chemically different molecular tags, such as Halo Tag, or the acyl carrier protein based ACP and MCP tags. The combination of SNAP-tag with another molecular labeling tag allows orthogonal labeling on two different protein species. Thus, an interesting extension to single-protein-species studies is the direct visualization of two interacting proteins of different species, as occurs, for example, in heterodimer formation.
Acknowledgments
We thank Yvonne Kraan for assistance in cell culturing and sample preparations; and we thank Peter Relich and Keith Lidke of the University of New Mexico for sharing their tracking software with us.
PB and MS were supported by an ERA-NET NanoSci E+ grant through Stichting Technische Wetenschappen grant 11022-NanoActuate. JI is supported by the same ERANET NanoSci-E+ grant through DFG grant VE 579/1-1 and by the German Research Foundation via DFG grant VE 579/3-1.
Footnotes
Vinod Subramaniam’s present address is FOM Institute AMOLF, Science Park 104, 1098 XG Amsterdam, The Netherlands
Supporting Material
References
- 1.Kusumi A., Nakada C., Fujiwara T. Paradigm shift of the plasma membrane concept from the two-dimensional continuum fluid to the partitioned fluid: high-speed single-molecule tracking of membrane molecules. Annu. Rev. Biophys. Biomol. Struct. 2005;34:351–378. doi: 10.1146/annurev.biophys.34.040204.144637. [DOI] [PubMed] [Google Scholar]
- 2.Xia T., Li N., Fang X. Single-molecule fluorescence imaging in living cells. Annu. Rev. Phys. Chem. 2013;64:459–480. doi: 10.1146/annurev-physchem-040412-110127. [DOI] [PubMed] [Google Scholar]
- 3.Joo C., Balci H., Ha T. Advances in single-molecule fluorescence methods for molecular biology. Annu. Rev. Biochem. 2008;77:51–76. doi: 10.1146/annurev.biochem.77.070606.101543. [DOI] [PubMed] [Google Scholar]
- 4.Hinterdorfer P., van Oijen A. Springer; New York: 2009. Handbook of Single-Molecule Biophysics. [Google Scholar]
- 5.Joo C., Fareh M., Kim V.N. Bringing single-molecule spectroscopy to macromolecular protein complexes. Trends Biochem. Sci. 2013;38:30–37. doi: 10.1016/j.tibs.2012.10.005. [DOI] [PMC free article] [PubMed] [Google Scholar]
- 6.Lippincott-Schwartz J., Snapp E., Kenworthy A. Studying protein dynamics in living cells. Nat. Rev. Mol. Cell Biol. 2001;2:444–456. doi: 10.1038/35073068. [DOI] [PubMed] [Google Scholar]
- 7.Miyawaki A. Proteins on the move: insights gained from fluorescent protein technologies. Nat. Rev. Mol. Cell Biol. 2011;12:656–668. doi: 10.1038/nrm3199. [DOI] [PubMed] [Google Scholar]
- 8.Giepmans B.N.G., Adams S.R., Tsien R.Y. The fluorescent toolbox for assessing protein location and function. Science. 2006;312:217–224. doi: 10.1126/science.1124618. [DOI] [PubMed] [Google Scholar]
- 9.Pantoja R., Rodriguez E.A., Lester H.A. Single-molecule imaging of a fluorescent unnatural amino acid incorporated into nicotinic receptors. Biophys. J. 2009;96:226–237. doi: 10.1016/j.bpj.2008.09.034. [DOI] [PMC free article] [PubMed] [Google Scholar]
- 10.Callegari A., Luin S., Beltram F. Single particle tracking of acyl carrier protein (ACP)-tagged TrkA receptors in PC12nnr5 cells. J. Neurosci. Methods. 2012;204:82–86. doi: 10.1016/j.jneumeth.2011.10.019. [DOI] [PubMed] [Google Scholar]
- 11.Low-Nam S.T., Lidke K.A., Lidke D.S. ErbB1 dimerization is promoted by domain co-confinement and stabilized by ligand binding. Nat. Struct. Mol. Biol. 2011;18:1244–1249. doi: 10.1038/nsmb.2135. [DOI] [PMC free article] [PubMed] [Google Scholar]
- 12.Goulian M., Simon S.M. Tracking single proteins within cells. Biophys. J. 2000;79:2188–2198. doi: 10.1016/S0006-3495(00)76467-8. [DOI] [PMC free article] [PubMed] [Google Scholar]
- 13.Sako Y., Minoghchi S., Yanagida T. Single-molecule imaging of EGFR signalling on the surface of living cells. Nat. Cell Biol. 2000;2:168–172. doi: 10.1038/35004044. [DOI] [PubMed] [Google Scholar]
- 14.Wieser S., Schütz G.J. Tracking single molecules in the live cell plasma membrane: Do’s and Don’t’s. Methods. 2008;46:131–140. doi: 10.1016/j.ymeth.2008.06.010. [DOI] [PubMed] [Google Scholar]
- 15.Sergé A., Bertaux N., Marguet D. Dynamic multiple-target tracing to probe spatiotemporal cartography of cell membranes. Nat. Methods. 2008;5:687–694. doi: 10.1038/nmeth.1233. [DOI] [PubMed] [Google Scholar]
- 16.Kholodenko B.N., Hancock J.F., Kolch W. Signalling ballet in space and time. Nat. Rev. Mol. Cell Biol. 2010;11:414–426. doi: 10.1038/nrm2901. [DOI] [PMC free article] [PubMed] [Google Scholar]
- 17.Cambi A., Lidke D.S. Nanoscale membrane organization: where biochemistry meets advanced microscopy. ACS Chem. Biol. 2012;7:139–149. doi: 10.1021/cb200326g. [DOI] [PMC free article] [PubMed] [Google Scholar]
- 18.Saxton M.J., Jacobson K. Single-particle tracking: applications to membrane dynamics. Annu. Rev. Biophys. Biomol. Struct. 1997;26:373–399. doi: 10.1146/annurev.biophys.26.1.373. [DOI] [PubMed] [Google Scholar]
- 19.Kapanidis A.N., Strick T. Biology, one molecule at a time. Trends Biochem. Sci. 2009;34:234–243. doi: 10.1016/j.tibs.2009.01.008. [DOI] [PubMed] [Google Scholar]
- 20.Schütz G.J., Schindler H., Schmidt T. Single-molecule microscopy on model membranes reveals anomalous diffusion. Biophys. J. 1997;73:1073–1080. doi: 10.1016/S0006-3495(97)78139-6. [DOI] [PMC free article] [PubMed] [Google Scholar]
- 21.Brameshuber M., Schütz G.J. Springer; Berlin/Heidelberg: 2012. In Vivo Tracking of Single Biomolecules: What Trajectories Tell Us About the Acting Forces. [Google Scholar]
- 22.Dietrich C., Yang B., Jacobson K. Relationship of lipid rafts to transient confinement zones detected by single particle tracking. Biophys. J. 2002;82:274–284. doi: 10.1016/S0006-3495(02)75393-9. [DOI] [PMC free article] [PubMed] [Google Scholar]
- 23.de Keijzer S., Sergé A., Snaar-Jagalska B.E. A spatially restricted increase in receptor mobility is involved in directional sensing during Dictyostelium discoideum chemotaxis. J. Cell Sci. 2008;121:1750–1757. doi: 10.1242/jcs.030692. [DOI] [PubMed] [Google Scholar]
- 24.Cutler P.J., Malik M.D., Lidke K.A. Multi-color quantum dot tracking using a high-speed hyperspectral line-scanning microscope. PLoS ONE. 2013;8:e64320. doi: 10.1371/journal.pone.0064320. [DOI] [PMC free article] [PubMed] [Google Scholar]
- 25.Cebecauer M., Spitaler M., Magee A.I. Signalling complexes and clusters: functional advantages and methodological hurdles. J. Cell Sci. 2010;123:309–320. doi: 10.1242/jcs.061739. [DOI] [PubMed] [Google Scholar]
- 26.Harding A.S., Hancock J.F. Using plasma membrane nanoclusters to build better signaling circuits. Trends Cell Biol. 2008;18:364–371. doi: 10.1016/j.tcb.2008.05.006. [DOI] [PMC free article] [PubMed] [Google Scholar]
- 27.Radhakrishnan K., Halász Á., Wilson B.S. Mathematical simulation of membrane protein clustering for efficient signal transduction. Ann. Biomed. Eng. 2012;40:2307–2318. doi: 10.1007/s10439-012-0599-z. [DOI] [PMC free article] [PubMed] [Google Scholar]
- 28.Shaner N.C., Steinbach P.A., Tsien R.Y. A guide to choosing fluorescent proteins. Nat. Methods. 2005;2:905–909. doi: 10.1038/nmeth819. [DOI] [PubMed] [Google Scholar]
- 29.Filonov G.S., Piatkevich K.D., Verkhusha V.V. Bright and stable near-infrared fluorescent protein for in vivo imaging. Nat. Biotechnol. 2011;29:757–761. doi: 10.1038/nbt.1918. [DOI] [PMC free article] [PubMed] [Google Scholar]
- 30.Harms G.S., Cognet L., Schmidt T. Autofluorescent proteins in single-molecule research: applications to live cell imaging microscopy. Biophys. J. 2001;80:2396–2408. doi: 10.1016/S0006-3495(01)76209-1. [DOI] [PMC free article] [PubMed] [Google Scholar]
- 31.Wieser S., Axmann M., Schütz G.J. Versatile analysis of single-molecule tracking data by comprehensive testing against Monte Carlo simulations. Biophys. J. 2008;95:5988–6001. doi: 10.1529/biophysj.108.141655. [DOI] [PMC free article] [PubMed] [Google Scholar]
- 32.Howarth M., Liu W., Ting A.Y. Monovalent, reduced-size quantum dots for imaging receptors on living cells. Nat. Methods. 2008;5:397–399. doi: 10.1038/nmeth.1206. [DOI] [PMC free article] [PubMed] [Google Scholar]
- 33.Liu H.Y., Gao X. Engineering monovalent quantum dot-antibody bioconjugates with a hybrid gel system. Bioconjug. Chem. 2011;22:510–517. doi: 10.1021/bc200004z. [DOI] [PubMed] [Google Scholar]
- 34.Farlow J., Seo D., Jun Y.-W. Formation of targeted monovalent quantum dots by steric exclusion. Nat. Methods. 2013;10:1203–1205. doi: 10.1038/nmeth.2682. [DOI] [PMC free article] [PubMed] [Google Scholar]
- 35.Michalet X., Pinaud F.F., Weiss S. Quantum dots for live cells, in vivo imaging, and diagnostics. Science. 2005;307:538–544. doi: 10.1126/science.1104274. [DOI] [PMC free article] [PubMed] [Google Scholar]
- 36.Pinaud F., Clarke S., Dahan M. Probing cellular events, one quantum dot at a time. Nat. Methods. 2010;7:275–285. doi: 10.1038/nmeth.1444. [DOI] [PubMed] [Google Scholar]
- 37.Keppler A., Gendreizig S., Johnsson K. A general method for the covalent labeling of fusion proteins with small molecules in vivo. Nat. Biotechnol. 2003;21:86–89. doi: 10.1038/nbt765. [DOI] [PubMed] [Google Scholar]
- 38.Keppler A., Pick H., Johnsson K. Labeling of fusion proteins with synthetic fluorophores in live cells. Proc. Natl. Acad. Sci. USA. 2004;101:9955–9959. doi: 10.1073/pnas.0401923101. [DOI] [PMC free article] [PubMed] [Google Scholar]
- 39.Gautier A., Juillerat A., Johnsson K. An engineered protein tag for multiprotein labeling in living cells. Chem. Biol. 2008;15:128–136. doi: 10.1016/j.chembiol.2008.01.007. [DOI] [PubMed] [Google Scholar]
- 40.Sun X., Zhang A., Corrêa I.R., Jr. Development of SNAP-tag fluorogenic probes for wash-free fluorescence imaging. ChemBioChem. 2011;12:2217–2226. doi: 10.1002/cbic.201100173. [DOI] [PMC free article] [PubMed] [Google Scholar]
- 41.Corrêa I.R., Jr., Baker B., Xu M.-Q. Substrates for improved live-cell fluorescence labeling of SNAP-tag. Curr. Pharm. Des. 2013;19:5414–5420. doi: 10.2174/1381612811319300011. [DOI] [PubMed] [Google Scholar]
- 42.Pellett P.A., Sun X., Bewersdorf J. Two-color STED microscopy in living cells. Biomed. Opt. Express. 2011;2:2364–2371. doi: 10.1364/BOE.2.002364. [DOI] [PMC free article] [PubMed] [Google Scholar]
- 43.Dempsey G.T., Vaughan J.C., Zhuang X. Evaluation of fluorophores for optimal performance in localization-based super-resolution imaging. Nat. Methods. 2011;8:1027–1036. doi: 10.1038/nmeth.1768. [DOI] [PMC free article] [PubMed] [Google Scholar]
- 44.Klein T., Löschberger A., Sauer M. Live-cell dSTORM with SNAP-tag fusion proteins. Nat. Methods. 2011;8:7–9. doi: 10.1038/nmeth0111-7b. [DOI] [PubMed] [Google Scholar]
- 45.Foraker A.B., Camus S.M., Brodsky F.M. Clathrin promotes centrosome integrity in early mitosis through stabilization of centrosomal ch-TOG. J. Cell Biol. 2012;198:591–605. doi: 10.1083/jcb.201205116. [DOI] [PMC free article] [PubMed] [Google Scholar]
- 46.Bojkowska K., Santoni de Sio F., Trono D. Measuring in vivo protein half-life. Chem. Biol. 2011;18:805–815. doi: 10.1016/j.chembiol.2011.03.014. [DOI] [PubMed] [Google Scholar]
- 47.Ville D., DE Bellescize J., DES Portes V. Ring 14 chromosome presenting as early-onset isolated partial epilepsy. Dev. Med. Child Neurol. 2009;51:917–922. doi: 10.1111/j.1469-8749.2009.03292.x. [DOI] [PubMed] [Google Scholar]
- 48.Masharina A., Reymond L., Johnsson K. A fluorescent sensor for GABA and synthetic GABA(B) receptor ligands. J. Am. Chem. Soc. 2012;134:19026–19034. doi: 10.1021/ja306320s. [DOI] [PubMed] [Google Scholar]
- 49.Chidley C., Haruki H., Johnsson K. A yeast-based screen reveals that sulfasalazine inhibits tetrahydrobiopterin biosynthesis. Nat. Chem. Biol. 2011;7:375–383. doi: 10.1038/nchembio.557. [DOI] [PubMed] [Google Scholar]
- 50.Hoskins A.A., Friedman L.J., Moore M.J. Ordered and dynamic assembly of single spliceosomes. Science. 2011;331:1289–1295. doi: 10.1126/science.1198830. [DOI] [PMC free article] [PubMed] [Google Scholar]
- 51.Breitsprecher D., Jaiswal R., Goode B.L. Rocket launcher mechanism of collaborative actin assembly defined by single-molecule imaging. Science. 2012;336:1164–1168. doi: 10.1126/science.1218062. [DOI] [PMC free article] [PubMed] [Google Scholar]
- 52.Jaiswal R., Breitsprecher D., Goode B.L. The formin Daam1 and fascin directly collaborate to promote filopodia formation. Curr. Biol. 2013;23:1373–1379. doi: 10.1016/j.cub.2013.06.013. [DOI] [PMC free article] [PubMed] [Google Scholar]
- 53.Smith B.A., Daugherty-Clarke K., Gelles J. Pathway of actin filament branch formation by Arp2/3 complex revealed by single-molecule imaging. Proc. Natl. Acad. Sci. USA. 2013;110:1285–1290. doi: 10.1073/pnas.1211164110. [DOI] [PMC free article] [PubMed] [Google Scholar]
- 54.Smith B.A., Padrick S.B., Gelles J. Three-color single molecule imaging shows WASP detachment from Arp2/3 complex triggers actin filament branch formation. eLife. 2013;2:e01008. doi: 10.7554/eLife.01008. [DOI] [PMC free article] [PubMed] [Google Scholar]
- 55.Peisley A., Jo M.H., Hur S. Kinetic mechanism for viral dsRNA length discrimination by MDA5 filaments. Proc. Natl. Acad. Sci. USA. 2012;109:E3340–E3349. doi: 10.1073/pnas.1208618109. [DOI] [PMC free article] [PubMed] [Google Scholar]
- 56.Qiu W., Derr N.D., Reck-Peterson S.L. Dynein achieves processive motion using both stochastic and coordinated stepping. Nat. Struct. Mol. Biol. 2012;19:193–200. doi: 10.1038/nsmb.2205. [DOI] [PMC free article] [PubMed] [Google Scholar]
- 57.Derr N.D., Goodman B.S., Reck-Peterson S.L. Tug-of-war in motor protein ensembles revealed with a programmable DNA origami scaffold. Science. 2012;338:662–665. doi: 10.1126/science.1226734. [DOI] [PMC free article] [PubMed] [Google Scholar]
- 58.Numata N., Shima T., Sutoh K. C-sequence of the Dictyostelium cytoplasmic dynein participates in processivity modulation. FEBS Lett. 2011;585:1185–1190. doi: 10.1016/j.febslet.2011.03.036. [DOI] [PubMed] [Google Scholar]
- 59.Yang Y., Zhang C.Y. Simultaneous measurement of SUMOylation using SNAP/CLIP-tag-mediated translation at the single-molecule level. Angew. Chem. Int. Ed. Engl. 2013;52:691–694. doi: 10.1002/anie.201206695. [DOI] [PubMed] [Google Scholar]
- 60.Calebiro D., Rieken F., Lohse M.J. Single-molecule analysis of fluorescently labeled G-protein-coupled receptors reveals complexes with distinct dynamics and organization. Proc. Natl. Acad. Sci. USA. 2013;110:743–748. doi: 10.1073/pnas.1205798110. [DOI] [PMC free article] [PubMed] [Google Scholar]
- 61.Benke A., Olivier N., Manley S. Multicolor single molecule tracking of stochastically active synthetic dyes. Nano Lett. 2012;12:2619–2624. doi: 10.1021/nl301018r. [DOI] [PubMed] [Google Scholar]
- 62.Schenk A., Ivanchenko S., Nienhaus G.U. Photodynamics of red fluorescent proteins studied by fluorescence correlation spectroscopy. Biophys. J. 2004;86:384–394. doi: 10.1016/S0006-3495(04)74114-4. [DOI] [PMC free article] [PubMed] [Google Scholar]
- 63.Stöhr K., Siegberg D., Herten D.-P. Quenched substrates for live-cell labeling of SNAP-tagged fusion proteins with improved fluorescent background. Anal. Chem. 2010;82:8186–8193. doi: 10.1021/ac101521y. [DOI] [PubMed] [Google Scholar]
- 64.Wang T.Y., Friedman L.J., Cornish V.W. The covalent trimethoprim chemical tag facilitates single molecule imaging with organic fluorophores. Biophys. J. 2014;106:272–278. doi: 10.1016/j.bpj.2013.11.4488. [DOI] [PMC free article] [PubMed] [Google Scholar]
- 65.Lukinavičius G., Umezawa K., Johnsson K. A near-infrared fluorophore for live-cell super-resolution microscopy of cellular proteins. Nat. Chem. 2013;5:132–139. doi: 10.1038/nchem.1546. [DOI] [PubMed] [Google Scholar]
- 66.Smith C.S., Joseph N., Lidke K.A. Fast, single-molecule localization that achieves theoretically minimum uncertainty. Nat. Methods. 2010;7:373–375. doi: 10.1038/nmeth.1449. [DOI] [PMC free article] [PubMed] [Google Scholar]
- 67.Bosch P.J., Kanger J.S., Subramaniam V. Classification of dynamical diffusion states in single molecule tracking microscopy. Biophys. J. 2014;107 doi: 10.1016/j.bpj.2014.05.049. [DOI] [PMC free article] [PubMed] [Google Scholar]
- 68.Panchuk-Voloshina N., Haugland R.P., Haugland R.P. Alexa dyes, a series of new fluorescent dyes that yield exceptionally bright, photostable conjugates. J. Histochem. Cytochem. 1999;47:1179–1188. doi: 10.1177/002215549904700910. [DOI] [PubMed] [Google Scholar]
- 69.Johnson L.V., Walsh M.L., Chen L.B. Monitoring of relative mitochondrial membrane potential in living cells by fluorescence microscopy. J. Cell Biol. 1981;88:526–535. doi: 10.1083/jcb.88.3.526. [DOI] [PMC free article] [PubMed] [Google Scholar]
- 70.Stöhr, K. 2008. Fluoreszenzgelöschte Sonder für dianostische und analytische Anwendungen, PhD thesis, Heidelberg University, Heidelberg, Germany.
- 71.Citri A., Yarden Y. EGF-ERBB signalling: towards the systems level. Nat. Rev. Mol. Cell Biol. 2006;7:505–516. doi: 10.1038/nrm1962. [DOI] [PubMed] [Google Scholar]
- 72.Wang Q., Villeneuve G., Wang Z. Control of epidermal growth factor receptor endocytosis by receptor dimerization, rather than receptor kinase activation. EMBO Rep. 2005;6:942–948. doi: 10.1038/sj.embor.7400491. [DOI] [PMC free article] [PubMed] [Google Scholar]
- 73.Hofman E.G., Bader A.N., Van Bergen En Henegouwen P.M.P. Ligand-induced epidermal growth factor receptor (EGFR) oligomerization is kinase-dependent and enhances internalization. J. Biol. Chem. 2010;285:39481–39489. doi: 10.1074/jbc.M110.164731. [DOI] [PMC free article] [PubMed] [Google Scholar]
- 74.Lidke D.S., Nagy P., Jovin T.M. Quantum dot ligands provide new insights into erbB/HER receptor-mediated signal transduction. Nat. Biotechnol. 2004;22:198–203. doi: 10.1038/nbt929. [DOI] [PubMed] [Google Scholar]
- 75.Altman R.B., Zheng Q., Blanchard S.C. Enhanced photostability of cyanine fluorophores across the visible spectrum. Nat. Methods. 2012;9:428–429. doi: 10.1038/nmeth.1988. [DOI] [PMC free article] [PubMed] [Google Scholar]
Associated Data
This section collects any data citations, data availability statements, or supplementary materials included in this article.