

Abstract
The observation that, through a titration mechanism, microRNAs (miRNAs) can act as mediators of effective interactions among their common targets (competing endogenous RNAs or ceRNAs) has brought forward the idea (i.e., the ceRNA hypothesis) that RNAs can regulate each other in extended cross-talk networks. Such an ability might play a major role in posttranscriptional regulation to shape a cell’s protein repertoire. Recent work focusing on the emergent properties of the cross-talk networks has emphasized the high flexibility and selectivity that may be achieved at stationarity. On the other hand, dynamical aspects, possibly crucial on the relevant timescales, are far less clear. We have carried out a dynamical study of the ceRNA hypothesis on a model of posttranscriptional regulation. Sensitivity analysis shows that ceRNA cross-talk is dynamically extended, i.e., it may take place on timescales shorter than those required to achieve stationarity even in cases where no cross-talk occurs in the steady state, and is possibly amplified. In addition, in the case of large, transfection-like perturbations, the system may develop a strongly nonlinear, threshold response. Finally, we show that the ceRNA effect provides a very efficient way for a cell to achieve fast positive shifts in the level of a ceRNA when necessary. These results indicate that competition for miRNAs may indeed provide an elementary mechanism to achieve system-level regulatory effects on the transcriptome over physiologically relevant timescales.
Introduction
It is now well established that a large part of the eukaryotic transcriptome consists of noncoding RNAs, including numerous species (up to several hundreds in humans) of microRNAs (miRNAs) (1). The miRNAs play a central role in posttranscriptional regulation (PTR), inasmuch as their protein-mediated binding to a messenger RNA (mRNA) results in either translational repression or mRNA degradation (2,3). However, their impact might be much more far-reaching. On the one hand, the involvement of miRNAs in peculiar motifs of the transcriptional regulatory network suggests that they could actively perform noise processing (most importantly, buffering) in gene expression (4,5). On the other hand, by being able to target different mRNA species with different kinetics, they can, in principle, act as the mediators of an effective interaction between the mRNAs, such that a change in the transcription level of one mRNA can result in an alteration of the levels of another mRNA (6). The so-called competitive endogenous RNA (ceRNA) hypothesis has attracted considerable attention lately (7). According to it, in any given cell type, the protein repertoire is effectively influenced by the levels of the different miRNA species, in ways that depend 1), on the a priori possible couplings between miRNAs and mRNAs (the miR program), and 2), on the kinetics that governs the different interactions. In such a scenario, significant shifts in the protein composition of a cell can be obtained by altering the level of a small number of miRNA species. This mechanism is now believed to play an important role in many biological processes, from cell differentiation to cancer (8–10).
Placing the intuitive appeal of the ceRNA hypothesis on firm quantitative grounds is an important open challenge. In particular, one would like to understand which kinetic parameters control the emergence of the effective cross-talk between mRNAs and what type of effective interaction networks may result from such a simple titration mechanism. Recently, different theories have been proposed that attempt to answer these questions at steady state (11,12). The key results of this kind of approaches lie, in our view, in the emergence of selectivity: at any given level of miRNAs, only a (potentially) small number of effective couplings between mRNAs can be active, and by changing the levels of miRNAs, the structure of the network of effective couplings can be modified. This confers upon miRNA-mediated regulation a remarkable flexibility and regulatory power. Still, questions about the validity of the steady-state assumption arise, as it is well known that, for instance, in processes like cell differentiation, molecular levels are not stationary. It is therefore very important to understand the following:
-
1.
What the typical timescales are, over which the steady-state scenario is established;
-
2.
Whether steady-state like phenomenology may be observed during transients; and
-
3.
Which kinetic parameters control timescales and responses away from the steady state.
To gain a quantitative understanding of these issues, we extend here the study of the model of PTR introduced in Figliuzzi et al. (11) by characterizing the transient response of the system to perturbations, i.e., to changes in the RNA transcription rates. We shall carry mathematical calculations as far as possible to be able to characterize the dependence on parameters in detail, resorting to simulations to sort out regimes out of our analytical reach.
In the first part of this work, we focus on small perturbations. By analyzing (in Fourier space) the linearized dynamics of a system of N ceRNAs jointly targeted by a single miRNA species, we recover the cross-talk scenario obtained in Figliuzzi et al. (11) for the steady state, according to which effective interactions may occur only when miRNAs are partially recycled upon complex degradation (or, in other words, when the rate of stoichiometric decay of the miRNA-RNA complex is nonzero). In addition, however, we show that a significant response may dynamically occur over finite timescales even when the rate of stoichiometric complex decay is zero and miRNAs are fully recycled (i.e., when the complex degradation channel is purely catalytic). This scenario is further studied in the important limiting cases in which complex dissociation is much faster, or much slower, than complex degradation, where the relevant timescales can be characterized in detail.
The second part of this work focuses instead on large perturbations. Using numerical analysis and analytical estimations, we characterize the emergence of nonlinear response. In specific, we uncover an extended type of cross-talk (not described by linear response theory) that is activated when perturbations overcome a given threshold. We will argue that this regime may indeed be realized in experiments. Finally, relaxation times will be fully characterized.
In summary, we provide an overall dynamical characterization of the ceRNA hypothesis in the limit in which the dynamics can be described by mass-action kinetics and molecular noise can be neglected. The work is organized as follows: the case of small perturbations is dealt with in the next section, the section following that presents the analysis of the response to large perturbations, and the last section contains a discussion of results. Auxiliary results are detailed in the Supporting Material.
Results
Small perturbations: the model and its linearized dynamics
Our starting point is the model defined in Figliuzzi et al. (11). We consider a system with one miRNA species (μ) and N ceRNA species (mi, i = 1,…,N) that can form N species of complexes (ci) with the miRNA, with the following allowed processes:
Arrow superscripts and subscripts denote the corresponding rates. Note that complex decay can occur both with (rate κi, catalytic channel) and without (rate σi, stoichiometric channel) miRNA recycling. The mass-action rate equations for the above system are given by
| (1) |
Here, mi ≡ mi(t) denotes the level of species mi (and similarly for μ and ci). In the steady state, one can most notably characterize the susceptibilities
| (2) |
where [a] denotes the long-time limit as functions of [μ] and of the kinetic parameters. Generically, larger χijss values imply a larger effective cross-talk interaction between ceRNA i and ceRNA j. The interaction is mediated by the miRNA, therefore one may expect that much will depend on whether ceRNAs i and j are completely repressed (“bound”), completely unrepressed (“free”), or partially repressed (“susceptible”) by the miRNA. In rough terms, in the bound case, most ceRNAs are bound in complexes and hence are unavailable for translation; in the free case, the fraction of ceRNAs bound in complexes is small. In these regimes, the response of a ceRNA level to changes in the miRNA level is typically very small. On the other hand, in the susceptible regime, ceRNA levels depend sensibly on the miRNA level. The emergent features of cross-talk at steady state are the following (see Figliuzzi et al. (11) for details).
Selectivity
Kinetic parameters can be tuned so as to couple only a subset of ceRNAs by strong cross-talk interactions.
Directionality
In the presence of kinetic heterogeneities,
Flexibility
The topology of the effective interaction pattern among ceRNAs depends on [μ].
Relevance of stoichiometric processing
The quantity σj = 0 implies χijss = 0. However, the quantity corresponding to the steady-state susceptibility of a system without recycling for σj = 0, may remain finite, as
| (3) |
We shall now focus on the return to the steady state after a small perturbation away from it. Let
| (4) |
Upon linearizing Eq. 1, the above variables are seen to obey the equations
| (5) |
where we have introduced (small) time-dependent variations of the transcription rates, i.e.,
Such perturbations (a precise form of which will be discussed later on) mimic regulatory alterations either generated endogenously or externally, like those that are usually made in experiments, e.g., by transfection. In what follows, we shall focus on the emergent behavior of Eq. 5.
Dynamical response
Details of the analysis of Eq. 5 are reported in Analysis of the Linearized Dynamics in the Supporting Material. It turns out that, in Fourier space (where denotes the Fourier transform of a(t)), response may be quantified through the dynamical susceptibility
| (6) |
where we have separated the case σj ≠ 0 (with finite susceptibility in the steady state) from σj = 0 (with vanishing χijss but finite ) and isolated the frequency-dependent part of the dynamical susceptibility in the functions Ψij and Φij. These functions can be factorized as the product of different filters
| (7) |
| (8) |
where
| (9) |
| (10) |
| (11) |
| (12) |
and we have introduced the timescales
| (13) |
as well as the parameters
| (14) |
The quantities ρi and μ0,i play a key role (as also discussed in Figliuzzi et al. (11): if μ ≃ μ0,i (or equivalently if ρi ≃ 1), the level of ceRNA i is approximately half of what it would be in absence of the miRNA, and it is maximally susceptible to a change in the miRNA level; if μ ≪ μ0,i (or equivalently if ρi ≫ 1) instead, ceRNA i is almost fully unrepressed by the miRNA (free) and the fraction of complexes is small; if μ ≫ μ0,i (or equivalently if ρi ≪ 1), ceRNA i is almost completely repressed (bound) by the miRNA and the fraction of complexes is high. Finally, the quantity χssμμ represents the steady-state susceptibility of the miRNA level to (small) changes in its transcription rate.
Before discussing the behavior of the filters (especially Ji and D) and giving a physical interpretation, let us clarify the meaning of the different timescales. The values τ0 and τ1,i represent, respectively, the (average) lifetime of the miRNA and of ceRNA i in the absence of interactions. The values τ2,i, τ3,i, and τ4,i are related to the processing of complex ci: τ2,i is the average lifetime of complex ci before unbinding or being degraded; τ3,i represents the average time needed for complex ci to be degraded (in absence of unbinding); and τ4,i and τ5,i are, respectively, the average times required for complex ci to be degraded stoichiometrically and catalytically (in absence of all other processes). Note that τ2,i ≤ τ3,i ≤ τ4,i, whereas τ3,i ≤ τ5,i if σi = 0.
Concerning the filters, we begin by noting that Ji measures the inertia of ceRNA i in responding to a change in the level of the miRNA (see the Supporting Material). In particular, it is related to the gain
| (15) |
by Ji(ω) = giμ(ω)/giμ (0), so that when Ji ≃ 1, ceRNA i is instantaneously at equilibrium with the miRNA. Furthermore, we can rewrite it as
| (16) |
where
| (17) |
with
| (18) |
As shown in Figliuzzi et al. (11), ceRNA i is in the bound regime at steady state when ρi ≪ 1 (i.e., when the miRNA level is much larger than a ceRNA-dependent threshold), whereas it is free and hence fully available for translation when ρi ≫ 1. In these limits, the above expression for Ji simplifies as
| (19) |
Note that Ji can be >1 at intermediate frequencies, implying that the ceRNA response to a variation of the miRNA level can be transiently amplified with respect to the corresponding steady-state response (giμ(ω) > giμ(0)).
Filter D is a common prefactor in the expressions of the different susceptibilities (i.e., it does not depend on the specific pair of ceRNAs considered), and is strongly dependent on the miRNA decay timescale τ0. Note that D and Ji values are low-pass filters, Ci values are high-pass filters, and Si values allow for transmissions at any frequency (but preferentially transmit high frequencies), because
| (20) |
| (21) |
| (22) |
| (23) |
The complete absence of stoichiometric processing (and hence full miRNA recycling) strongly affects the dynamical behavior of the system: indeed, different filters (Ci for completely catalytic, Si for at least partially stoichiometric processing) describe the two situations.
One can now see that the steady-state cross-talk scenario is recovered in the limit ω → 0. Indeed, Cj(0) = 0, in the absence of stoichiometric decay (σj = 0). at steady state. Cross-talk is possible only when σj ≠ 0, in agreement with Figliuzzi et al. (11). Away from the steady state, however, the situation changes. In particular, the dynamical susceptibility (6), in the case of completely catalytic degradation (σj = 0), contains both low- and high-pass filters. As a consequence, we expect that in this case it will be possible for the system to transmit a signal at intermediate frequencies, i.e., to observe a response on intermediate timescales.
Timescale separation: limiting cases
Unfortunately, little is known about the kinetics of RNA interference. Studies on association kinetics between RNAs in prokaryotic systems indicate that complexes (formed, in that case, by mRNAs and small RNAs) might dissociate into their original components with rates ki− ranging from 10−2 s−1 to 10−1 s−1 higher than the processing rates σi and κi of the complex (13,14). On the other hand, analysis of RNA interference in eukaryotes suggest that the kinetics can vary substantially across different targets, and that it is strongly affected by the degree of complementarity (15). In the absence of more-precise information, we shall focus on the limiting behavior in two cases, namely those of slow (k−i ≪ κi + σi) and fast (k−i ≫ κi + σi) complex dissociation. The remaining parameters used in the following numerical studies are set to biologically reasonable values falling inside the ranges considered in Haley and Zamore (15), Alon (16), and Wang et al. (17), and are measured in units of typical RNA half-life (τ ≃ 104 s) and typical RNA concentration (γ ≃ 1 nM). In these units, di ≃ δ ≃ τ, bi ≃ γτ−1, ki+ ranges from γ−1τ−1 to 10γ−1τ−1, and κi ranges from τ−1 to 10τ−1.
Slow complex dissociation
In the limit ki− ≪ κi + σi, complex formation is far from equilibrium at steady state (in favor of association). Moreover, τ2,i ≃ τ3,i, so that Bi(ω) ≃ 1 at any frequency. Therefore, Ji(ω) behaves as a simple low-pass filter, i.e.,
| (24) |
where
| (25) |
Note that
| (26) |
Hence the cutoff frequency depends on ρi and it is shifted toward high frequencies when ceRNAs are bound (ρi ≪ 1). Following Figliuzzi et al. (11), we will call susceptible the ceRNAs such that ρi ≃ 1.
Fig. 1 shows the dynamical response for pairs of free, susceptible, and bound ceRNAs in the slow dissociation limit (we considered irreversible binding, i.e., k−i = 0 ∀i). The highest values of the global filter Φij(ω) = D(ω)Cj(ω)Ji(ω)Jj(ω) (see Cesana et al. (8)) are achieved between pairs of bound ceRNAs, when ω ≃ 1.
Figure 1.
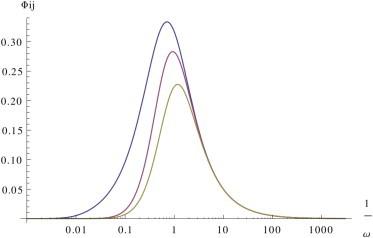
Slow dissociation, fast processing. Dynamical response for slow complex dissociation in a fully catalytic system (σi = 0, κi = 10) for pairs of free (ρi = 100, in yellow), susceptible (ρi = 1, in red), and bound (ρi = 0.01, in blue) ceRNAs. Remaining parameters are set as follows: di = 1, k−i = 0, δ = 1, and bi = 1 for each i. To see this figure in color, go online.
Fig. S1 in the Supporting Material shows the susceptibility χij(ω): note that at high frequencies, cross-talk between bound ceRNAs is stronger than that between free ceRNAs.
If κi < di, miRNA-mediated ceRNA degradation is slower than spontaneous decay, so that miRNAs are typically sequestered in complexes for very long times and we expect to recover a cross-talk scenario even for a fully catalytic system with σi = 0 (for which no cross-talk may occur at steady state). Indeed,
| (27) |
Fig. 2 shows that in case of slow catalytic processing, we recover the stoichiometric steady-state scenario for intermediate frequencies: in the frequency window between ω ≃ d1 = 1 and ω ≃ κi, the global filter Φij is close to 1. Correspondingly, , as shown in Fig. S2.
Figure 2.
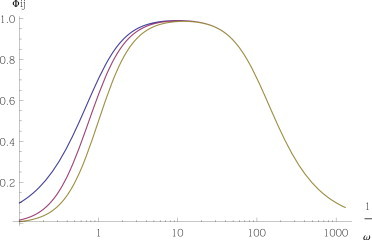
Slow dissociation, slow processing. Dynamical response in a fully catalytic system (σi = 0, κi = 0.01) for a couple of free ceRNA (ρi = 100, in yellow), for a couple of susceptible ceRNA (ρi = 1, in red), and for a couple of bound ceRNA (ρi = 0.01, in blue). Other parameters are set as follows: di = 1, k−i = 0, δ = 1, and bi = 1 for each i. To see this figure in color, go online.
Fast complex dissociation
In this case, the levels of complexes are close to equilibrium at steady state, while τ3,i ≫ τ2,i ≃ 1/ki−, so that
| (28) |
At low enough frequencies (ω ≪ ki−), Bi(ω) ≃ 1, and we recover the slow complex dissociation scenario, whereas for high enough frequencies (ω ≫ κi + σi), Bi(ω) ≪ 1, and, as before, Ji can be expressed as a simple low-pass filter,
| (29) |
with
| (30) |
So we see that, in this case, we have both a regime-dependent cutoff frequency (as in the case of slow unbinding) and a regime-dependent modulation that amplifies ceRNAs cross-talk. Fig. 3 and Fig. S3 show that indeed the dynamical response scenario for fast dissociation is similar to the one obtained for slow dissociation, except at high frequencies, where the cross-talk between free ceRNAs is stronger than the cross-talk between bound species.
Figure 3.
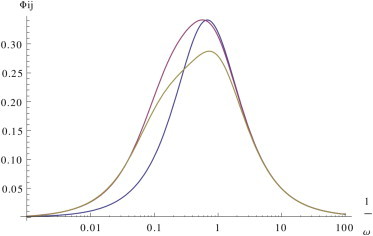
Fast dissociation, slow processing. Dynamical response for fast complex dissociation in a fully catalytic system (σi = 0, κi = 10) for pairs of free (ρi = 100, in yellow), susceptible (ρi = 1, in red), and bound ceRNAs (ρi = 0.01, in blue). Other parameters are set as follows: di = 1, k−i = 1000, δ = 1, and bi = 1 for each i. To see this figure in color, go online.
Note that if the processing of complexes is slower than spontaneous degradation, i.e., if τ5,i > τ1,ieff, then cross-talk can be dynamically amplified. Indeed, taking the expression from Eq. 19 for bound ceRNAs (ρi ≪ 1), we observe that
| (31) |
which exceeds for κi < ω < di/(ρiαi). To have a direct comparison with the steady-state scenario, we have considered the case of a fully stoichiometric system: Fig. 4 shows that, in case of slow processing (slower than spontaneous decay), dynamical cross-talk (quantified in this case by the filter Ψij(ω)) is stronger than the stoichiometric steady-state counterpart (i.e., Ψij(ω) > 1), particularly for susceptible and free species. Dynamical susceptibilities χij(ω) for the same choice of kinetic parameters are again shown in Fig. S4.
Figure 4.
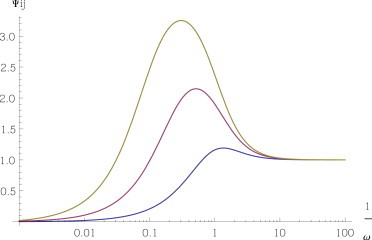
Fast dissociation, fast processing. Dynamical response for fast complex dissociation in a fully stoichiometric system (σi = 0.5, κi = 0) for pairs of free (ρi = 100, in yellow), susceptible (ρi = 1, in red), and bound (ρi = 0.01, in blue) ceRNAs. Other parameters are set as follows: di = 1, k−i = 1000, δ = 1, and bi = 1 for each i. To see this figure in color, go online.
We have also considered the case of mixed stoichiometric-catalytic systems (see Fig. S5). At intermediate timescales, the dynamical features in the limiting cases discussed above are qualitatively preserved, irrespective of the proportion of stoichiometric and catalytic processing. On the other hand, in the small frequency limit, as expected, the response is gradually depleted as the degree of catalytic processing increases, and vanishes for completely catalytic systems.
Large perturbations
When perturbations that bring the system away from the steady state are sufficiently large, deviations from the linear response scenario occur. The characterization of these phenomena are especially important in understanding the experiments, because transcriptional perturbations are normally carried out by transfections that increase levels by several folds, and it is upon them that we shall focus in this section. In particular, we will show (numerically) that under large perturbations, the following is important:
-
1.
The response can be highly nonlinear;
-
2.
Cross-talk is extended, in that it may take place between pairs of ceRNAs that would not interact otherwise; and
-
3.
There exists a threshold perturbation for activating such an extended cross-talk.
In addition, the response to large perturbations appears to be characterized by saturation effects as well as by characteristic times increasing linearly with the perturbation.
We shall consider a particular kind of perturbation, namely a steplike transcriptional input that modifies the transcription rate of a given ceRNA at time t = t0, defined by
| (32) |
where θ(x) is the Heavyside step function and Δi measures the fold change in the transcription rate of ceRNA i after time t0. A perturbation with Δi > 0 mimics a sudden signal that saturates the promoter at t = t0, the transcription rate switching from bi (corresponding to a basal transcription rate) to bi + Δbi; conversely Δi < 0 mimics the opposite condition of a sudden drop of the activating signal at t = t0, the transcription rate dropping from its initial value bi to bi − Δbi (transcription being completely switched off for Δi = −1). We will focus the analysis on completely catalytic systems (σi = 0 for all i), for which we have seen in the previous section that ceRNA cross-talk is activated for a finite time interval. To quantify the response of the system, we shall resort to
| (33) |
which depends both on the size of the response and on its duration; IR indicates integrated response. If only free mRNA molecules are translated into protein (at a constant rate), Eq. 33 is strictly related to the total amount of protein produced in response to the perturbation, i.e., to the ultimate output of the input transcriptional signal. When perturbations are large, the time needed to relax back to the steady state after a transcriptional perturbation may be long compared to cellular processes and can vary according to the specific conditions (18). We will attempt, in the case of large perturbation, to characterize such a relaxation time.
Extended cross-talk
According to the linear response theory developed in Figliuzzi et al. (11), cross-talk may take place only between susceptible ceRNAs (symmetrically, i.e., perturbing one species causes a response in the other, and vice versa) and from bound to susceptible ceRNAs (asymmetrically, i.e., perturbing a bound ceRNA a susceptible one will respond, but not vice versa). We will see here that, when the perturbation overcomes a certain threshold, cross-talk is no longer limited to the above cases.
Fig. 5 shows the integrated response of ceRNA1, after a positive perturbation Δ2 on the transcription rate of ceRNA2: strong deviations from linearity appear in the integrated response between bound ceRNAs, and if the perturbation is large enough the cross-talk between bound species can overcome that between susceptible ones. Indeed, whereas integrated response is almost linear in the perturbation size for ceRNAs in the free and in the susceptible regimes, it is strongly nonlinear in the case of bound ceRNAs, specifically when the perturbation overcomes a given threshold (in this case, Δ2 ≃ 4). The same effect is also evident in Fig. 6.
Figure 5.
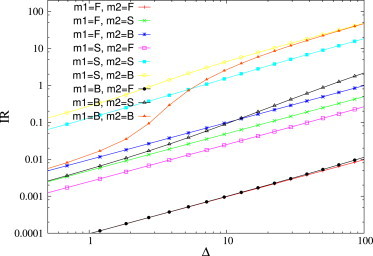
Integrated response as a function of the perturbation size. ceRNAs have different binding rates so that they can be in the free (F), susceptible (S), or bound (B) regime, according to the legend. Binding rates are: k+ = 10−2 for free ceRNAs, one for susceptible ceRNAs, and 102 for bound ceRNAs. Remaining kinetic parameters are as follows: b1 = b2 = β = 1, …, k−1 = k−2 = 0, and κ1 = κ2 = 1. To see this figure in color, go online.
Figure 6.
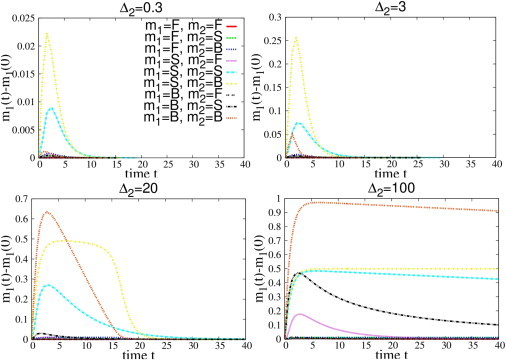
Dynamical evolution of ceRNA 1 (Δmi(t) = m1(t) – m1(0)) after a positive transcriptional perturbation Δ2 of ceRNA 2 at t = 0. ceRNAs have different binding rates so that they can be in the free (F), susceptible (S), or bound (B) regime. (Top plot) Here, only the B-S and S-S cross-talk is activated; (bottom plots, where the perturbation is above the threshold) B-B coupling has switched on. To see this figure in color, go online.
Deviations from linear response behavior occur also in the case of negative perturbations (reductions of the transcription rates), as shown in Fig. 7, where the transcription rate of ceRNA 2 is set to zero for t > 0, i.e., Δ2 = −1. If the transcription rate b2 before the perturbation is sufficiently large, cross-talk between susceptible ceRNAs increases slowly whereas the response by free ceRNAs increases. Fig. 8 shows that the levels of free species are sensibly depleted over a finite time window.
Figure 7.
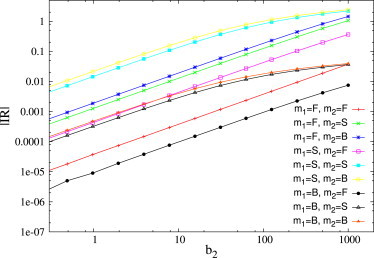
Absolute values of integrated response as a function of the perturbation size. ceRNAs have different binding rates so that they can be in the free (F), susceptible (S), or bound (B) regime. Binding rates are: k+ = 10−2 for free ceRNAs, 1 for susceptible ceRNAs, and 102 for bound ceRNAs. Remaining kinetic parameters are as follows: b1 = β = 1, d1 = d2 = 1, δ = 0.5, k−1 = k−2 = 0, and κ1 = κ2 = 1. To see this figure in color, go online.
Figure 8.
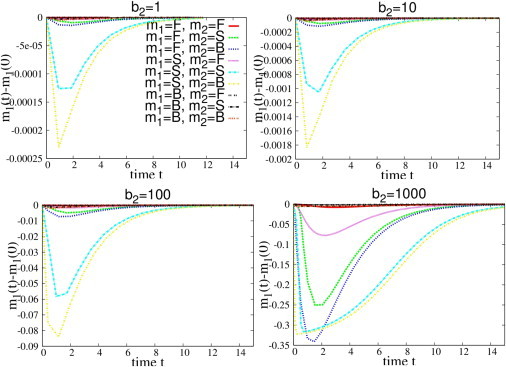
Dynamical evolution of ceRNA 1 (Δm1(t) = m1(t) – m1(0)), after a transcriptional perturbation Δ2 of ceRNA 2 at t = 0. ceRNAs have different binding rates so that they can be in the free (F), susceptible (S), or bound (B) regime. Note that for small negative perturbations (top left plot) a significant response is achieved only for the S-S and the S-B pairs. Upon increasing the perturbation size, F-F cross-talk is activated, as are the S-F, F-S, and F-B interactions. To see this figure in color, go online.
Quite remarkably, however (see Fig. 9), selectivity is preserved also in the case of large perturbations: cross-talk is activated only among a subset of ceRNAs, those whose binding kinetics lies in a finite window that depends on the perturbation size and on miRNA level. Others ceRNAs are almost unaffected by the perturbation.
Figure 9.
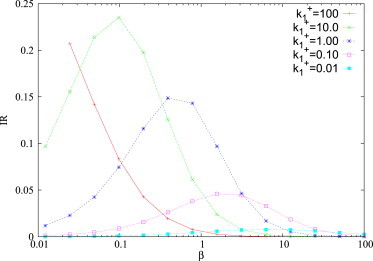
Integrated response integrated response of ceRNA 1 as a function of the miRNA transcription rate β. Remaining kinetic parameters are fixed as following: b1 = β = 1, b2 = 1, d1 = d2 = δ = 1, k−1 = k−2 = 0, κ1 = κ2 = 1, k2+ = 1, and Δ = 2. To see this figure in color, go online.
Threshold perturbation and saturation phenomena
We have just seen that cross-talk between bound ceRNAs follows a threshold behavior: if the perturbation is small, the response δmi grows linearly with the perturbation, according to δmi = χijδbj, where χij is small as predicted by linear response theory; if, however, the perturbation overcomes a given threshold Δth, linear response theory breaks down and nonlinear effects become important. Upon increasing further the perturbation, the integrated response returns to a linear behavior, due to saturation effects. Intuitively, after a large positive perturbation that shifts the level of a ceRNA up, miRNAs are temporarily completely sequestered and other ceRNAs become completely free. Hence, Δmi saturates to the maximal value, as shown in the bottom-right panel of Fig. 6. Accordingly, the relaxation time (which depends weakly on the perturbation size in the linear response regime) increases linearly with the perturbation when Δj > Δth.
An estimate of the relaxation times after large, saturating perturbation can be worked out in the case of a kinetically homogeneous system (i.e., one in which binding kinetics is the same for all ceRNAs), assuming that ceRNAs and miRNAs are at equilibrium with respect to the instantaneous values of the levels of the complexes. One finds (see Estimate of the Relaxation Time Following a Large, Saturating Perturbation in the Supporting Material for details)
| (34) |
Hence, when Δ is very large, relaxation times τ decrease upon increasing either the catalytic processing speed κ or the miRNA transcription rate β. This is consistent with the numerical results shown in Fig. 10 and in Fig. S7.
Figure 10.
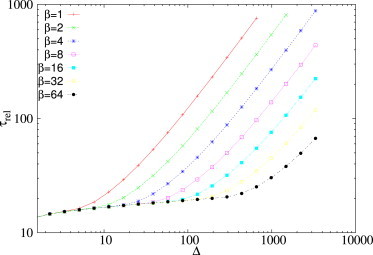
Relaxation time τrel as a function of the size of the perturbation, for different values of the rate of the miRNA transcription rate β. Remaining kinetic parameters are as follows: b1 = β = 1, b2 = 1, d1 = d2 = δ = 1, k+1 = k+2 = 100, and k−1 = k−2 = 0. To see this figure in color, go online.
Note also (see Fig. 11 and Fig. S6) that not only relaxation times, but also the value of the threshold Δth, appear to shift upon varying β and κ.
Figure 11.
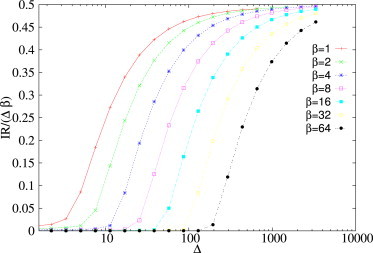
Integrated response between bound ceRNAs as a function of the perturbation size Δ, for different miRNA transcription rates β. Remaining kinetic parameters are as follows: b1 = b2 = 1, b2 = 1, d1 = d2 = δ = 1, k−1 = k−2 = 0, κ1 = κ2 = 1, and k1+ = k2+ = 100. To see this figure in color, go online.
Responsiveness and amplification
Velocity in changing molecular levels in response to a perturbation (what we shall call “responsiveness” here) can be a desirable feature in cells: for instance, differentiation processes typically need rapid shifts in the levels of specific molecules. The ease of synthesis of small RNA molecules may be beneficial for quick response/adaptation to environmental stress (19), and it has been quantitatively shown that posttranscriptional regulation (PTR) is advantageous precisely when fast responses to external signals are required (20). We are here in the position to compare the properties of transcriptional regulation by perturbation of transcription rate of a given gene to those of direct PTR by perturbation of miRNA transcription rates and indirect PTR by perturbation of the transcription rate of a competitor of the gene. Our goal is to quantify the differences between the three regulation modes, to pin down the situations when regulating through the ceRNA effect can be more effective.
Fig. 12 shows that switching off the transcription of a miRNA may not be the fastest way to increase the level of a transcript (m1 in this case). It takes some time for miRNA to be eliminated. On the other hand, turning on the transcription of the gene in absence of miRNAs or increasing the transcription of a ceRNA by several folds both result in rapid increase of the level of the gene.
Figure 12.
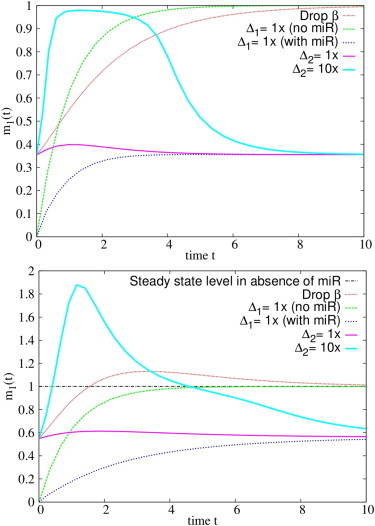
Time evolution of m1 after different kinds of perturbations. The comparison is carried out in the case of fast complex processing (top panel, κ = 1) and slow complex processing (bottom panel, κ = 0.2). Different perturbations are indicated as follows: Drop β, miRNA transcription rate β set to zero at t > 0; Δ1 = 1× (no miR), activation of transcription of the gene with b1 = 1 at t > 0 in the absence of miR; Δ1 = 1× (with miR), activation of transcription of the gene with b1 = 1 at t > 0 in the presence of miRNA; Δ2 = 1×, activation of transcription of the ceRNA with b1 = 1 at t > 0; and Δ2 = 10×, activation of transcription of the ceRNA with b2 = 10 at t > 0. Remaining parameters are as follows: k− = 0, b1 = 1, β = 2, d1 = d2 = δ = 1, k− = 10, k1+ = 10, and k2+ = 1000. To see this figure in color, go online.
Interestingly, if complexes are close to equilibrium and their lifetime is longer than that of free molecules, i.e., if the conditions for cross-talk amplification are met, a sudden increase of the transcription rate of a ceRNA may temporarily bring the level of the gene above the steady-state value in the absence of miRNA (see bottom panel in Fig. 12). This effect is due to the massive release of free molecules from the dissociation of a large number of complexes ci right after the perturbation, and it is more pronounced if the affinity of the ceRNA is higher than that of the gene (k2+ > k1+), as in the case considered in Fig. 12. On the other hand, in Fig. 13 it is shown that the fastest way to reduce the expression level of a gene is to turn on the transcription rate of the miRNA; decreasing either the transcription rate of the gene or that of a competitor seems to imply a slower response.
Figure 13.
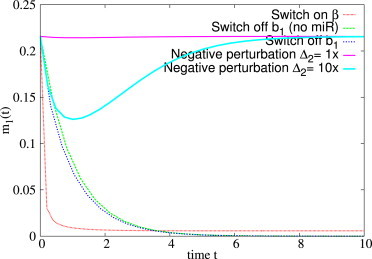
Gene silencing, with time evolution of m1 after different kinds of perturbations. Legends are as follows: Switch on β, miRNA transcription rate β activated at t > 0; Switch off b1 (no miR), block the transcription of gene 1 at t > 0 in absence of miRNA; Switch off b1, block the transcription of gene 1 at t > 0 in the presence of miRNA; negative perturbation Δ2 = 1×, block transcription of the ceRNA 2 with b2 = 1 at t > 0; and negative perturbation Δ2 = 10×, block transcription of ceRNA 2 with b2 = 10 at t > 0. Remaining parameters are as follows: b1 = 1, β = 4, d1 = d2 = δ = 1, k−1 = 10, k−1 = 10, k1+ = 10, k2+ = 1000, and κ = 1. To see this figure in color, go online.
Discussion
Considering the timescales involved, it is clear that dynamical effects may play an important role in PTR. Quantifying their relevance in comparison to steady-state phenomenology may, on the one hand, help to interpret experimental results, and on the other hand, provide an overall understanding of the competition mechanism by which cells may achieve selective control of PTR through miRNAs. We have extended here the steady-state analysis of the miRNA-ceRNA interaction network by studying the dynamics and response of a system of posttranscriptionally regulated RNAs, focusing on the linearized dynamics in the limit of small perturbations, and on numerical analysis in the case of large perturbations.
Our results can be summarized as follows. Although a steady-state cross-talk scenario requires that miRNA-ceRNA complexes decay, at least partially, through a stoichiometric channel of degradation (11), cross-talk can be effective even in the complete absence of stoichiometric processing if the system is away from stationarity. Quite importantly, cross-talk can be dynamically amplified when the processing of miRNA-ceRNA complexes is slower than spontaneous ceRNA degradation: in this situation, the dynamical response may even overcome the steady-state response (on sufficiently short timescales) with fully stoichiometric complex processing. Therefore, the emergent cross-talk scenario found in Figliuzzi et al. (11) at the steady state occurs, and is possibly enhanced, even in transients.
On the other hand, the response to large perturbations can be strongly nonlinear, and a kind of extended cross-talk appears above a specific threshold perturbation: in this situation, not only can susceptible-susceptible and susceptible-bound ceRNA pairs interact, but other pairs of ceRNA may also effectively interact. Most notably, bound-bound and free-free ceRNA pairs may cross-talk in transients. When the perturbation is particularly large, the system saturates, because relaxation times increase linearly with the perturbation size. The size of the transcriptional perturbation ultimately determines the width of the time window for which cross-talk is active.
Finally, we have shown that the ceRNA effect provides a mechanism by which a cell may achieve fast positive shifts in the level of a ceRNA, when necessary. Obtaining rapid negative shifts in the same way is less efficient, because the fastest decrease in RNA levels is obtained by increasing the level of the miRNA.
It is worth remarking that a major feature of the steady-state scenario, namely the emergence of selectivity, is fully preserved dynamically, so that target specificity in the ceRNA cross-talk network is ensured even away from the steady state. Likewise, by the ceRNA effect one may obtain different cross-talk networks upon changing the miRNA levels, suggesting that the so-called miR program may be a viable and effective mechanism to regulate the transcriptome composition on physiological timescales.
A dynamical simulation study of the same scenario for miRNA-mediated regulation has been carried out in Bosia et al. (21). In accordance with our analytical results, the ceRNA effect was found to be transiently possible in the case of catalytic miRNA-target interaction. The response time to activating and deactivating transcriptional signals has also been characterized, showing anomalous dynamical features when the ceRNAs are close to the susceptible regime. In addition to this, the small-scale model discussed here (two ceRNAs, one miRNA) gives many clues about the regulatory potential of the ceRNA effect. Still, it would be important to explore this scenario on a large-scale miRNA-ceRNA network, where topological as well as kinetic ingredients may provide further insight into why PTR by small RNAs is so ubiquitous.
In addition, it should always be kept in mind that signaling in this context can be limited by noise (22,23). It has been shown that the noise profiles of microRNA-regulated genes are almost identical in the case of stoichiometric and catalytic complex processing (21,24). This suggests that dynamical considerations are crucial to further understanding of how noise processing may be performed during PTR. Further work on the emergence and properties of ceRNA cross-talk networks may therefore prove to yield deeper insights on a number of key issues for transcriptome and proteome regulation.
Acknowledgments
We thank I. Bozzoni, M. Marsili, A. Martirosyan, A. Pagnani, and A. Tramontano for stimulating discussions.
M.F. acknowledges the CALSIMLAB for the last part of this work, supported by public grant No. ANR-11-LABX-0037-01, overseen by the French National Research Agency (ANR) as part of the ”Investissements d’Avenir” program (reference No. ANR-11-IDEX-0004-02).
Footnotes
Andrea De Martino and Enzo Marinari contributed equally to this article.
Supporting Material
References
- 1.Chekulaeva M., Filipowicz W. Mechanisms of miRNA-mediated post-transcriptional regulation in animal cells. Curr. Opin. Cell Biol. 2009;21:452–460. doi: 10.1016/j.ceb.2009.04.009. [DOI] [PubMed] [Google Scholar]
- 2.Valencia-Sanchez M.A., Liu J., Parker R. Control of translation and mRNA degradation by miRNAs and siRNAs. Genes Dev. 2006;20:515–524. doi: 10.1101/gad.1399806. [DOI] [PubMed] [Google Scholar]
- 3.Bartel D.P. MicroRNAs: genomics, biogenesis, mechanism, and function. Cell. 2004;116:281–297. doi: 10.1016/s0092-8674(04)00045-5. [DOI] [PubMed] [Google Scholar]
- 4.Tsang J., Zhu J., van Oudenaarden A. MicroRNA-mediated feedback and feedforward loops are recurrent network motifs in mammals. Mol. Cell. 2007;26:753–767. doi: 10.1016/j.molcel.2007.05.018. [DOI] [PMC free article] [PubMed] [Google Scholar]
- 5.Osella M., Bosia C., Caselle M. The role of incoherent microRNA-mediated feedforward loops in noise buffering. PLOS Comput. Biol. 2011;7:e1001101. doi: 10.1371/journal.pcbi.1001101. [DOI] [PMC free article] [PubMed] [Google Scholar]
- 6.Arvey A., Larsson E., Marks D.S. Target mRNA abundance dilutes microRNA and siRNA activity. Mol. Syst. Biol. 2010;6:363. doi: 10.1038/msb.2010.24. [DOI] [PMC free article] [PubMed] [Google Scholar]
- 7.Salmena L., Poliseno L., Pandolfi P.P. A ceRNA hypothesis: the Rosetta Stone of a hidden RNA language? Cell. 2011;146:353–358. doi: 10.1016/j.cell.2011.07.014. [DOI] [PMC free article] [PubMed] [Google Scholar]
- 8.Cesana M., Cacchiarelli D., Bozzoni I. A long noncoding RNA controls muscle differentiation by functioning as a competing endogenous RNA. Cell. 2011;147:358–369. doi: 10.1016/j.cell.2011.09.028. [DOI] [PMC free article] [PubMed] [Google Scholar]
- 9.Karreth F.A., Tay Y., Pandolfi P.P. In vivo identification of tumor- suppressive PTEN ceRNAs in an oncogenic BRAF-induced mouse model of melanoma. Cell. 2011;147:382–395. doi: 10.1016/j.cell.2011.09.032. [DOI] [PMC free article] [PubMed] [Google Scholar]
- 10.Tay Y., Kats L., Pandolfi P.P. Coding-independent regulation of the tumor suppressor PTEN by competing endogenous mRNAs. Cell. 2011;147:344–357. doi: 10.1016/j.cell.2011.09.029. [DOI] [PMC free article] [PubMed] [Google Scholar]
- 11.Figliuzzi M., Marinari E., De Martino A. MicroRNAs as a selective channel of communication between competing RNAs: a steady-state theory. Biophys. J. 2013;104:1203–1213. doi: 10.1016/j.bpj.2013.01.012. [DOI] [PMC free article] [PubMed] [Google Scholar]
- 12.Ala U., Karreth F.A., Pandolfi P.P. Integrated transcriptional and competitive endogenous RNA networks are cross-regulated in permissive molecular environments. Proc. Natl. Acad. Sci. USA. 2013;110:7154–7159. doi: 10.1073/pnas.1222509110. [DOI] [PMC free article] [PubMed] [Google Scholar]
- 13.Argaman L., Altuvia S. fhlA repression by OxyS RNA: kissing complex formation at two sites results in a stable antisense-target RNA complex. J. Mol. Biol. 2000;300:1101–1112. doi: 10.1006/jmbi.2000.3942. [DOI] [PubMed] [Google Scholar]
- 14.Wagner E.G., Altuvia S., Romby P. Antisense RNAs in bacteria and their genetic elements. Adv. Genet. 2002;46:361–398. doi: 10.1016/s0065-2660(02)46013-0. [DOI] [PubMed] [Google Scholar]
- 15.Haley B., Zamore P.D. Kinetic analysis of the RNAi enzyme complex. Nat. Struct. Mol. Biol. 2004;11:599–606. doi: 10.1038/nsmb780. [DOI] [PubMed] [Google Scholar]
- 16.Alon U. CRC Press; Boca Raton, FL: 2007. Introduction to Systems Biology: Design Principles of Biological Networks. [Google Scholar]
- 17.Wang X., Li Y., Wang Y.-H. Toward a system-level understanding of microRNA pathway via mathematical modeling. Biosystems. 2010;100:31–38. doi: 10.1016/j.biosystems.2009.12.005. [DOI] [PubMed] [Google Scholar]
- 18.Morris K.V., Chan S.W., Looney D.J. Small interfering RNA-induced transcriptional gene silencing in human cells. Science. 2004;305:1289–1292. doi: 10.1126/science.1101372. [DOI] [PubMed] [Google Scholar]
- 19.Altuvia S., Wagner E.G. Switching on and off with RNA. Proc. Natl. Acad. Sci. USA. 2000;97:9824–9826. doi: 10.1073/pnas.97.18.9824. [DOI] [PMC free article] [PubMed] [Google Scholar]
- 20.Shimoni Y., Friedlander G., Margalit H. Regulation of gene expression by small non-coding RNAs: a quantitative view. Mol. Syst. Biol. 2007;3:138. doi: 10.1038/msb4100181. [DOI] [PMC free article] [PubMed] [Google Scholar]
- 21.Bosia C., Pagnani A., Zecchina R. Modeling competing endogenous RNA networks. PLoS ONE. 2013;8:e66609. doi: 10.1371/journal.pone.0066609. [DOI] [PMC free article] [PubMed] [Google Scholar]
- 22.Detwiler P.B., Ramanathan S., Shraiman B.I. Engineering aspects of enzymatic signal transduction: photoreceptors in the retina. Biophys. J. 2000;79:2801–2817. doi: 10.1016/S0006-3495(00)76519-2. [DOI] [PMC free article] [PubMed] [Google Scholar]
- 23.Mehta P., Goyal S., Wingreen N.S. A quantitative comparison of sRNA-based and protein-based gene regulation. Mol. Syst. Biol. 2008;4:221. doi: 10.1038/msb.2008.58. [DOI] [PMC free article] [PubMed] [Google Scholar]
- 24.Noorbakhsh J., Lang A.H., Mehta P. Intrinsic noise of microRNA-regulated genes and the ceRNA hypothesis. PLoS ONE. 2013;8:e72676. doi: 10.1371/journal.pone.0072676. [DOI] [PMC free article] [PubMed] [Google Scholar]
Associated Data
This section collects any data citations, data availability statements, or supplementary materials included in this article.