Abstract
Single molecule studies of protein–nucleic acid interactions shed light on molecular mechanisms and kinetics involved in protein binding, translocation, and unwinding of DNA and RNA substrates. In this review, we provide an overview of a single molecule fluorescence method, termed “protein induced fluorescence enhancement” (PIFE). Unlike FRET where two dyes are required, PIFE employs a single dye attached to DNA or RNA to which an unlabeled protein is applied. We discuss both ensemble and single molecule studies in which PIFE was utilized.
Introduction
Single molecule Förster Resonance Energy Transfer (FRET) is widely used to probe nucleic acid–protein interactions. FRET visualization is based on the excitation of a donor fluorophore and its concomitant energy transfer to a neighboring acceptor fluorophore. The efficiency of this transfer is converted to an approximate distance between the two dyes. By singly labeling the interacting partner molecules, DNA and protein, for example with a donor and acceptor fluorophore, one can observe in real time the protein binding to its substrate and its movement along it, in the case of a motor protein. However, fluorescent tagging of proteins is inefficient, difficult, and sometimes perturbs protein function. Furthermore, proteins with a high dissociation constant, Kd, require addition of high concentration of fluorescence, hindering the detection of single molecules. The Protein Induced Fluorescence Enhancement (PIFE) assay bypasses the labeling of proteins since the fluorophore attached to the substrate serves as a reporter of the protein binding and its movement. The intensity of a fluorophore is enhanced upon binding of a protein in its vicinity. Used in the stopped-flow ensemble method and single molecule experiments, PIFE can be employed to study protein–nucleic acid interactions simply by measuring the fluorescence intensity. In this review, we will focus on the method and applications of PIFE in single molecule as well as ensemble fluorescence measurements.
Experimental setup of single molecule measurements
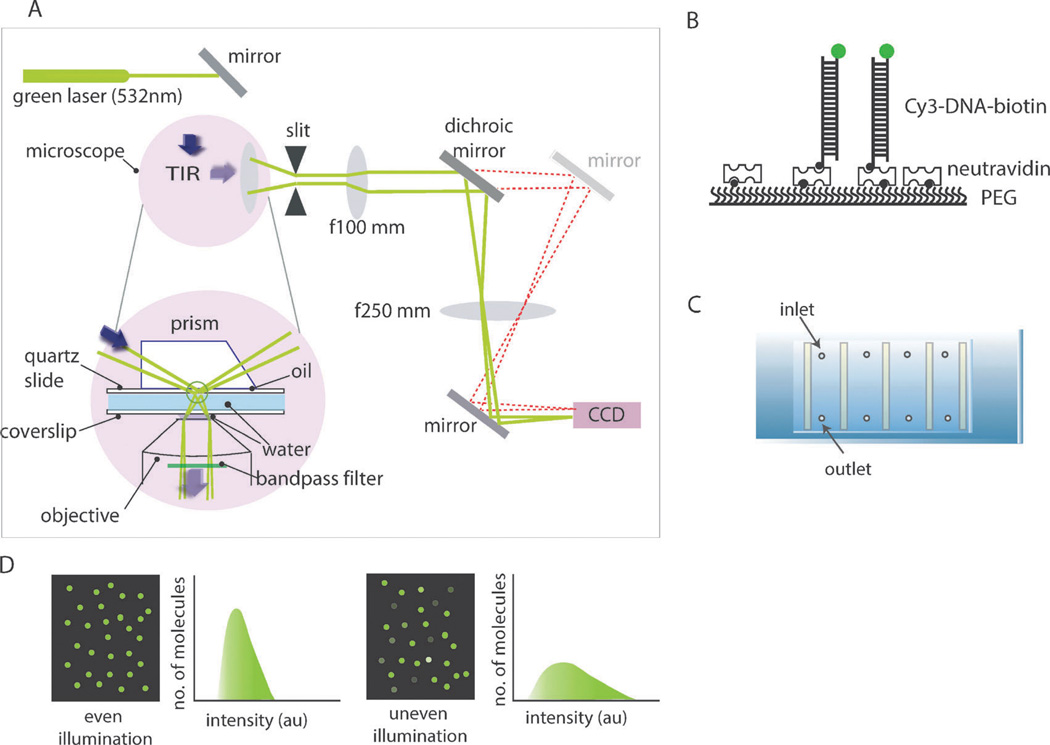
Both the prism-type and objective-type total internal reflection fluorescence (TIRF) microscope can be used for single molecule PIFE measurements (smPIFE) (Fig. 1A). The setup for smPIFE is identical to the TIRF microscope used for single molecule FRET measurements, with the exception that the dichroic beam-splitter is unnecessary. A detailed guide on building the TIRF setup has been previously published.1
Fig. 1.
(A) Schematic diagram of the prism-type total internal fluorescence microscope (TIRFM) setup. (B) Fluorescently labeled and biotinylated-DNA immobilized to a polymer (PEG)-coated surface via biotin–NeutrAvidin interactions. (C) Slide assembly with flow chambers constructed for single molecule imaging. (D) Examples of even and uneven laser illumination of the single molecule surface.
Similar to other single molecule fluorescence measurements, quartz and coverslip slides are passivated with mPEG (methoxypolyethylene glycol) to prevent non-specific binding of molecules to the surface (Fig. 1B). Approximately 1–2% of biotinylated-PEG is included in mPEG to coat the microscope slides. Once prepared, the slides can be stored at −20 or −80 °C for over one month. At the time of the measurement, the slide is assembled to create flow channels to which all aqueous sample solutions can be applied (Fig. 1C). NeutrAvidin is added to the biotin-PEG surface to prepare for “seeding” of fluorescent molecules. Next, fluorescently labeled and biotinylated DNA or RNA (50–100 pM) substrates are applied to the biotin–NeutrAvidin surface. This procedure should yield 300–600 fluorescent molecules in one field of view.2
For PIFE imaging and histogram analysis, it is crucial to achieve an even illuminated surface that renders one sharply peaked intensity profile so that the intensity change induced by protein binding can be clearly distinguished (Fig. 1D). For the same reason, one needs to cautiously monitor the intensity of DNA-only or RNA-only signals before any protein is added. If the individual traces will be normalized to the protein-unbound intensity, the intensity distribution on the imaging surface does not need to be uniform.
History and chemical basis of PIFE
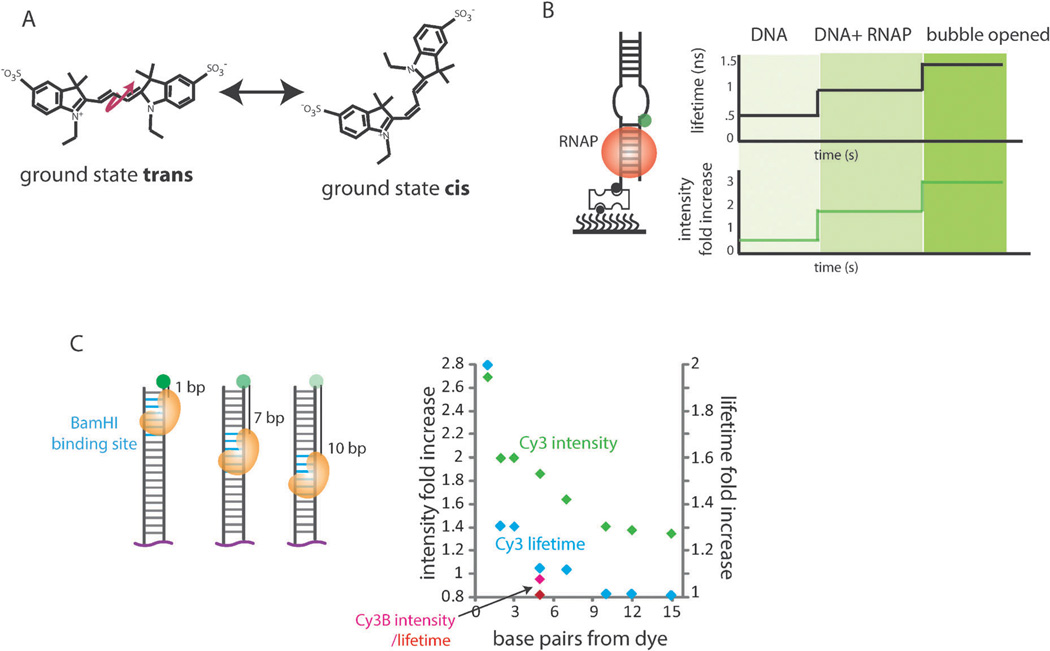
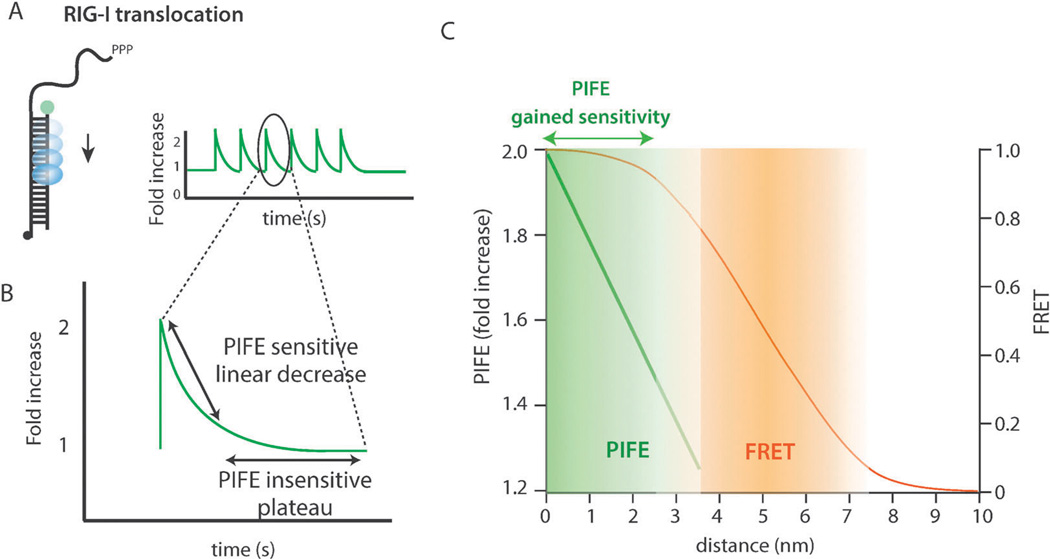
In 1984, Aramendia et al. observed through steady-state fluorescence emission and fast photolysis that quantum yield of cyanine dyes was directly proportional to the viscosity of the local environment, but inversely proportional to temperature.3 They attributed the change in fluorescence quantum yield to cis–trans isomerization of the cyanine dye from the singlet-excited state to a non-fluorescent state, which competes with the fluorescence state (Fig. 2A). This reaction involves the rotation of half of the molecule with respect to the other half which are connected through a carbon–carbon double bond. The same photophysical phenomenon has been employed in stopped-flow measurements to investigate kinetics of DNA motor proteins in Lohman’s lab (see more details in Fig. 5A – D).4–6 In 2007, Luo et al. used a method equivalent to smPIFE to study T7 DNA polymerase binding to DNA as a first demonstration that protein binding to fluorescently labeled DNA can be monitored by intensity change with single molecule resolution.4 In 2009, we reported the ATP fueled translocation activity of a human antiviral protein, RIG-I. In this study, RIG-I translocation along double stranded RNA (dsRNA) or the DNA:RNA hybrid was seen as gradual intensity increase and decrease in an ATP dependent manner.7,8 Based on the RIG-I study and a few other studies on DNA binding proteins, the distance sensitivity of smPIFE was calibrated to be within the 0 to 3 nm range.9
Fig. 2.
(A) cis–trans Isomerization of a Cy3 dye. The pink arrow indicates the rotation with respect to the carbon–carbon double bonds. (B) Schematic of T7 RNA polymerase (RNAP) binding to a duplex DNA. Lifetime and PIFE measurements for DNA alone, with RNAP, and when the DNA bubble is opened. (C) Schematic of the BamHI binding site positioned 1, 7 and 10 bp away from the Cy3 fluorophore. Intensity fold and lifetime fold increases are shown for 1–15 bp distances away from the dye.
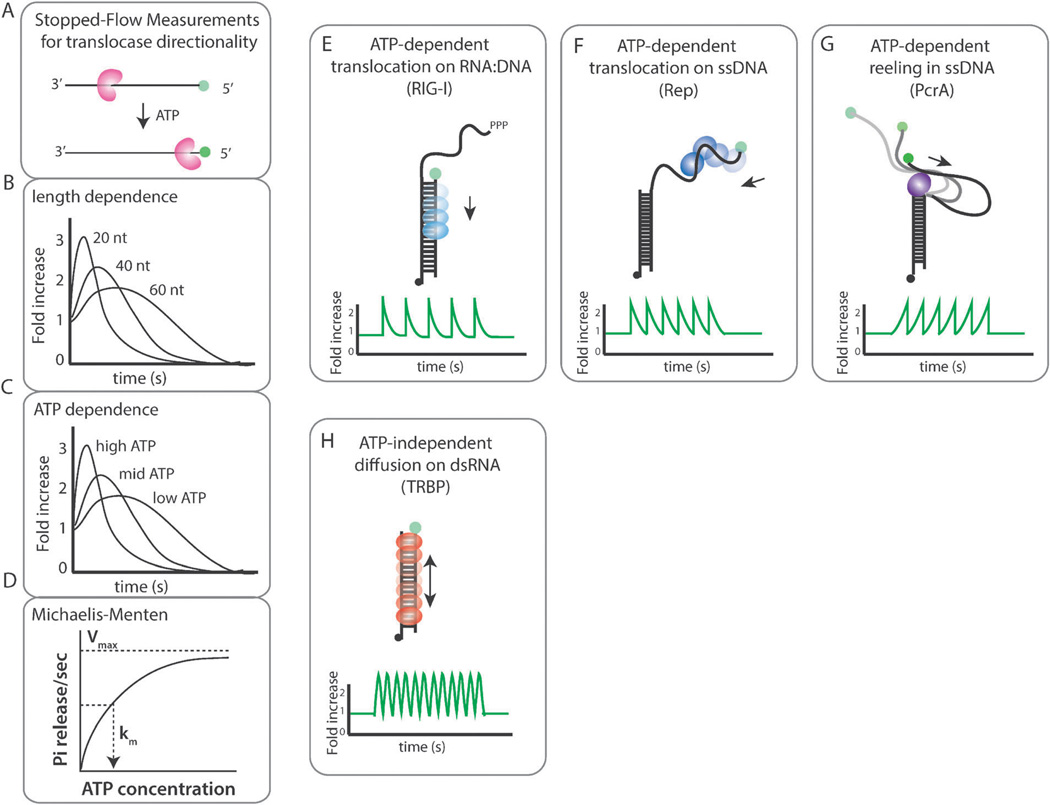
Fig. 5.
(A) Schematic for stopped-flow measurements. Substrate length (B) and ATP concentration (C) variation for stopped-flow measurements. (D) Km and Vmax can be extracted from the rate of phosphate release plotted as a function of ATP concentration. (E) smPIFE visualization of RIG-I translocation across dsRNA showing repetitive translocation. (F) smPIFE measurements of Rep translocation is consistent with repetitive shuttling. (G) smPIFE trace reflects PcrA reeling in ssDNA in repetition. (H) Fast intensity fluctuations of the smPIFE trace reflects TRBP’s diffusion along the dsRNA axis.
The cis–trans photoisomerization reaction and the resulting fluorescence intensity of the cyanine dyes depend strongly on their local molecular environment. The increase in local viscosity of a fluorophore results in enhanced fluorescence intensity.3,10,11 Similarly, the PIFE effect can arise from a protein that acts as an additional viscosity factor. In addition, as mentioned previously, the quantum yield of Cy3 depends on whether it is linked to double strand DNA (dsDNA), single strand DNA (ssDNA), or other secondary structures of DNA11 In the same way, the DNA moiety that surrounds the fluorophore may provide variable viscosity environments which influence the quantum yield and thus the brightness of the dye.
The PIFE effect is strongly correlated with the fluorescence lifetime of the dye. Using time correlated single photon counting (TCSPC) measurements, Sorokina et al. demonstrated that both the fluorescence intensity and its lifetime increased in a step-wise manner when T7 RNA polymerase binds to a fluorescently labeled DNA (Fig. 2B).12 We also reported that a restriction enzyme binding to 1–10 base pairs away from the Cy3 dye resulted in distance dependent fluorescence increase and a corresponding increase in the lifetime of the dye (Fig. 2C). In contrast, Cy3B that does not undergo cis–trans isomerization exhibits no increase in quantum yield or fluorescent lifetime.9 This further validates the cis–trans isomerization as the main chemical basis of the PIFE effect.
Cy3 has predominately been the dye of choice for PIFE and FRET experiments due to its high absorption coefficient, high photostability, and modest quantum yield.13 In addition to Cy3 dye, the PIFE effect has also been observed with several other dyes including DY547, Cy5 and Alexa dyes.9,14 In principle, if a dye has the same type of chemistry i.e. two rings interconnected by carbon–carbon double bonds that undergo cis–trans isomerization, it is expected to exhibit the PIFE effect. In FRET measurements, the PIFE can play a role in the following ways. For the high FRET scenario, the protein binding near the two dyes can enhance the intensity of both dyes without changing the FRET value. When in low FRET, if a protein approaches only one dye, this can be visualized as an intensity increase in only a single dye without the anti-correlated decrease exhibited by the other dye.
Application – determination of the protein binding constant, substrate specificity, binding position and kinetics
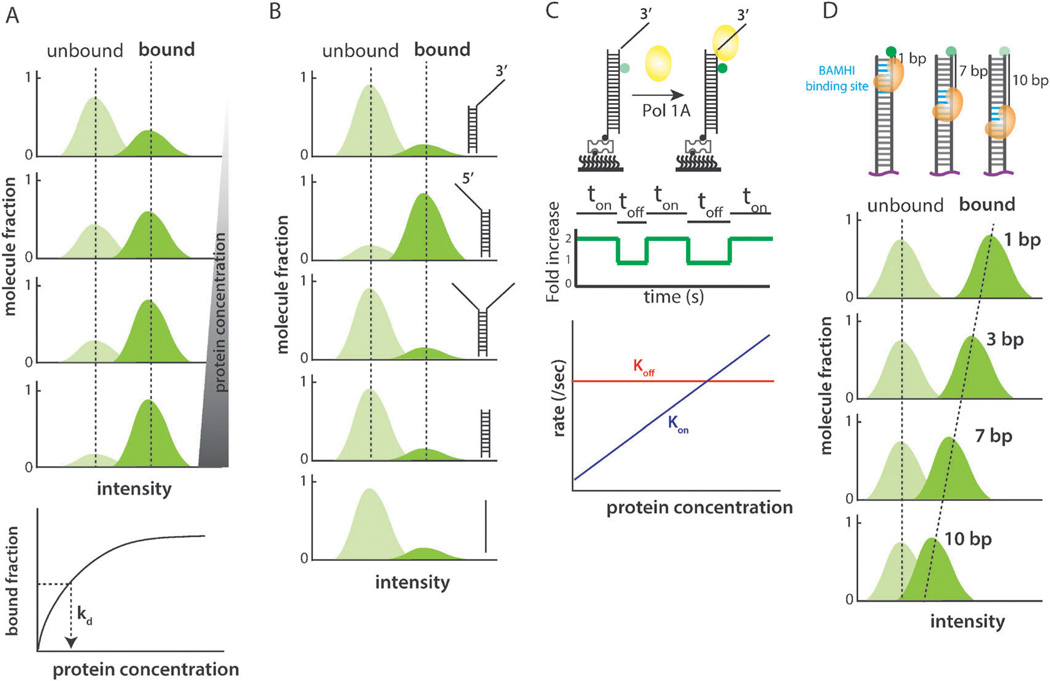
The most obvious advantage of smPIFE assay lies in its ability to monitor protein binding to a fluorescently labeled DNA or RNA without having to label the protein. It offers a relatively quick test for any purified protein that is expected to bind to nucleic acids. Once the binding is confirmed, protein concentration can be titrated to obtain the protein’s binding affinity. The fluorescence intensity histogram collected from thousands of molecules can be compared and quantified before and after the addition of the protein as long as the illumination profile of the surface remains constant (Fig. 3A). The area under the histogram peaks can be quantified to estimate the substrate bound fraction over the total (bound plus unbound) and plotted to render the Kd, or the dissociation constant of the protein. We note that the histograms for PIFE can be reconstructed after normalizing the protein bound intensity by the protein unbound intensity for individual molecules. In this regard, the constant illumination is not absolutely required for generating histograms.
Fig. 3.
(A) Fluorescence intensity histograms collected from various protein concentrations. The bound fraction plotted as a function of protein concentration to extract the dissociation constant, Kd. (B) Fluorescence intensity histograms collected for different substrates to test a given protein’s binding specificity. (C) When Pol1A binds, fluorescence intensity increases. Dwell times, ton and toff, can be collected, inversed, and plotted as rates, kon and kofif (D) Fluorescence intensity histograms can provide details on approximate binding position of a given protein.
For a protein of unknown substrate specificity, the same type of experiment and analysis can be applied to various nucleic acid substrates. For example, a helicase can be subjected to 3′ or 5′ tailed DNA (or RNA), forked substrate, and blunt ended duplex DNA (or RNA) to measure its binding preference (Fig. 3B).15 The two tests described so far are equivalent to the conventional electrophoresis mobility shift assay (EMSA), anisotropy, or surface plasmon resonance (SPR) for the most part whereas the next tests draw upon the unique advantage of smPIFE assay.
While it’s simple and straightforward to study the stably binding proteins, ensemble-based methods lose sensitivity toward the proteins that interact transiently with their substrates. The smPIFE assay is an excellent method to measure binding kinetics of short-lived interactions. The protein binding and unbinding are seen as stepwise increase and decrease in fluorescence intensity, respectively. The dwell times of bound and unbound states collected from hundreds of single molecules can be used to calculate the binding constant of a protein. Using this method, we have compared the binding constant of RIG-I and its truncation mutant (CARDless RIG-I).14 In a recent study by Markiewicz et al., Pol1A binding to internally labeled DNA was studied by smPIFE. In this study, they obtained and plotted the kon and koff as a function of protein concentration and demonstrated that only the kon is exclusively dependent on the Pol1A concentration (Fig. 3C).16
One major advantage of using PIFE over FRET is to measure binding kinetics without having issues with aberrant acceptor fluorophore photophysics. For some smFRET experiments, the unbound substrate FRET state cannot be distinguished from the substrate bound by a protein with an inactive acceptor dye (both result in zero FRET). This makes measuring binding kinetics by FRET unreliable. PIFE is often a much more accurate way to measure binding kinetics because there is no acceptor fluorophore.
Another unique feature of PIFE is its ability to distinguish protein binding in the vicinity of a fluorescent dye. Such distance sensitivity was demonstrated in our recent study where the restriction enzyme binding site was engineered at 1 to 10 base-pair (bp) distance away from the Cy3 label on dsDNA to which BamHI enzyme was applied. The resulting PIFE effect was 2.6× and 1.3× enhancement for 1 bp and 10 bp distances, respectively, with 2 to 7 bp positions showing enhancement in a distance dependent manner. Therefore, the approximate binding position of a protein relative to the dye position can be assessed by the level of PIFE (Fig. 3D). Based on more than ten proteins tested in our experience, the PIFE effect is around 2 to 2.5 fold at its maximal i.e. when the protein binds closest to a dye. One exception where the PIFE effect is much greater i.e. up to 3 to 4 fold enhancement is for the proteins that form into a filament such as RecA and Rad51.9,17 We note that the presence of a fluorescent dye attached to substrates does not perturb the protein binding or kinetics in most cases. For example, the BamHI mediated cleavage of the double stranded DNA with a fluorophore showed a rapid digestion immediately after magnesium was added to the reaction (within one minute). We observed similar rates of digestion regardless of the dye position, suggesting that the dye does not interfere with the function of BamHI.9 Many previous single molecule FRET studies also showed that the protein’s biochemical activity is preserved when dye attached substrates were used.17–21 Furthermore, it is crucial to compare the activity of the protein by using standard biochemical assays such as ATP hydrolysis, SPR, EMSA.
Distance sensitivity of PIFE
The distance sensitive range of PIFE was determined based on the restriction enzyme BamHI binding assay summarized above (Fig. 3D) and the RIG-I translocation data (Fig. 4A).9 The single molecule traces obtained in RIG-I translocation were dissected into individual translocation events to analyze the PIFE sensitive and the PIFE insensitive portion (Fig. 4B). The rapid intensity decrease corresponds to the PIFE sensitive distance range where RIG-I translocates away from the fluorophore whereas the plateau is interpreted as the PIFE insensitive portion where the intensity does not report on the protein movement. Assuming a constant rate of translocation, the data reflected that the first 10–12 bp movement was detectable by PIFE.9
Fig. 4.
(A) Schematic and single molecule PIFE traces of Rig-I translocation on dsRNA. (B) A single translocation exhibiting a PIFE-sensitive linear region and a PIFE-insensitive plateau region. (C) Distance sensitivity of PIFE and FRET.
Compared to FRET which reports on distance change in the 3–8 nm range, PIFE shows a sharp sensitivity within the 0–3 nm range, thereby adding sensitivity to the FRET insensitive short distance range (Fig. 4C). Taken together, PIFE is a powerful alternative as well as a complement to FRET.
Application – translocation of DNA and RNA motor proteins
The PIFE equivalent assay was initially utilized in ensemble stopped-flow measurements to measure the translocation of DNA motor proteins such as PcrA, UvrD and Rep.4–6,22 In the case of 3′ to 5′ directed protein movement, the fluorescence located at the 5′ end of DNA is expected to show at a later time at which fluorescence started to increase compared to the 3′ labeled DNA (Fig. 5A). The protein and substrate are rapidly mixed together with ATP while fluorescence is measured. The sample includes excess of unlabeled single stranded DNA to monitor the kinetics arising from a single turn-over reaction i.e. single event of translocation per DNA. When tested for different lengths of DNA, the rate of fluorescence increase due to protein translocation is slower for the longer DNA, due to the longer length of translocation required for the PIFE signal to appear. The rate of translocation can be extracted from the velocity of fluorescence increase (Fig. 5B). The same experiment can be performed at varying ATP concentration, which yields the rate of translocation at different ATP concentrations (Fig. 5C). The rate can be converted to the rate of Pi release from the ATP hydrolysis, which can be fitted to the Michaelis–Menten equation to generate Km and Vmax for the given protein (Fig. 5D).
SmPIFE was first used to probe ATP dependent movement of a human antiviral protein, RIG-I.14 RIG-I recognizes double stranded RNA of virus as a pathogen and transmits the antiviral signal to the downstream immune activators. Although the ATPase activity of RIG-I was shown to be essential for its antiviral function, it was not known why the ATPase activity will be required. We used smPIFE assay to demonstrate that RIG-I translocates across dsRNA axis in repetition, resulting in sawtooth shaped signal fluctuation from single molecule traces (Fig. 5E). Furthermore, the rate of translocation is greatly accelerated when the RNA contains a viral signature moiety, 5′-triphosphate. The use of smPIFE was ideal since the protein labeling was extremely challenging and the high dissociation constant (>100 nM) required addition of high protein concentration. We have also shown that the RIG-I translocation was dsRNA length dependent and ATP stimulated.14
The repetitive shuttling of Rep protein was visualized by smFRET in 2005.18 Rep is an E. coli helicase that functions in DNA recombination and repair. In this study, Rep was singly labeled with a donor dye and it was applied to an acceptor labeled DNA (duplex junction). Unexpectedly, Rep exhibited FRET fluctuation, which is interpreted as repetitive cycles of translocation of Rep on ssDNA.18 Such activity can also be visualized by smPIFE (Fig. 5F). The unlabeled Rep applied to Cy3 labeled DNA showed intensity fluctuation of Cy3, consistent with the data obtained for smFRET.14 The asymmetric shape of the PIFE peak, which was also shown in smFRET, arises from the 3′ to 5′ directed translocation followed by a rapid snapping back of the protein.
PcrA is a homolog of Rep, also known to play a role in DNA recombination and repair. The translocation of PcrA was characterized by smFRET and smPIFE assays. When two dyes were located across the ssDNA (5′ tailed) substrate, PcrA induced continuous FRET fluctuation indicating that PcrA reels in 5′ ssDNA in a repetitive manner while being anchored to a duplex junction.23 The same motion was also visualized by smPIFE where the Cy3 attached to the 5′ end of ssDNA showed an intensity fluctuation that reflects the same activity of PcrA (Fig. 5G). The asymmetry seen in this case reflects the gradual translocation which involves PcrA reeling in the ssDNA, followed by an instantaneous release upon reaching the end. Despite the high degree of homology with Rep, PcrA translocation exhibits a different mechanism.23 The dwell times collected from the highly periodic PcrA translocation were analyzed to yield the elementary step size of a single nucleotide for this motor protein. Such quantitation can also be applied to an smPIFE experiment.
TRBP (TAR RNA binding protein) is a dsRNA binding protein. TRBP is implicated in antiviral signaling as a cofactor of PKR and in microRNA processing as an essential cofactor of Dicer. Unexpectedly, TRBP exhibited diffusion movement along double stranded RNA. Unlike the ATP induced translocation of RIG-I, Rep and PcrA shown above, TRBP’s repetitive motion is independent of ATP. When subject to smFRET experiment, the Cy3 labeled TRBP applied to Cy5 labeled dsRNA showed rapid FRET fluctuation. The same movement was probed by smPIFE where the unlabeled TRBP added to Cy3 labeled dsRNA resulted in robust Cy3 intensity fluctuations (Fig. 5H). This activity was exclusive to dsRNA i.e. TRBP did not bind or diffused on DNA:RNA hybrid or ssRNA.24 In the same study, we identified the similar diffusing activity of two more dsRNA binding proteins, R3D1 and PACT, suggesting that this type of mobility may be more general to other members of the dsRNA binding proteins. Future effort will be put into examining different types of dsRNA binding proteins by taking advantage of smPIFE assay.
Application – filament studies
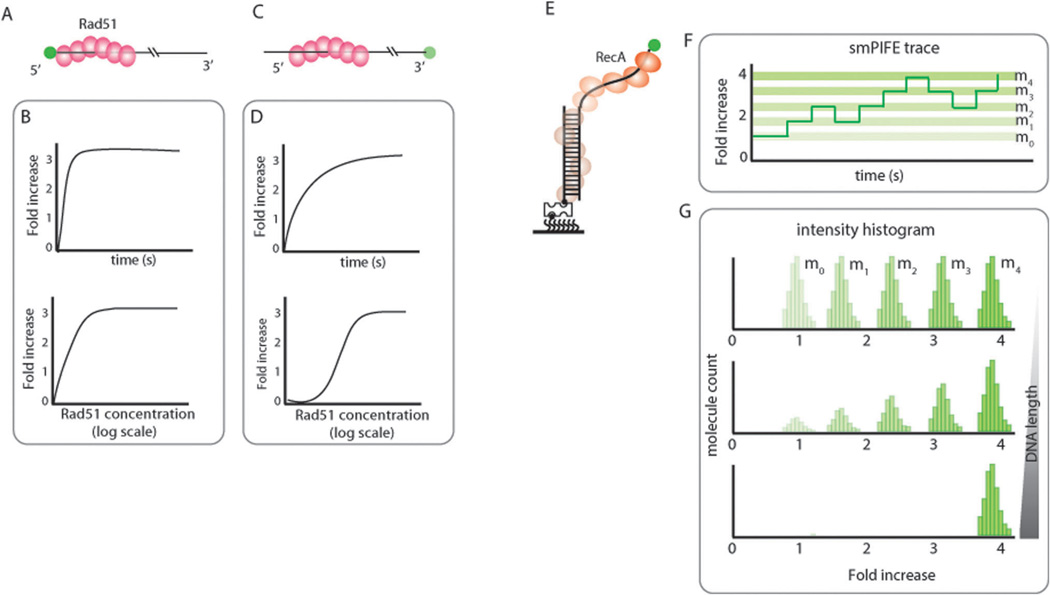
RecA from E. coli and Rad51 from yeast and humans form filaments along ssDNA during DNA recombination or repair. Once formed, the presynaptic filament is capable of searching for and invading into a homologous dsDNA in its vicinity. The process of filament formation involves successive binding of monomers in a directional manner.19 The directionality of Rad51 formation on ssDNA was probed by stopped-flow experiments where the Cy3 dye was attached to either the 3′ or the 5′ end (Fig. 6A and C). The filament formation was monitored by PIFE measurements on alternatively labeled ssDNA substrates. The rate of fluorescence increase that corresponds to the rate of filament formation toward the fluorophore showed a substantially more rapid increase for the 5′ labeled DNA than the 3′ labeled DNA, suggesting that the filament formation occurs in the 5′ to 3′ direction (Fig. 6B and D top).25 When the protein concentration is titrated from 0.1 to 10 µM, the PIFE signal from 5′ Cy3 shows a linear increase whereas the 3′ Cy3 displays a sigmoidal shaped curve over the concentration range of Rad51 protein (semi-log plot). The lag phase seen in the 3′ labeled ssDNA is likely due to the nucleation cluster that is required prior to active filament extension/growth.2 Below the nucleation, the filament is unstable and easily dissociates into monomer units.
Fig. 6.
Directionality of Rad51 formation schematic can be monitored by stopped-flow experiments with the Cy3 fluorophore attached at either 5’ (A) or 3’ end (C). Intensity increase over time and at various Rad51 concentrations can reflect the directionality of Rad51 binding and filament formation (B and D). (E) Schematic of RecA forming filaments on DNA visualized with smPIFE. (F) Addition and dissociation of each RecA monomer can be visualized as a step-wise increase and decrease in fluorescence intensity, respectively. (G) RecA filament stability can be tested by varying the length of ssDNA. A stable filament formed on a long enough substrate will show one high PIFE intensity peak whereas an unstable filament will produce multiple PIFE peaks of varying intensity.
Using smPIFE, RecA filament formation was tested. RecA added to Cy3 labeled ds/ssDNA (Fig. 6E) exhibits stepwise increase and decrease in intensity that reflects monomer binding and dissociation. Since the ssDNA is shorter than what’s required for a stable nucleation cluster formation, the RecA binding is unstable (Fig. 6F). Assuming that each stepwise intensity change arises from a monomer RecA, the intensity levels can be classified into m0, m1, m2, m3 and m4, representing unbound, one, two, three and four monomer bound states in single molecule traces as well as the overall intensity histogram collected from many molecules (Fig. 6F and G). The increased fluorescence intensity also is likely due to the helical filament that further increases the local viscosity around the dye via increased contact between the protein cluster and the dye. If the same experiment were done by smFRET, the same information regarding monomer binding and dissociation would be detectable, yet the directionality of binding cannot be determined. The directional binding on smPIFE can be tested by the progression of intensity change. If the filament grows from 3′ to 5′, the Cy3 at the 3′ end will display a high intensity immediately upon the first monomer binding. Since the data shows a weaker intensity that gradually steps up to higher intensity, it indicates 5′ to 3′ directionality of the RecA filament. As the length of ssDNA increases, RecA is expected to form a more stable filament, which can be shown as the shift in the smPIFE intensity histogram toward a single peak at the highest intensity (Fig. 6F).9 The number of peaks can be counted with each monomer binding (Fig. 6G). Similarly, the directionality of the Rad51 filament measured by smPIFE was recently reported in our publication.17
Future applications
So far, smPIFE has only been used to study a limited number of nucleic acid–protein interactions. However, it will be exciting to look into additional proteins that are implicated in DNA and RNA processing pathways. For example, there are numerous proteins that possess dsRNA binding domains that are important players in the microRNA pathway, antiviral signaling and cellular apoptosis. Knowing exactly how these proteins interact with dsRNA with or without secondary structures commonly found in native substrates will enhance our understanding about their functional role. As demonstrated, smPIFE enables detection of even transient interactions that cannot be resolved by biochemical means. With the ease of the assay that bypasses the need for protein labeling, we expect to see more profiling effort that increases the throughput of single molecule studies.
In addition, a more advanced smPIFE experiment with two different cyanine dyes can be performed as long as the two dyes are positioned outside of the FRET sensitive range. With dual excitation of both reporters, the ability to observe changes at two distinct locations can provide a more comprehensive picture. For example, if two proteins are known to bind to different sequences of location along a DNA, the time course of their binding and movement can be tracked simultaneously. Furthermore, a protein that translocates a long distance along a nucleic acid axis can be tracked in real time using the proposed two-color smPIFE system.
Biographies
Helen Hwang received her BS in Bioengineering from University of California, San Diego, in 2005. She received her PhD under the direction of Sua Myong at University of Illinois at Urbana-Champaign in 2013, focusing on telomere length maintenance with single molecule fluorescence spectroscopy. She is continuing her education and training in the Medical Scholars Program to pursue MD/PhD at University of Illinois. Her research interests involve single molecule photophysics, telomere biology, and G-quadruplex DNA.
Sua Myong received the BS degree in Molecular and Cellular Biology from the University of California, Berkeley, and the PhD degree in Nutritional Sciences also from UC Berkeley. She developed her skills in single molecule biophysics experiments during her postdoctorate period. She began her assistant professor position in the Bioengineering department at University of Illinois in 2009. Her research interests include the study of DNA recombination/repair, RNA interference, telomere processing, and ribonucleoprotein dynamics. Dr Myong was a recipient of the American Cancer Society Research Award (2010), Human Frontier Science Program Award (2011) and the NIH New Director’s Innovator Award (2012).
References
- 1.Roy R, Hohng S, Ha T. A practical guide to single-molecule FRET. Nat. Methods. 2008;5:507–516. doi: 10.1038/nmeth.1208. [DOI] [PMC free article] [PubMed] [Google Scholar]
- 2.Joo C, Balci H, Ishitsuka Y, Buranachai C, Ha T. Advances in single-molecule fluorescence methods for molecular biology. Annu. Rev. Biochem. 2008;77:51–76. doi: 10.1146/annurev.biochem.77.070606.101543. [DOI] [PubMed] [Google Scholar]
- 3.Aramendia PF, Negri RM, Sanroman E. Temperature-Dependence of Fluorescence and Photoisomerization in Symmetrical Carbocyanines - Influence of Medium Viscosity and Molecular-Structure. J. Phys. Chem. 1994;98:3165–3173. [Google Scholar]
- 4.Fischer CJ, Lohman TM. ATP-dependent translocation of proteins along single-stranded DNA: models and methods of analysis of pre-steady state kinetics. J. Mo.l Biol. 2004;344:1265–1286. doi: 10.1016/j.jmb.2004.10.004. [DOI] [PubMed] [Google Scholar]
- 5.Tomko EJ, Fischer CJ, Lohman TM. Ensemble methods for monitoring enzyme translocation along single stranded nucleic acids. Methods. 2010;51:269–276. doi: 10.1016/j.ymeth.2010.03.010. [DOI] [PMC free article] [PubMed] [Google Scholar]
- 6.Fischer CJ, Tomko EJ, Wu CG, Lohman TM. Fluorescence methods to study DNA translocation and unwinding kinetics by nucleic acid motors. Methods Mol. Biol. 2012;875:85–104. doi: 10.1007/978-1-61779-806-1_5. [DOI] [PMC free article] [PubMed] [Google Scholar]
- 7.Luo G, Wang M, Konigsberg WH, Xie XS. Single-molecule and ensemble fluorescence assays for a functionally important conformational change in T7 DNA polymerase. Proc. Natl. Acad. Sci. U. S. A. 2007;104:12610–12615. doi: 10.1073/pnas.0700920104. [DOI] [PMC free article] [PubMed] [Google Scholar]
- 8.Myong S, et al. Cytosolic viral sensor RIG-I is a 5’-triphosphate-dependent translocase on double-stranded RNA. Science. 2009;323:1070–1074. doi: 10.1126/science.1168352. [DOI] [PMC free article] [PubMed] [Google Scholar]
- 9.Hwang H, Kim H, Myong S. Protein induced fluorescence enhancement as a single molecule assay with short distance sensitivity. Proc. Natl. Acad. Sci. U. S. A. 2011;108:7414–7418. doi: 10.1073/pnas.1017672108. [DOI] [PMC free article] [PubMed] [Google Scholar]
- 10.Levitus M, Ranjit S. Cyanine dyes in biophysical research: the photophysics of polymethine fluorescent dyes in biomolecular environments. Q. Rev. Biophy. 2011;44:123–151. doi: 10.1017/S0033583510000247. [DOI] [PubMed] [Google Scholar]
- 11.Sanborn ME, Connolly BK, Gurunathan K, Levitus M. Fluorescence properties and photophysics of the sulfoindocyanine Cy3 linked covalently to DNA. J. Phys. Chem. B. 2007;111:11064–11074. doi: 10.1021/jp072912u. [DOI] [PubMed] [Google Scholar]
- 12.Sorokina M, Koh HR, Patel SS, Ha T. Fluorescent lifetime trajectories of a single fluorophore reveal reaction intermediates during transcription initiation. J. Am. Chem. Soc. 2009;131:9630–9631. doi: 10.1021/ja902861f. [DOI] [PMC free article] [PubMed] [Google Scholar]
- 13.Ha T. Single-molecule fluorescence methods for the study of nucleic acids. Curr. Opin. Struct. Biol. 2001;11:287–292. doi: 10.1016/s0959-440x(00)00204-9. [DOI] [PubMed] [Google Scholar]
- 14.Myong S, et al. Cytosolic Viral Sensor RIG-I is a 5’-Triphosphate-Dependent Translocase on Double-Stranded RNA. Science. 2009;323:1070–1074. doi: 10.1126/science.1168352. [DOI] [PMC free article] [PubMed] [Google Scholar]
- 15.Myong S, Ha T. Stepwise translocation of nucleic acid motors. Curr. Opin. Struct. Biol. 2010;20:121–127. doi: 10.1016/j.sbi.2009.12.008. [DOI] [PMC free article] [PubMed] [Google Scholar]
- 16.Markiewicz RP, Vrtis KB, Rueda D, Romano LJ. Single-molecule microscopy reveals new insights into nucleotide selection by DNA polymerase I. Nucleic Acids Res. 2012;40:7975–7984. doi: 10.1093/nar/gks523. [DOI] [PMC free article] [PubMed] [Google Scholar]
- 17.Qiu Y, et al. Srs2 prevents Rad51 filament formation by repetitive motion on DNA. Nat. Commun. 2013;4:2281. doi: 10.1038/ncomms3281. [DOI] [PMC free article] [PubMed] [Google Scholar]
- 18.Myong S, Rasnik I, Joo C, Lohman TM, Ha T. Repetitive shuttling of a motor protein on DNA. Nature. 2005;437:1321–1325. doi: 10.1038/nature04049. [DOI] [PubMed] [Google Scholar]
- 19.Joo C, et al. Real-time observation of RecA filament dynamics with single monomer resolution. Cell. 2006;126:515–527. doi: 10.1016/j.cell.2006.06.042. [DOI] [PubMed] [Google Scholar]
- 20.Myong S, Bruno MM, Pyle AM, Ha T. Spring-loaded mechanism of DNA unwinding by hepatitis C virus NS3 helicase. Science. 2007;317:513–516. doi: 10.1126/science.1144130. [DOI] [PMC free article] [PubMed] [Google Scholar]
- 21.Tang G-Q, Roy R, Bandwar RP, Ha T, Patel SS. Real-time observation of the transition from transcription initiation to elongation of the RNA polymerase. Proc. Natl. Acad. Sci. U. S. A. 2009;106:22175–22180. doi: 10.1073/pnas.0906979106. [DOI] [PMC free article] [PubMed] [Google Scholar]
- 22.Dillingham MS, Wigley DB, Webb MR. Direct measurement of single-stranded DNA translocation by PcrA helicase using the fluorescent base analogue 2-aminopurine. Biochemistry. 2002;41:643–651. doi: 10.1021/bi011137k. [DOI] [PubMed] [Google Scholar]
- 23.Park J, et al. PcrA helicase dismantles RecA filaments by reeling in DNA in uniform steps. Cell. 2010;142:544–555. doi: 10.1016/j.cell.2010.07.016. [DOI] [PMC free article] [PubMed] [Google Scholar]
- 24.Koh HR, Kidwell MA, Ragunathan K, Doudna JA, Myong S. ATP-independent diffusion of double-stranded RNA binding proteins. Proc. Natl. Acad. Sci. U. S. A. 2013;110:151–156. doi: 10.1073/pnas.1212917110. [DOI] [PMC free article] [PubMed] [Google Scholar]
- 25.Antony E, et al. Srs2 Disassembles Rad51 Filaments by a Protein-Protein Interaction Triggering ATP Turnover and Dissociation of Rad51 from DNA. Mol. Cell. 2009;35:105–115. doi: 10.1016/j.molcel.2009.05.026. [DOI] [PMC free article] [PubMed] [Google Scholar]


