

Abstract
Bile acids are synthesized from cholesterol in hepatocytes and secreted via the biliary tract into the small intestine, where they aid in absorption of lipids and fat-soluble vitamins. Through a process known as enterohepatic recirculation, more than 90% of secreted bile acids are then retrieved from the intestine and returned to the liver for re-secretion1. In humans, there are two Na+-dependent bile acid transporters involved in enterohepatic recirculation, the Na+-taurocholate co-transporting polypeptide (NTCP or SLC10A1) expressed in hepatocytes, and the apical sodium-dependent bile acid transporter (ASBT or SLC10A2) expressed on enterocytes in the terminal ileum2. In recent years, ASBT has attracted much interest as a potential drug target for treatment of hypercholesterolemia, because inhibition of ASBT reduces reabsorption of bile acids, thus increasing bile acid synthesis and consequently cholesterol consumption3,4. However, a lack of 3-dimensional structures of bile acid transporters hampers our ability to understand the molecular mechanisms of substrate selectivity and transport, and to interpret the wealth of existing functional data2,5-8. The crystal structure of an ASBT homolog from Neisseria meningitidis (ASBTNM) in detergent was reported recently9, showing the protein in an inward-open conformation bound to two Na+ and a taurocholic acid. However, the structural changes that bring bile acid and Na+ across the membrane are difficult to infer from a single structure. To understand better the structural changes associated with the coupled transport of Na+ and bile acids, we crystallized and solved two structures of a ASBT homolog from Yersinia frederiksenii (ASBTYf) in a lipid environment, which reveal that a large rigid-body rotation of a substrate-binding domain gives alternate accessibility to the highly conserved “crossover” region, where two discontinuous transmembrane helices cross each other. This result has implications for the location and orientation of the bile acid during transport, as well as for the translocation pathway for Na+.
Purified and reconstituted ASBTYf mediates Na+-dependent transport of the conjugated bile acid taurocholic acid (TCA, Extended Data Fig. 1a-b) with an apparent Km of 48 μM (Figure 1a, b and Extended Data Fig. 1c-e). ASBTYf was crystallized in lipidic cubic phase (LCP), and the structure solved to 1.95 Å (Extended Data Table 1). ASBTYf has 10 transmembrane segments (TM1-10) divided into two domains: a panel domain, formed by TM1, 2, 6 and 7; and a core domain, formed by TM3-5 and 8-10. The first and last five transmembrane helices are structurally homologous, and due to their respective inverted topology give ASBTYf an internal twofold pseudosymmetry axis (Figure 1c and Extended Data Fig. 2). In the core domain, TM4 and 9 unwind in the middle of the membrane and cross each other (Figure 1d), a structural motif also observed in ASBTNM. In addition to the transmembrane helices, there are four amphipathic helices, AH1-4 (Extended Data Fig. 2), that likely are located at the interface between the membrane and the bulk solution, and can be used to infer the approximate position of the lipid bilayer. ASBTYf assumes an inward-open conformation in which the panel and the core domains contact at the extracellular side, creating a large cavity solvent accessible only from the cytoplasm that extends as far as the crossover region (Figure 1d).
Figure 1. Function and 1.95 Å crystal structure of ASBTYf.
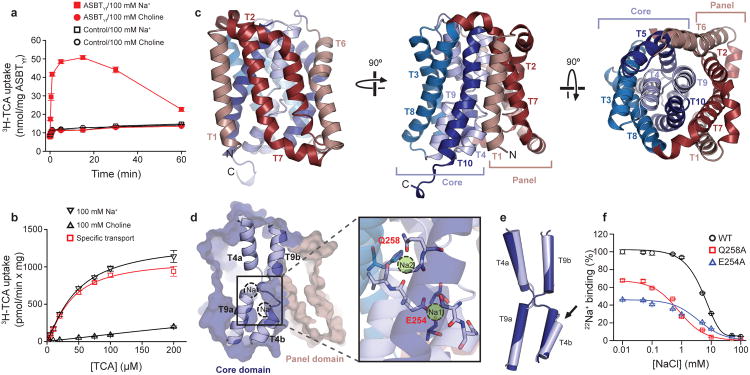
a. Time-course of uptake of 3H-TCA into empty or ASBTYf-containing proteoliposomes in the presence of 100 mM external NaCl or choline chloride. b. Uptake of 3H-TCA 30 seconds after addition to ASBTYf-containing proteoliposomes in the presence of 100 mM external NaCl or choline chloride, as a function of the initial external 3H-TCA concentration. c. Cartoon representation of the ASBTYf structure shown from two perpendicular directions in the plane of the membrane with the periplasm on top (left and middle), and from the extracellular side (right). The transmembrane helices are colored in pseudosymmetry related pairs. d. A cutaway surface representation of ASBTYf showing the locations of the discontinuous helices TM4 and TM9 relative to the intracellular cavity. Locations of the Na+ binding sites in the previously reported ASBTNM structure are marked with dotted circles. Inset on the right shows a magnified view of residues that coordinate Na+ in the ASBTNM structure. e. Alignment of the discontinuous helices TM4 and TM9 in the ASBTYf (light blue) and ASBTNM (dark blue) structures. The partly unwound region of TM4b is marked with a black arrow. f. Na+ binding kinetics of ASBTYf and the Na+-site mutants. Equilibrium binding of 0.95 μM [22Na]Cl (5.92 Ci/mmol) to 250 ng of WT, E254A, or Q258A ASBTYf was measured with the SPA in the presence of increasing NaCl concentrations ranging from 0 – 100 mM. Isotopic replacement of 22Na+ was plotted as a function of the concentration of non-labeled NaCl. The means of triplicate measurements ± SEM were subjected to non-linear regression fitting in Prism 5 (GraphPad).
In the structure of ASBTNM, which has roughly 40% sequence identity with ASBTYf, two Na+ binding sites were identified, Na1 and Na2, which are both located in the core domain behind the crossover (Figure 1d and Extended Data Fig. 3a, b). Na2 sits directly between the C-terminal ends of helices TM4a and TM9a; Na1 is positioned roughly 8 Å away between TM4b, TM9a, and TM5. The residues coordinating Na+ are highly conserved between ASBTNM and ASBTYf (Extended Data Fig. 4), but there is no obvious electron density at Na1 in the ASBTYf structure that could be attributed to Na+, and a very weak density at Na2 (Extended Data Fig. 3c, d). A closer examination of residues forming the putative Na+ binding sites in ASBTYf showed that they are not in position to coordinate Na+ optimally, likely due to a conformational change of TM4b. Whereas other transmembrane helices in the core domain of ASBTYf align closely to those of ASBTNM, TM4b tilts ∼11° away from the crossover, and its first helix turn unwinds (Figure 1e). These changes bring Asn109 and Ser108 out of range for coordination of Na+ in Na1, and may also affect the orientation of backbone carbonyls that form part of Na2 (Figure 1d, Extended Data Fig. 5a, b). To test whether ASBTYf contains two Na+ binding sites like ASBTNM, we measured 22Na+ binding by purified ASBTYf (Figure 1f). Wild type (WT) ASBTYf bound 22Na+ with an apparent EC50 of 5.37 ± 0.01 mM and a Hill coefficient of 1.56 ± 0.06, suggesting cooperative binding between more than one Na+ binding site. Consistent with the notion that Na1 and Na2 are the two Na+ binding sites in ASBTYf, replacing Glu254 in Na1 or Gln258 in Na2 with Ala reduced binding of 22Na+ to 49% and 68% when compared to ASBTYf-WT, respectively, and reduced the Hill coefficients to 1.06 ± 0.02 and 0.5 ± 0.1. The structure of ASBTYf thus represents an inward-facing unliganded state lacking Na+ and bile acid. Interestingly, the rotation of TM4b also renders Na1 solvent accessible from the intracellular side (Extended Data Fig. 5c, d), presenting a potential pathway for release of Na+ into the cytosol.
To obtain ASBTYf in an alternate conformation we perturbed Na1 by mutating highly conserved Glu254 to Ala. Although ASBTYf-E254A is still capable of mediating Na+-dependent transport (Extended Data Fig. 1c-e), the rate of taurocholic acid uptake is substantially reduced. Like ASBTYf-WT, the E254A mutant was crystallized in LCP, and a complete data set was collected to 2.5 Å resolution. Interestingly, molecular replacement using the full structure of wild type ASBTYf as a search model did not yield a valid solution. However, when the panel and core domain were used as two independent rigid bodies, a single solution was obtained (Figure 2a, Extended Data Table 1). The core and panel domains from ASBTYf-E254A individually align well with those of the wild type, with α-carbon root mean square deviations (RMSD) of 0.9 and 1.7 Å respectively, compared to an RMSD of 3.7 Å after aligning both domains. This indicates that there is a relative motion between the core and panel domains. Since the amphipathic helices in the panel domain likely remain at the membrane-solvent interfaces (Extended Data Fig. 6), the core domain in the E254A mutant must undergo a rigid body rotation, causing residues on TM4b and TM9b lining the interface with the panel domain to translate 6 to 9 Å towards the periplasm (Figure 2a, Supplementary Video 1). This motion is facilitated by small changes in AH2, AH4, and the TM5-6 loop, which act as hinges; a kink also forms in TM1 at Pro10. Whereas in the wild type structure, the cavity between the two domains is sealed on the extracellular side by interactions between TM9b, TM2 and TM7, in the E254A structure the two domains now form contacts between TM4b, TM2 and TM7 at the intracellular side. This creates a deep cavity allowing solvent access to the crossover region from the extracellular side (Figure 2b). Similarly to the ASBTYf-WT structure, the E254A structure is not bound to Na+ or a bile acid, and thus, the structure of E254A likely is in the outward-open unliganded conformation.
Figure 2. Structure and validation of the outward-open conformation of ASBTYf.
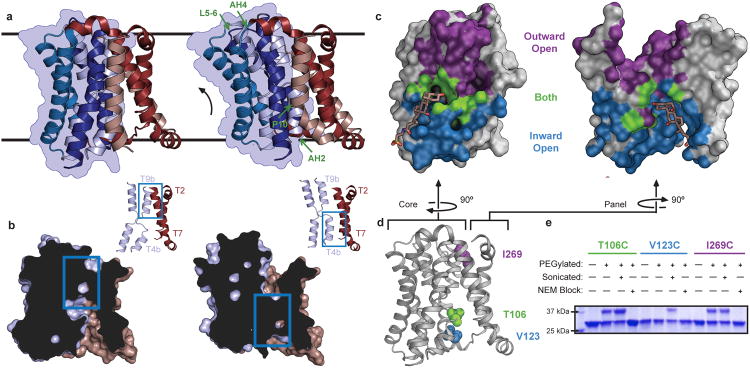
a. The WT (left) and E254A (right) structures are shown side by side. Black lines correspond to the approximate position of the lipid bilayer inferred from the amphipathic helices. The core domain is marked with a blue silhouette, and regions acting as hinges in the conformational change between the two structures are marked with green arrows in the E254A structure. b. Cutaway view of the surfaces of the WT (left) and E254A (right) structures, showing the intracellular and extracellular cavities. Insets show key helices forming the interface between the panel and core domain; blue rectangles show the location of the inter-domain interface in both structures. c. Surface representations of the core (left) and panel (right) domains of the WT ASBTYf structure. The sides of both domains facing the central cavity are colored according to whether they are accessible to the cytoplasm in the WT structure (blue), accessible to the periplasm in the E254A structure (violet), or are solvent accessible in both conformations (green). A stick representation of TCA marks the location of the substrate in the ASBTNM structure. d. Cartoon representation of the WT ASBTYf structure with the locations of Thr106, Val123, and Ile269 marked with spheres. e. SDS-PAGE gel showing results of PEGylation experiments for the three ASBTYf cysteine mutants. Pluses and minuses mark whether or not samples were incubated with mPEG-Mal-5K, were sonicated prior to PEGylation to rupture the cell membranes, or were incubated with N-ethylmaleimide prior to PEGylation to prevent further modification of the cysteine residues.
To address the question of how this rigid-body motion of the core domain can translocate bile acid across the membrane, we compared the solvent accessible surfaces of the inward and outward facing cavities in the two structures. This analysis reveals a narrow area running across the center of the core and panel domains that is accessible to the solvent in both the inward-open and outward-open conformations (Figure 2c). The dual-accessibility region includes the crossover, and contains residues that are highly conserved among ASBT homologs. To test whether the crossover region is indeed accessible from the periplasm as predicted by the E254A structure, and that the outward-open conformation is not simply an artifact caused by detergent solubilization and/or loss of Na1, we measured the accessibility of introduced cysteines in the domain interface to modification by a membrane-impermeable PEGylating reagent either from the periplasm of intact E. coli cells, or from both sides of the membrane in cells ruptured by sonication (Figure 2d, e). The cysteine mutants were still able to transport TCA, albeit at a reduced rate, indicating that they likely undergo similar conformational changes as ASBTYf-WT (Extended Data Fig. 7a). All three mutants were PEGylated when exposed to the reagent in ruptured cells, but cysteine at position 123, which is accessible only from the intracellular side in both conformations, was not PEGylated in intact cells. Despite being inaccessible to the periplasm in the WT structure, the T106C mutation located near the crossover was PEGylated in intact cells, suggesting that the crossover region is indeed accessible from the extracellular side as observed in the E254A structure.
In the ASBTNM structure, a TCA was built into the inward-facing cavity with an orientation roughly perpendicular to the membrane, i.e., with the cholesterol ring close to the crossover and the taurine group extending to the intracellular entrance of the cavity. Curiously, most of the residues forming the TCA binding site in the ASBTNM structure are accessible only in the inward-open state (Figure 2c). In the outward-open state, this TCA binding site is buried in the protein matrix without an access pathway from the periplasm. This observation appears at odds with the alternating access model10,11, according to which ligand is transported across the membrane via the alternating exposure of central ligand binding sites to the intracellular or the extracellular space through a sequence of distinct conformational alterations. Structural validation of the principles of the alternating access mechanism has been obtained from crystal structures of several transporters12-20. One possible resolution for this apparent conflict is that the transporter possesses another as-of-yet unobserved binding site for TCA, which unlike the binding site shown in ASBTNM, has alternating access to both the periplasm and cytoplasm. For example, the bile acid could bind in a lateral orientation to the dual-access region described above (Extended Data Fig. 7c), with its mostly hydrophobic β-face oriented towards the hydrophobic panel domain, and its hydrophilic α-face close to polar residues on the core domain (Extended Data Fig. 7d). In this configuration, the rigid-body motion of the core domain revealed by the two ASBTYf structures would be sufficient to translocate the bile acid across the membrane. Mutation of polar residues capable of forming hydrogen bonds to the three hydroxyls on the steroid nucleus of TCA in a speculative horizontal orientation reduces TCA binding relative to ASBTYf-WT (Extended Data Fig. 7e, f). Introducing mutations to the protein can affect substrate binding in detergent indirectly through a variety of mechanisms not involving direct contact with the substrate, and further experimental validation will be required to demonstrate the existence of a horizontal binding site in ASBT.
Capturing distinct conformations of secondary transporters during the transport cycle experimentally is a major challenge in understanding the transport-associated dynamics of these molecular machines. Here we have presented two alternative conformations of a transporter produced by mutating a Na+ site. It cannot be fully excluded that mutating Na1 resulted in perturbations from the native structure, but the two structures appear to correspond to ligand-free inward- and outward-open states. To further investigate the states of the ASBT transport cycle, we measured the interdependency of Na+ and TCA binding by SPA. Binding of TCA to ASBTYf is strongly dependent on the concentration of Na+ (Figure 3a), whereas TCA has minimal effect on Na+ binding (Figure 3b). This suggests that the Na+-sites are occupied before TCA can bind to the transporter. From these results, we can begin to enumerate and order conformational states in a preliminary model of the ASBT transport cycle (Figure 3c).
Figure 3. Proposed ASBTYf transport mechanism.

a. Binding of 3H-TCA to detergent-solubilized WT ASBTYf as a function of NaCl concentration, as measured by SPA. b. Binding of 22Na+ to detergent-solubilized WT and E254A ASBTYf in the presence and absence of 100 μM TCA. c. Key conformational states of ASBT during the translocation of substrates. Distinct conformations captured by crystallography are indicated with the name of the relevant protein, whereas hypothetical structural states are surrounded with a dashed grey line. In the ligand-free state (I), corresponding to the E254A ASBTYf structure, the crossover region is exposed to the periplasm. Na+ then binds to Na1 and Na2 (II), facilitating the binding of TCA, likely to the dual-accessibility region (III). Conversion to the inward-open conformation (IV) allows TCA access to the binding site observed in the ASBTNM structure (V). Exposure to lower Na+ concentrations in the cytoplasm drives release of Na+, possibly by the pathway opened by the rotation of TM4b in the ASBTYf structure (VI), which in turn triggers release of TCA.
ASBTYf and ASBTNM share their fold with NhaA (a member of the Na+/H+ antiporter family). NhaA also possesses inverted psuedosymmetry repeats that form a substrate-binding core domain and a panel domain, although the panel domain typically contains two or more additional helices that form a homodimer interface21 (Extended Data Fig. 8a). Two Na+/H+ antiporter structures (NhaA and NapA) have been published21,22, which correspond to inward-open and outward-open states. Despite the substantial difference in the size of the substrates involved, the rigid-body movement of the core domain that converts between the two states in the Na+/H+ antiporters is remarkably similar to that observed for ASBTYf (Extended Data Fig. 8b, c). As in ASBTYf, the conformational change provides alternating access to the crossover region, where Na+ and protons are predicted to bind to a cluster of conserved acidic residues. However, this site is not equivalent to either Na1 or Na2 in the bile acid transporter. Examination of the site on NapA corresponding to Na2 shows that two of the polar residues coordinating Na+ in ASBTYf (Gln258 and His71, Extended Data 8f) are in fact replaced with two positively charged side chains (Arg331 and Lys305, Extended Data Fig. 8g), which form hydrogen bonds with the C-terminal ends of helices TM4a and TM11a (TM4a and TM9a in ASBTYf). In the structurally unrelated antiporter CaiT, which is Na+-independent, an arginine residue has recently been shown to mimic binding of Na+ to a site found in Na+-dependent symporters of the same fold23. It might therefore be feasible to speculate that these residues in NapA can play a role analogous to bound Na+ in ASBTYf and ASBTNM. Further comparison of these two families of transporters may provide insight into how the same fold and conformational change can act as “scaffolding” for highly distinct substrates and coupling mechanisms. The ASBTYf structure also shows some interesting parallels with structurally unrelated families of transporters. For example, the translation towards the periplasm observed in E254A ASBTYf is similar to the elevator-like motion of the substrate-binding domain in GltPh, a homolog of the glutamate transporter17,24 (Extended Data 8d).
Although they belong to an unrelated fold, the structures of ASBTYf invite comparison to recent structures obtained for E. coli XylE, a xylose/H+ symporter belonging to the Major Facilitator Superfamily (MFS) with homology to the mammalian GLUT transporters. Like the bile acid transporters, MFS transporters contain two domains, with a substrate-binding site located at the domain interface, and also possess inverted pseudosymmetry repeats. However, whereas in the bile acid transporter fold helices from each repeat are interleaved between the asymmetric panel and core domains, in the MFS fold each of the two pseudosymmetry repeats forms a separate six-helix domain. Recently, structures of XylE from E. coli have been solved in the inward and outward-facing conformations, as well as a potential intermediate conformation15,18 (Extended Data Fig. 8e). Comparison of the three states shows that, like ASBTYf, XylE provides alternating access to the central substrate-binding site by the rigid body motion of a mobile domain relative to a fixed domain, although in XylE the conformational change is largely a rocking motion that does not translate the binding site towards the opposite side of the bilayer.
In XylE, salt bridges between conserved residues in the two domains have been proposed to play a key role in conversion between the inward and outward open conformations15. In contrast, in ASBTYf there are few hydrophilic interactions between polar or charged residues on the core domain and the very hydrophobic panel domain, a feature that may lower the energy barrier to moving the two domains relative to each other. Regardless, it is still unknown how binding of Na+ or H+ and the cognate substrate could trigger a conversion from the outward-open to the inward-open state in either fold. Further studies are necessary to reveal the energetics that govern the conformational changes.
In humans, ASBT inhibitors have received considerable attention as potential therapeutics for the treatment of hypercholesterolemia25 and Type II diabetes26. Another possible medical application of compounds targeting bile acid transporters involves conjugating bile acids to drugs with poor oral bioavailability, so that they will be recognized as substrates by ASBT and NTCP and absorbed in the intestine and liver27. Both approaches would greatly benefit from improving our understanding of bile acid transporter structure and mechanism. ASBTYf shares 22% sequence identity and 59% similarity to human ASBT. Additionally, the residues forming the two Na+ binding sites are highly conserved (Extended Data Fig. 4). This suggests that the overall fold and transport mechanism are similar between the two proteins, and that ASBTYf may serve as a useful model system for understanding mechanisms of transport and inhibition in the mammalian ASBT homologs.
Full Methods
Cloning and expression of ASBT homologues
Bacterial homologs of human ASBT (accession number NP_000443.1) were cloned into two modified pET plasmids (Novagen), one with an N- and another with a C-terminal deca-histidine tag cleavable by an engineered tobacco etch virus (TEV) protease recognition site, and examined for expression in E. coli. A total of 70 bacterial homologs were examined, and three of them produced proteins that were mono-disperse after detergent extraction. Part of the cloning and expression study was performed at the central facility of New York Consortium on Membrane Protein Structure (NYCOMPS)31.
Expression vectors containing the gene of interest were transformed into BL21-Gold (DE3) competent cells (Agilent). For large scale protein expression, transformed cells were grown in Luria-Bertani (LB) media to an optical density at 600 nm of ∼1 at 37 °C. Overexpression of the protein was induced by addition of isopropyl β-D-1-thiogalactopyranoside (IPTG) to a final concentration of 0.5 mM at 20 °C overnight. Cells were harvested by centrifugation and cell pellets were resuspended in Lysis Solution (LS) containing 20 mM HEPES pH 7.5, 150 mM NaCl, 10% (v/v) glycerol, 2 mM β-mercaptoethanol and 1 mM phenylmethanesulfonyl fluoride (PMSF). Cells were lysed by sonication and n-dodecyl-β-D-maltopyranoside (DDM) was added to a final concentration of 30 mM. The mixture was shaken at 20 °C for 2 hours and centrifuged (16,000 g for 45 minutes) at 4 °C. The supernatant was then loaded onto a cobalt metal affinity column, washed with LS supplemented with 20 mM imidazole, and eluted with LS supplemented with 300 mM imidazole.
Crystallization
Crystallization was pursued on the three clones that produced mono-dispersed proteins, and the clone from Yershinia frederiksenii (ASBTYf) with an N-terminal deca-histidine tag generated the best crystals. Cobalt-affinity-purified ASBTYf was treated with α-chymotrypsin (TLCK-treated, Worthington) at a 20:1 ratio (w/w, ASBTYf :α-chymotrypsin) for 30 minutes at 20 °C to generate a stable core. The proteolytic reaction was stopped by addition of 1 mM PMSF, followed by concentration of the protein to ∼8 mg/ml, which was loaded onto a Superdex 200 10/300 GL column (GE Health Sciences) equilibrated in 20 mM HEPES pH 7.5, 150 mM NaCl, 5 mM β-mercaptoethanol and 4 mM n-decyl-β-D-maltopyranoside (DM). The purified ASBTYf protein was concentrated to ∼50 mg/ml as approximated by ultraviolet absorbance and mixed with 1-oleoyl-rac-glycerol (monoolein, Sigma-Aldrich) at a 2:3 (w/w) protein to lipid ratio using the twin-syringe mixing method32. The protein-lipid mixture was dispensed manually in ∼50 nl drops onto 96-well glass sandwich plates and overlaid with 1.5 μl precipitant solution per drop. The wild-type ASBTYf crystals were grown in 30% (v/v) PEG-400, 0.1 M Na-citrate pH 5.5, 0.1 M NaCl, and 3% (w/v) D-trehalose, and the ASBTYf E254A crystals were grown in 39% (v/v) PEG-400, 0.1 M Tris-HCl pH 8.5, 0.1 M KCl, and 10 mM MnCl2. The crystals reached full size within 5-7 days at 20 °C. The E254A crystals were soaked in 10 mM taurocholic acid for 2 hrs. prior to harvest, and both crystals were flash frozen in liquid nitrogen without additional cryoprotectant.
Data collection and structure solution
Diffraction data were collected on beamline 8.2.2 at the Advanced Light Source, on beamline X29 at the National Synchrotron Light Source and on beamlines 24ID-E and 17ID-B at the Advanced Photon Source. The data were indexed, integrated and scaled using the HKL2000 software suite. The WT ASBTYf structure was solved by molecular replacement with Phaser33 using the ASBTNM structure as a search model. The asymmetric unit contained two ASBTYf monomers, and strong NCS restraints were used during early model building and refinement. Manual model building and refinement were carried out using Coot34 and phenix.refine35, and Molprobity36 was used to monitor and improve protein geometry. The final model contains residues 1-307 in chain A and residues 3-306 in chain B, 147 water molecules, 4 monoolein molecules, and 2 molecules of citrate, which was included in the crystallization solution as a buffer, and appears to bind directly to the crossover region (Extended Data Fig. 9a, c). To rule out the concern that the bound citrate molecules were perturbing the Na+ binding sites, 22Na+ binding in the presence/absence of 5 mM potassium citrate was measured by SPA as described below, which showed very little effect (Extended Data Fig. 9b). The E254A structure was solved by molecular replacement using sequential searches with the separate core and panel domains of WT ASBTYf. Model building and refinement followed the same methodology as for the WT structure. The final asymmetric unit contained residues 1-301 of E254A ASBTYf and 14 water molecules. Although the crystal was soaked in 10 mM taurocholic acid, no density consistent with TCA could be identified in the structure. Five residues from the TEV cleavage site on the N-terminus are also resolved in the structure, and form a continuation of TM1.
Solvent accessibility in Fig. 2c and Extended Data Fig. 7c was visualized by selecting residues within 4 Å of spheres placed by the program HOLLOW37, using a probe radius of 1.4 Å. VMD38 was used to calculate RMSDs, transformation matrices, and miscellaneous other molecular properties. Intermediate states for the morphing animation in Supplementary Video 1 were calculated using LSQMAN39. All structure figures were prepared in Pymol (Schrödinger, LLC).
PEGylation assay
Site-directed mutagenesis was performed using the QuikChange kit (Agilent). For PEGylation experiments, the internal cysteines of ASBTYf (C196 and C248) were mutated to serines before introduction of single cysteine mutations at positions 106 (Thr), 123 (Val) or 269 (Ile). Accessibility of specific residues on ASBTYf embedded in E. coli membranes was probed by PEGylation using a membrane-impermeable PEGylating reagent, methoxypolyethylene glycol maleimide 5,000 (mPEG-Mal-5K, Sigma-Aldrich). Briefly, E. coli cells expressing ASBTYf carrying specific single cysteine mutations were harvested and washed twice with PEGylation Buffer containing 20 mM HEPES pH 7.5, 150 mM NaCl, and 10% (v/v) glycerol. The cells were resuspended in the PEGylation Buffer (50 mL culture/mL buffer) and split into four aliquots. The first is a control that did not contain any PEGylation reagents; the second one was treated with 10 mM mPEG-Mal-5K at room temperature for 1 hour with shaking; the third sample was sonicated first to break the cells in the presence of 10 mM mPEG-Mal-5K and then incubated at room temperature for 1 hour; and the fourth sample was first treated with 20 mM N-ethylmaleimide (NEM, 2 hours at room temperature) to block free cysteines and then treated with 10 mM mPEG-Mal-5K at room temperature for 1 hour. The PEGylation reaction was stopped by addition of β-mercaptoethanol to a final concentration of 20 mM. After PEGylation, samples 1, 2 and 4 were sonicated, and DDM was added to all four samples to a concentration of 30 mM. The mixtures were then shaken at 20 °C for two hours to extract membrane proteins, and cleared with centrifugation (40,000× g, 45 minutes). The supernatant was then loaded onto columns packed with 0.5 ml of cobalt beads, washed with 30 bed-volumes of PEGylation Buffer containing 20 mM imidazole pH 8, and eluted with 5 bed-volumes of PEGylation Buffer containing 300 mM imidazole pH 8. The protein eluates were concentrated using Amicon Ultra centrifugal filter units (50 kDa Nominal Molecular Weight Limit), and analyzed by SDS-polyacrylamide gel electrophoresis and Coomassie staining.
SPA-based binding assay
Cu2+-coated polyvinyl toluene (PVT) or yttrium silicate (YSi) SPA beads were diluted to 2.5 mg/mL in assay buffer. For the 22Na+ binding experiments the assay buffer was composed of 200 mM HEPES-Tris, pH 7.5, 20% glycerol, 1 mM tris(2-carboxyethyl)phosphine (TCEP, Sigma Co), and 0.19 (w/v) % n-decyl-β-D-maltopyranoside (Anatrace Inc.), whereas for 3H-taurocholic acid binding experiments 200 mM HEPES-Tris was equimolarly replaced with 50 mM HEPES-Tris, pH 7.5 and 150 mM NaCl. 250 ng of the indicated purified recombinant (His-tagged) ASBTYf variants were added to 100 μL of the SPA-bead solution. Binding of 0.5 μM 3H-taurocholic acid (10 Ci/mmol, American Radiolabeled Chemicals, Inc.) was measured in the presence of 0-5 mM taurocholic acid, and binding of 0.95 μM [22Na]Cl (5.92 Ci/mmol, Perkin Elmer) was assayed in the presence of 0–100 mM non-labelled NaCl in individual wells of clear-bottom/white-wall 96-well plates. Equilibrium binding was performed in the dark for 16 h at 4 °C with vigorous shaking on a vibrating platform and the counts per minute (cpm) were determined in the SPA mode of a Wallac 1450 MicroBeta™ plate PMT counter. The non-proximity background signal was determined for each sample in the presence of 800 mM imidazole, which prevents the interaction of the His-tagged protein with the Cu2+-coated SPA beads, and the non-proximity cpm were subtracted from the cpm determined in the absence of imidazole to obtain the specific binding activity. Data were normalized with regard to the activity of WT ASBTYf in the absence of non-labelled ligand and set as 100%. All experiments were performed at least in duplicate with replicas of ≥3 and data are expressed as mean ± standard error of the mean. Data fits of kinetic analyses were performed using non-linear regression algorithms in Prism 5 (GraphPad) and errors represent the S.E.M. of the fit.
Uptake of 3H-TCA in proteoliposomes
Prior to reconstitution, the N-terminal His tag on cobalt-affinity-purified ASBTYf was removed by digestion with α-chymotrypsin followed by gel-filtration as described above for protein used for crystallization. The chymotrypsin-treated WT ASBTYf and variants were reconstituted at a 1:100 (w/w) ratio in preformed, Triton X-100 (0.12 % [w/w]) destabilized liposomes that were prepared of E. coli polar lipid extract (Avanti) in 100 mM potassium phosphate, pH 7.5/2 mM β-mercaptoethanol30. Prior to the uptake measurements, frozen proteoliposomes were thawed at 23 °C and extruded through a 400 nm filter. The uptake reaction was initiated by the 20-fold dilution of the proteoliposome suspension (5 mg lipid/mL) into assay buffer composed of 10 mM HEPES, pH 7.4/100 mM NaCl (or 100 mM choline chloride)/1 mM CaCl2/1 mM MgCl2 plus 1 μM 3H-taurocholic acid at 37 °C. The 3H-taurocholic acid was adjusted to a specific activity of 10 Ci/mmol in all uptake experiments, except for the assays in Extended Data Fig. 1c-e, where a specific activity of 20 Ci/mmol was used. Reactions were stopped by the addition of ice-cold 100 mM potassium phosphate, pH 6.0/100 mM LiCl and filtered through 0.22 μm nitrocellulose filters (Millipore Inc). The radioactivity retained on the filters was determined with scintillation counting. Known amounts of radioactivity were used to convert counts per minute to mol.
Extended Data
Extended Data Figure 1. Purification and functional characterization of WT and Na+-site mutant ASBTYf.

a, The elution profiles of WT, E254A, Q258A, and E254A/Q258A ASBTYf from a size exclusion column. Inset shows SDS-PAGE gel of FPLC-purified WT ASBTYf before (lane 2) and after (lane 3) cleavage of the affinity tag with TEV protease. b, Chemical structures of bile acids. The primary bile acid cholic acid (top) contains a steroid nucleus, with a five-carbon side chain terminating in a carboxylic acid attached to carbon 17. Further modification of cholic acid by attachment of the amino acid taurine to the side chain results in the conjugated bile acid taurocholic acid (TCA, bottom). c-e, Time courses of 1 μM 3H-TCA (20 Ci/mmol) uptake into proteoliposomes reconstituted with WT (red) or E254A (blue) ASBTYf, or control liposomes (black) without protein, in the presence of 100 mM external NaCl. Uptake was measured under three conditions: c, in intact liposomes with an inwardly-directed Na+ gradient; d, in the presence of 25 μg/mL of the Na+-selective ionophore gramicidin, collapsing the Na+ gradient; and e, in the presence of 25 μg/mL gramicidin and 0.05% of the detergent n-dodecyl-β-D-maltopyranoside. Under the latter condition, the liposomes are permeabilized, and only 3H-TCA bound to the lipids and protein is measured.
Extended Data Figure 2. Topology diagram of the bile acid transporter fold.
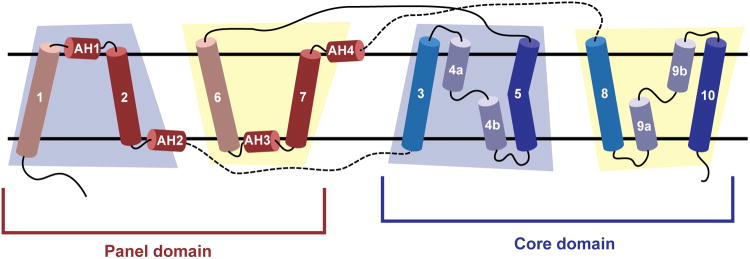
A schematic of the membrane topology of ASBTYf, oriented with the periplasm on top. The helices are grouped by domain, and the blue and yellow trapezoids denote transmembrane helices in the first and second inverted repeats, respectively. Pseudo-symmetry equivalent transmembrane helices are colored identically.
Extended Date Figure 3. The WT ASBTYf structure is in a Na+ -free state.

a-d, Stereo images of the residues forming Na1 (a, c) and Na2 (b, d) in the ASBTNM (a, b) and ASBTYf (c, d) structures, shown with the 2Fo-Fc electron density maps in blue and the Fo-Fc density maps in green. Contour levels are set at 1.5 and 3.0 σ, respectively, and the sodium ions were omitted from the Fo-Fc map calculation for the ASBTNM structure. The purple spheres in all four images correspond to the positions of Na+ in the ASBTNM structure.
Extended Data Figure 4. Sequence conservation of the bile acid transporter family.

Sequence alignments of human NTCP, ASBT and bacterial homologs from Neisseria meningitidis and Yersinia frederiksenii were calculated with CLUSTALW. The colored bars mark the locations of transmembrane helices in ASBTYf. Residues forming Na1 and Na2 are highlighted with orange and pink, respectively. Residues in ASBTYf mutated to cysteine for the accessibility experiments are colored green; native cysteines that were mutated to serine to make the cysteine-free background are colored cyan.
Extended Data Figure 5. Na+-induced conformational changes in the Na+-binding sites and crossover region.

a-b, Stereoimages of the Na+-binding sites Na1 (a) and Na2 (b) are shown in the superposed ASBTYf (light blue) and ASBTNM (black) structures. Purple spheres correspond to the sodium ions in the ASBTNM structure. c, The ABSTYf structure colored by domain, with the locations of the Na+ binding sites from ASBTNM marked with circles. Green dots mark a solvent accessible invagination in the surface of the core domain. TM1 is hidden for clarity. d, Closer view of Na1, formed by residues from helices TM4, TM5, and TM9 of the core domain, shown in the overlaid ASBTYf (dark blue) and ASBTNM (black) structures, as viewed from periplasmic side. The purple sphere corresponds to the Na+ position in the ASBTNM structure. Green dots mark a solvent accessible invagination in the surface of the core domain leading to the central cavity in ASBTYf, which is blocked by the residue equivalent to N109 in the Na+-bound ASBTNM structure.
Extended Data Figure 6. The core domain of ASBTYf moves relative to the membrane to form the outward-open state.

a, If the inward-open and outward-open ASBTYf structures are aligned on the core domain only (gray), a rigid motion of the panel domain (blue) moves the amphipathic helices (red) out of the inferred bilayer/periplasm and bilayer/cytoplasm interfaces. b, If the inward-open and outward-open ASBTYf structures are aligned on the panel domain only (gray), a rigid-body motion of the core domain (blue) leaves the amphipathic helices largely unaffected.
Extended Data Figure 7. Accessibility of residues in the crossover region and potential substrate binding sites.

a, Empty liposomes or proteoliposomes reconstituted with 1:100 (mg:mg) WT, C196S/C248S/T106C, C196S/C248S/V123C, or C196S/C248S/I269C ASBTYf were assayed for uptake of 1 μM 3H-TCA (10 Ci/mmol) in the presence of 100 mM NaCl for the indicated time periods. b, Accessibility of the T106C, V123C, and I269C residues to modification by mPEG-Mal-5K, assessed by a shift in mobility on a Coomassie blue-stained SDS-PAGE gel (same as in Fig 2d, shown here uncropped). Each cysteine mutant was overexpressed in E. coli and subjected to four different conditions prior to purification: no addition of mPEG-Mal-5K; addition of mPEG-Mal-5K to the outside of whole cells, addition of mPEG-Mal-5K after sonication to rupture the cell membranes, and addition of mPEG-Mal-5K to whole cells after block of cysteines with N-ethylmaleimide. c, The core domain of ASBTYf, viewed from the central cavity-facing side, with the inward accessible, outward accessible, and dual accessible surface areas colored as in Figure 2c. A molecule of TCA is shown modeled into two potential binding sites: (left) the binding site observed in the ASBTNM structure, and (right) a laterally-oriented binding site based on the location of residues accessible to solution in both the inward open and outward open ASBTYf crystal structures. d, Surface representations of the core and panel domains of ASBTYf, both oriented with the cavity-facing sides in front, colored by element. Carbon atoms are shown as blue-gray, oxygen atoms as red, nitrogens as dark blue, and sulfurs as yellow. e, Locations of polar residues near the crossover region. TCA is shown based on the ASBTNM structure (left) and accessibility in the ASBTYf structures (right). f, Binding of 1 μM 3H-TCA in the presence of 150 mM NaCl by WT and mutant ASBTYf measured by SPA. Mutations that reduce binding by more than 20% relative to the WT protein are labeled in red.
Extended Data Figure 8. Comparison of ASBTYf to the NhaA/NapA, XylE, and GltPh transporters.

a, Cartoon representation of the NapA structure (4BWZ) shown from two perpendicular directions. The transmembrane helices are colored in pseudosymmetry-related pairs according to the same scheme used for the ASBT fold in Extended Data Fig. 2. Helices in the interface domain with no equivalent in the ASBT fold are colored gray. ASBTYf is shown in the two rightmost panels for comparison. b, Outward-open (4BWZ, left) and inward-open (1ZCD, right) structures of Na+/H+ antiporters with the mobile core domain colored dark blue and the immobile interface domain colored red. c, Outward-open (left) and inward-open (right) structures of ASBTYf with the mobile core domain colored dark blue and the immobile panel domain colored red. d, Outward-open (1XFH, left), intermediate (3V8G, middle), and inward-open (3KBC, right) structures of GltPh with the mobile substrate binding domain colored dark blue and the immobile interface domain colored red. e, Outward-open (4GBY, left), partially inward-open (4JA3, middle), and inward-open (4JA4, right) structures of E. coli XylE with the mobile C-terminal domain colored dark blue and the immobile N-terminal domain colored red. f-g, The core domains of ASBTYf (f) and NapA (g) are shown viewed from the side facing the panel domain, with magnified views of the crossover regions. Polar and charged residues stabilizing the exposed backbone atoms in the unwound regions are shown as sticks in both structures. The gray circles correspond to the Na+ binding sites in ASBTNM or to the approximate location of the putative Na+ binding site in NapA.
Extended Data Figure 9. Citrate in the crossover region of the WT ASBTYf structure.

a, Location of the bound citrate molecule in the WT ASBTYf structure. The green surface corresponds to the Fo-Fc omit density for the citrate, contoured at 3.0 σ. Helix TM1 is hidden for clarity. b, Specific binding of 0.48 μM [22Na]Cl (5.92 Ci/mmol) to WT ASBTYf measured by SPA in the presence and absence of 5 mM potassium citrate. c, A close-up stereo-view of the area marked with a black rectangle in panel a. Likelihood weighted 2Fo-Fc (1.5 σ) and Fo-Fc (3.0 σ) electron density is shown as blue and green mesh, respectively. The citrate molecule was omitted from the Fo-Fc map calculation. Potential hydrogen bonds to the protein and ordered solvent molecules are marked with dotted lines.
Extended Data Table 1. Data collection, phasing and refinement statistics.
Statistics from X-ray data collection and from refinement of atomic models for the WT and E254A ASBTYf crystals. Values in parentheses correspond to the highest resolution shell.
| WT ASBTYf | E254A ASBTYf | |
|---|---|---|
| Data collection | ||
| Space group | C2 | P212121 |
| Cell Dimensions | ||
| a, b, c (Å) | 189.41,46.22,70.36 | 54.16,73.86,85.53 |
| α, β,γ (°) | 90.0, 100.7,90.0 | 90.0, 90.0, 90.0 |
| Resolution (Å) | 1.95(1.98-1.95)* | 2.5 (2.54-2.50) |
| Rsym or Rmerge | 0.076 (0.586) | 0.085(0.416) |
| I/σ(I) | 14.7(2.2) | 25.9 (2.3) |
| Completeness (%) | 99.6(100.0) | 98.0 (80.5) |
| Refinement | ||
| Resolution (Å) | 1.95(1.99-1.95) | 2.5 (2.75-2.50) |
| No. reflections | 43718(2471) | 12142(2792) |
| Completeness (%) | 99.4 (96.0) | 98.0(91.9) |
| Rwork/Rfree(%) | 18.3/22.2 | 20.0/24.8 |
| No. atoms | ||
| Protein | 4580 | 2291 |
| Ligand/ion | 126 | 25 |
| Solvent | 147 | 14 |
| B-factors | ||
| Protein | 33.4 | 40.1 |
| Ligand/ion | 57.7 | 51.2 |
| Solvent | 40.1 | 38.2 |
| R.m.s deviations | ||
| Bond lengths (Å) | 0.007 | 0.006 |
| Bond angles (°) | 1.085 | 1.058 |
Supplementary Material
Acknowledgments
Data for this study were collected at beamlines 8.2.2 at the Advanced Light Source, X-29 at the National Synchrotron Light Source, and 24ID-E and 17ID-B at the Advanced Photon Source. This work was supported by the US National Institutes of Health (R01DK088057, R01GM098878, U54GM095315, and U54GM087519), the American Heart Association (12EIA8850017), and the Cancer Prevention and Research Institute of Texas (R12MZ). M.Z. thanks Dr. R. MacKinnon for advice and guidance on scientific directions.
Footnotes
Supplementary Information accompanies the paper.
Author Contributions X.Z., E.J.L., M.Q. and M.Z. conceived the project and designed the research. X.Z., E.J.L., M.Q., Y.P., J.G.M., R.S., B.K., R.B., and M.Z. performed experiments. E.J.L. and M.Z. wrote the manuscript with input from all authors.
The authors declare no competing financial interests.
References
- 1.Dawson PA. Role of the intestinal bile acid transporters in bile acid and drug disposition. Handbook of experimental pharmacology. 2011:169–203. doi: 10.1007/978-3-642-14541-4_4. [DOI] [PMC free article] [PubMed] [Google Scholar]
- 2.Claro da Silva T, Polli JE, Swaan PW. The solute carrier family 10 (SLC10): Beyond bile acid transport. Molecular aspects of medicine. 2013;34:252–269. doi: 10.1016/j.mam.2012.07.004. [DOI] [PMC free article] [PubMed] [Google Scholar]
- 3.West KL, Ramjiganesh T, Roy S, Keller BT, Fernandez ML. 1-[4-[4[(4R,5R)-3,3-Dibutyl-7-(dimethylamino)-2,3,4,5-tetrahydro-4-hydroxy-1,1-di oxido-1-benzothiepin-5-yl]phenoxy]butyl]-4-aza-1-azoniabicyclo[2.2.2]octane methanesulfonate (SC-435), an ileal apical sodium-codependent bile acid transporter inhibitor alters hepatic cholesterol metabolism and lowers plasma low-density lipoprotein-cholesterol concentrations in guinea pigs. The Journal of pharmacology and experimental therapeutics. 2002;303:293–299. doi: 10.1124/jpet.102.038711. [DOI] [PubMed] [Google Scholar]
- 4.Braun A, et al. Inhibition of intestinal absorption of cholesterol by ezetimibe or bile acids by SC-435 alters lipoprotein metabolism and extends the lifespan of SR-BI/apoE double knockout mice. Atherosclerosis. 2008;198:77–84. doi: 10.1016/j.atherosclerosis.2007.10.012. [DOI] [PMC free article] [PubMed] [Google Scholar]
- 5.Hagenbuch B, Stieger B, Foguet M, Lubbert H, Meier PJ. Functional expression cloning and characterization of the hepatocyte Na+/bile acid cotransport system. Proceedings of the National Academy of Sciences of the United States of America. 1991;88:10629–10633. doi: 10.1073/pnas.88.23.10629. [DOI] [PMC free article] [PubMed] [Google Scholar]
- 6.Wong MH, Oelkers P, Craddock AL, Dawson PA. Expression cloning and characterization of the hamster ileal sodium-dependent bile acid transporter. The Journal of biological chemistry. 1994;269:1340–1347. [PubMed] [Google Scholar]
- 7.Alrefai WA, Gill RK. Bile acid transporters: structure, function, regulation and pathophysiological implications. Pharmaceutical research. 2007;24:1803–1823. doi: 10.1007/s11095-007-9289-1. [DOI] [PubMed] [Google Scholar]
- 8.Doring B, Lutteke T, Geyer J, Petzinger E. The SLC10 carrier family: transport functions and molecular structure. Current topics in membranes. 2012;70:105–168. doi: 10.1016/B978-0-12-394316-3.00004-1. [DOI] [PubMed] [Google Scholar]
- 9.Hu NJ, Iwata S, Cameron AD, Drew D. Crystal structure of a bacterial homologue of the bile acid sodium symporter ASBT. Nature. 2011;478:408–411. doi: 10.1038/nature10450. [DOI] [PMC free article] [PubMed] [Google Scholar]
- 10.Jardetzky O. Simple allosteric model for membrane pumps. Nature. 1966;211:969–970. doi: 10.1038/211969a0. [DOI] [PubMed] [Google Scholar]
- 11.Widdas WF. Inability of diffusion to account for placental glucose transfer in the sheep and consideration of the kinetics of a possible carrier transfer. The Journal of physiology. 1952;118:23–39. doi: 10.1113/jphysiol.1952.sp004770. [DOI] [PMC free article] [PubMed] [Google Scholar]
- 12.Dang S, et al. Structure of a fucose transporter in an outward-open conformation. Nature. 2010;467:734–738. doi: 10.1038/nature09406. [DOI] [PubMed] [Google Scholar]
- 13.Huang Y, Lemieux MJ, Song J, Auer M, Wang DN. Structure and mechanism of the glycerol-3-phosphate transporter from Escherichia coli. Science. 2003;301:616–620. doi: 10.1126/science.1087619. [DOI] [PubMed] [Google Scholar]
- 14.Krishnamurthy H, Gouaux E. X-ray structures of LeuT in substrate-free outward-open and apo inward-open states. Nature. 2012;481:469–474. doi: 10.1038/nature10737. [DOI] [PMC free article] [PubMed] [Google Scholar]
- 15.Quistgaard EM, Low C, Moberg P, Tresaugues L, Nordlund P. Structural basis for substrate transport in the GLUT-homology family of monosaccharide transporters. Nature structural & molecular biology. 2013;20:766–768. doi: 10.1038/nsmb.2569. [DOI] [PubMed] [Google Scholar]
- 16.Ressl S, Terwisscha van Scheltinga AC, Vonrhein C, Ott V, Ziegler C. Molecular basis of transport and regulation in the Na(+)/betaine symporter BetP. Nature. 2009;458:47–52. doi: 10.1038/nature07819. [DOI] [PubMed] [Google Scholar]
- 17.Reyes N, Ginter C, Boudker O. Transport mechanism of a bacterial homologue of glutamate transporters. Nature. 2009;462:880–885. doi: 10.1038/nature08616. [DOI] [PMC free article] [PubMed] [Google Scholar]
- 18.Sun L, et al. Crystal structure of a bacterial homologue of glucose transporters GLUT1-4. Nature. 2012;490:361–366. doi: 10.1038/nature11524. [DOI] [PubMed] [Google Scholar]
- 19.Yamashita A, Singh SK, Kawate T, Jin Y, Gouaux E. Crystal structure of a bacterial homologue of Na+/Cl−-dependent neurotransmitter transporters. Nature. 2005;437:215–223. doi: 10.1038/nature03978. [DOI] [PubMed] [Google Scholar]
- 20.Yernool D, Boudker O, Jin Y, Gouaux E. Structure of a glutamate transporter homologue from Pyrococcus horikoshii. Nature. 2004;431:811–818. doi: 10.1038/nature03018. [DOI] [PubMed] [Google Scholar]
- 21.Hunte C, et al. Structure of a Na+/H+ antiporter and insights into mechanism of action and regulation by pH. Nature. 2005;435:1197–1202. doi: 10.1038/nature03692. [DOI] [PubMed] [Google Scholar]
- 22.Lee C, et al. A two-domain elevator mechanism for sodium/proton antiport. Nature. 2013 doi: 10.1038/nature12484. [DOI] [PMC free article] [PubMed] [Google Scholar]
- 23.Kalayil S, Schulze S, Kuhlbrandt W. Arginine oscillation explains Na+ independence in the substrate/product antiporter CaiT. Proceedings of the National Academy of Sciences of the United States of America. 2013 doi: 10.1073/pnas.1309071110. [DOI] [PMC free article] [PubMed] [Google Scholar]
- 24.Verdon G, Boudker O. Crystal structure of an asymmetric trimer of a bacterial glutamate transporter homolog. Nature structural & molecular biology. 2012;19:355–357. doi: 10.1038/nsmb.2233. [DOI] [PMC free article] [PubMed] [Google Scholar]
- 25.Kramer W, Glombik H. Bile acid reabsorption inhibitors (BARI): novel hypolipidemic drugs. Current medicinal chemistry. 2006;13:997–1016. doi: 10.2174/092986706776361003. [DOI] [PubMed] [Google Scholar]
- 26.Chen L, et al. Inhibition of apical sodium-dependent bile acid transporter as a novel treatment for diabetes. American journal of physiology Endocrinology and metabolism. 2012;302:E68–76. doi: 10.1152/ajpendo.00323.2011. [DOI] [PubMed] [Google Scholar]
- 27.Tolle-Sander S, Lentz KA, Maeda DY, Coop A, Polli JE. Increased acyclovir oral bioavailability via a bile acid conjugate. Molecular pharmaceutics. 2004;1:40–48. doi: 10.1021/mp034010t. [DOI] [PubMed] [Google Scholar]
- 28.Shi L, Quick M, Zhao Y, Weinstein H, Javitch JA. The mechanism of a neurotransmitter:sodium symporter--inward release of Na+ and substrate is triggered by substrate in a second binding site. Molecular cell. 2008;30:667–677. doi: 10.1016/j.molcel.2008.05.008. [DOI] [PMC free article] [PubMed] [Google Scholar]
- 29.Levin EJ, Quick M, Zhou M. Crystal structure of a bacterial homologue of the kidney urea transporter. Nature. 2009;462:757–761. doi: 10.1038/nature08558. [DOI] [PMC free article] [PubMed] [Google Scholar]
- 30.Quick M, Javitch JA. Monitoring the function of membrane transport proteins in detergent-solubilized form. Proceedings of the National Academy of Sciences of the United States of America. 2007;104:3603–3608. doi: 10.1073/pnas.0609573104. [DOI] [PMC free article] [PubMed] [Google Scholar]
- 31.Love J, et al. The New York Consortium on Membrane Protein Structure (NYCOMPS): a high-throughput platform for structural genomics of integral membrane proteins. Journal of structural and functional genomics. 2010;11:191–199. doi: 10.1007/s10969-010-9094-7. [DOI] [PMC free article] [PubMed] [Google Scholar]
- 32.Caffrey M, Cherezov V. Crystallizing membrane proteins using lipidic mesophases. Nature protocols. 2009;4:706–731. doi: 10.1038/nprot.2009.31. [DOI] [PMC free article] [PubMed] [Google Scholar]
- 33.Storoni LC, McCoy AJ, Read RJ. Likelihood-enhanced fast rotation functions. Acta crystallographica Section D, Biological crystallography. 2004;60:432–438. doi: 10.1107/S0907444903028956. [DOI] [PubMed] [Google Scholar]
- 34.Emsley P, Cowtan K. Coot: model-building tools for molecular graphics. Acta crystallographica Section D, Biological crystallography. 2004;60:2126–2132. doi: 10.1107/S0907444904019158. [DOI] [PubMed] [Google Scholar]
- 35.Afonine PV, et al. Towards automated crystallographic structure refinement with phenix.refine. Acta crystallographica Section D, Biological crystallography. 2012;68:352–367. doi: 10.1107/S0907444912001308. [DOI] [PMC free article] [PubMed] [Google Scholar]
- 36.Davis IW, et al. MolProbity: all-atom contacts and structure validation for proteins and nucleic acids. Nucleic acids research. 2007;35:W375–383. doi: 10.1093/nar/gkm216. [DOI] [PMC free article] [PubMed] [Google Scholar]
- 37.Ho BK, Gruswitz F. HOLLOW: generating accurate representations of channel and interior surfaces in molecular structures. BMC structural biology. 2008;8:49. doi: 10.1186/1472-6807-8-49. [DOI] [PMC free article] [PubMed] [Google Scholar]
- 38.Humphrey W, Dalke A, Schulten K. VMD: visual molecular dynamics. Journal of molecular graphics. 1996;14:33–38. 27–38. doi: 10.1016/0263-7855(96)00018-5. [DOI] [PubMed] [Google Scholar]
- 39.Kleywegt GJ. Use of non-crystallographic symmetry in protein structure refinement. Acta crystallographica Section D, Biological crystallography. 1996;52:842–857. doi: 10.1107/S0907444995016477. [DOI] [PubMed] [Google Scholar]
Associated Data
This section collects any data citations, data availability statements, or supplementary materials included in this article.