

Abstract
Hypoxia Inducible Factor 1 (HIF-1) promotes fibrosis and inflammation in adipose tissues, while estrogens and Estrogen Receptor α (ERα) have the opposite effect. Here we identify an Estrogen Response Element (ERE) in the promoter of Phd3, which is a negative regulatory enzyme of HIF-1, and we demonstrate HIF-1α is ubiquitinated following 17-β estradiol (E2)/ERα mediated Phd3 transcription. Manipulating ERα in vivo increases Phd3 transcription and reduces HIF-1 activity, while addition of PHD3 ameliorates adipose tissue fibrosis and inflammation. Our findings outline a novel regulatory relationship between E2/ERα, PHD3 and HIF-1 in adipose tissues, providing a mechanistic explanation for the protective effect of E2/ERα in adipose tissue.
Keywords: Obesity, Metabolic syndrome, Estrogen, Adipose tissue, Fibrosis, Inflammation
1. Introduction
Obesity increases the risk of developing cardiovascular disease, cancer, and Type 2 diabetes. Despite their adiposity, some obese individuals do not develop these diseases and otherwise retain good metabolic health [1–3]. This suggests that impairments in adipose tissue (AT) function drive metabolic health independently of body adiposity. Two such impairments, adipose tissue fibrosis and inflammation, are tightly associated with insulin resistance and the metabolic syndrome (MetS) [4–6], while the transcription factor Hypoxia Inducible Factor 1 (HIF-1) induces fibrosis in ATs [7,8]. Additionally, sex hormones and their receptors attenuate AT fibrosis and inflammation [9–13]. In this report we present evidence linking the metabolically protective effect of estrogens and estrogen receptors with HIF-1 activity in AT.
In conditions of caloric excess, adipose tissue expands to accommodate increased lipid stores. If the expansion outpaces the growth of the vasculature, hypoxia in the AT depot develops [14–18]. Hypoxia provokes a transcriptional response regulated by HIF-1, a heterodimeric transcription factor consisting of two subunits, HIF-1α and HIF-1β. Cells constitutively express both subunits; however, HIF-1α is highly sensitive to post-translational degradation [19]. In normoxic conditions, three isoforms of prolyl-4-hydroxylases (PHDs) hydroxylate HIF-1α in an oxygen-dependent manner, targeting it for ubiquitination by the von Hippel–Lindau tumor suppressor protein (pVHL) and E3 ligase complex [20]. Ubiquitinated HIF-1α is ultimately degraded by the proteasome. Under hypoxia, PHDs fail to catalyze HIF-1α hydroxylation due to lack of adequate oxygen. Stabilized HIF-1α translocates to the nucleus and binds HIF Response Elements (HREs) in proangiogenic and metabolism related genes in a wide variety of tissues [19,21].
Importantly, expression of HIF-1 target genes in hypoxia is cell specific [21]. In AT, HIF-1 promotes transcription of pro-fibrotic and inflammatory gene targets, including lysyl oxidase (Lox) and Il6 [7]. Fibrosis and inflammation, in turn, induce systemic insulin resistance. Genetic and pharmacological inhibition of HIF-1 in obese mice reduces AT fibrosis and improves insulin resistance independent of adiposity, implicating HIF-1 as a mediator of metabolically “unhealthy” AT [8].
It is established that adipose tissue fibrosis and inflammation lead to insulin resistance, MetS and Type 2 diabetes (T2DM) [22]. Importantly, sex plays a role in determining susceptibility to these pathologies. For example, women generally possess a higher total body fat percentage than men, but men tend to accrue a higher percentage of visceral adipose tissue (VAT) [23], which increases the risk of MetS and cardiovascular disease [24,25]. Premenopausal women are protected from T2DM and heart disease but lose this protection with increasing visceral adiposity after menopause. Female VAT differs from male VAT, exhibiting less inflammation and fibrosis [9,10].
The metabolic protection afforded by sex can be partially attributed to the actions of estrogens and estrogen receptors (ERs). Estrogens function as ligands for Estrogen Receptor α (ERα), Estrogen Receptor β (ERβ), and the membrane bound G-protein-coupled estrogen receptor (GPER). Once bound, the estrogenic complex recognizes estrogen response elements (EREs) on genomic and mitochondrial DNA and promotes transcription of genes related to proliferation, differentiation and nutrient uptake [26].
Manipulation of estrogens and ERs impacts AT function [9,27]. For example, post-menopausal women experience reduced 17-β estradiol (E2) levels and a corresponding increase of VAT, which is associated with increased risk of T2DM [28,29]. Ovariectomy (OVX) with concomitant reductions in E2 in mice induces AT fibrosis, inflammation and insulin resistance [11,15,30,31]. Similarly, both global knockout of ERα (ERKO) in mice and tissue specific knockdown of ERα in adipocytes in vivo induces fibrosis and insulin resistance, demonstrating ERα mediates E2's actions on fibrosis and inflammation in AT [9,10].
Both ERα and HIF-1 are related to fibrosis and inflammation in adipose tissue, albeit in opposite ways: while ERα improves AT function, HIF-1 worsens it. Here, we demonstrate E2/ERα regulates HIF-1 activity in AT by promoting transcription of a specific Phd, thus providing a mechanistic explanation for the protective effect of E2/ERα against the metabolic impact of HIF-1 activation in AT.
2. Materials and methods
2.1. Animals
ERKO mice were obtained as previously described [27]. Mice were housed in cages with a 12-h light/dark cycle and with ad libitum access to water and standard chow (#2916, Harlan-Teklad). All animal experimental protocols were approved by the Institutional Animal Care and Use Committee of University of Texas Southwestern Medical Center at Dallas. Adipose tissues were collected for immunostaining at 95 days of age; otherwise, mice were 11 or 12 weeks old at time of experiments.
2.2. Cell culture
293T, 3T3-L1 cells, NIH3T3 were obtained from ATCC and cultured as follows: 3T3-L1 cells were grown to confluence Dulbecco's modified Eagle's medium (DMEM, Life Technologies) supplemented with 10% calf serum and antibiotics (penicillin and streptomycin). Differentiation into adipocytes was induced by exposure to differentiation media (DMEM 10% fetal bovine serum (FBS), 0.5 mM 3-isobutyl-1-methylxanthin (IBMX), 0.25 μM dexamethasone and 5 μg/mL insulin) for 48 h. Thereafter, adipocytes were cultured in maintenance media (DMEM supplemented with 10% FBS and 1 μg/mL insulin) changed every 2 days. At Day 8 of differentiation, adipocytes were used for experiments.
2.3. Isolation of adipocyte and stromal-vascular fractions
Dissected fat tissue from each mouse was washed, minced and then digested for 45 min at 37 °C in digestion buffer (100 mM HEPES (pH 7.4), 120 mM NaCl, 50 mM KCl, 5 mM Glucose, 1 mM CaCl2, 1 mg/ml Collagenase D (Roche), and 1.5% BSA). Digested tissue was then diluted with SVF medium (high glucose DMEM/F12 + Glutamax (Invitrogen), 10% FBS) and filtered through a 210 μm cell strainer to remove undigested tissues. The flow-through was then diluted with SVF medium and centrifuged for 5 min at 600 × g to pellet the stromal-vascular (SV) cells and separate the adipocytes. Floated adipocytes were collected and SV cells were re-suspended in SVF medium and filtered through a 40 μm cell strainer to remove clumps and large adipocytes. Following a second centrifugation, SV cells were homogenized in Trizol (Invitrogen) for RNA extraction.
2.4. Plasmids
To generate the mouse HIF-1α expression vector, a cDNA was inserted into pcDNA3.1. The expression vector for hERα was obtained courtesy of Dr. Philip Shaul (UT Southwestern Medical Center, Dallas, TX). HIF response element (HRE)-luciferase vector was obtained courtesy of Dr. Richard Bruick (UT Southwestern Medical Center, Dallas, TX) and myc-Ub1 and pCMV-βgal vectors were obtained courtesy of Kyong Soo Park (Seoul National University, Korea). Estrogen Response Element (ERE)-luciferase was constructed as follows: DNA fragments containing from −2077, −680 to −122 bp from transcription start site of the mouse PHD3 gene were cloned into the region upstream of the luciferase gene of the pGL3-basic vector (Promega) to generate PHD3 reporter candidates (referred to as Candidates −2038, −1832, −1005, −680). Lipofectamin LTX (Invitrogen) and PLUS reagents were used for transfection of all plasmids.
2.5. Construction and treatment of adenovirus
Adenoviruses overexpressing FLAG-ERα (Ad-ERα), PHD3 (Ad-PHD3) and GFP (Ad-GFP) were generated as described previously [32]. Briefly, N-terminal FLAG-tagged hERα, and mouse PHD3 fragments were inserted into pAdTrack-CMV shuttle vector. For shERα (5′-GGACUUGAAUCUCCAUGAU-3′) and shPHD3 (5′-GGAGCCGGCUGGGCAAAUA-3′) adenovirus, we used pRNAT H1.1-adeno vector. Intact shuttle vector of pAdTrack-CMV or negative control sequence inserted pRNAT H1.1-adeno vector (Genescript) were used for construction of control virus (Ad-GFP and AdNS: 5′-GCCUACGCCACCAAUUUCGU-3′). Cloned shuttle vectors were linearized with PmeI and then subjected to electrophoration for homologous recombination between shuttles and AdEasy-1 viral vector in AdEasier (Stratagene) electrocompetent cells. Adenoviral vectors were linearized with PacI and were amplified using AD 293 cells (Stratagene). Viruses were purified by CsCl density gradient ultracentrifugation and dialyzed within 10% glycerol/1XPBS solution. Viral particle titer was determined by GFP-positive cell counting method. 10ˆ9 pfu of adenoviral particles were injected into mouse inguinal fat pads. In each experiment, the selection of which fat pad received the expression/interference or control vector was randomized. Mice were sacrificed 6 days after injections. mRNA's were quantified via qPCR and averaged for each group. The specifics of each injection experiment are as follows:
For ERα overexpression, 11-week-old female WT C57/Bl6 (n = 9) and female ERKO mice (n = 11) were injected with ERα overexpression vector (Ad-ERα) in one inguinal AT pad and a control vector (Ad-GFP) in the contra-lateral pad.
For ERα interference, 11-week-old female WT C57/Bl6 mice (n = 9) were injected with ERα interference vector (shERα) in one inguinal AT pad and a control vector (shNS) in the contra-lateral pad.
For PHD3 overexpression, 12-week-old female C57/Bl6 (n = 7) and female ERKO mice (n = 8) were injected with PHD3 overexpression vector (Ad-PHD3) in one inguinal AT pad and a control vector (Ad-GFP) in the contra-lateral pad.
For PHD3 interference, 12-week-old female C57/Bl6 mice (n = 7) were injected with PHD3 interference vector (shPHD3) in one inguinal fat pad and a control vector (shNS) in the contra-lateral pad.
2.6. Luciferase reporter assay
For HRE luciferase assay, NIH3T3 cells were plated in 24-well culture plates and transfected with 300 ng of HRE Luc and 20 ng pCMV-βgal and with or without 100 ng of pcDNA-hERα. Cells were then incubated with or without E2 (10 nM) for 48 h in phenol red-free DMEM supplemented with 2% FBS. Two days after transfection, cells were harvested using lysis buffer and luciferase activity was determined according to manufacturer's instruction (Promega). HRE luciferase activities were normalized to the activity of HRE Luc in the absence of ERα expression.
For Phd3 promoter ERE luciferase assay, 293T cells were plated in 24-well culture plates and transfected with 300 ng of ERE Luc and 20 ng pCMV-βgal with or without 200 ng shERα. Cells were then incubated with either E2 (10 nM) or propyl pyrozole triol (PPT) (10 nM) (Cayman Chemical). After 48 h cells were harvested using lysis buffer and luciferase activity was determined according to manufacturer's instruction (Promega). ERE luciferase activities were normalized to the activity of PHD3 (−2077) Luc in the absence of ERα expression, E2 or PPT. For both experiments, relative transfection efficiency was determined with β-galactosidase assay.
2.7. Chromatin immunoprecipitation (ChIP)
ChIP was carried out in differentiated 3T3-L1 adipocytes or NIH3T3 cells using the EZ-ChIP™ Chromatin Immunoprecipitation Kit (Millipore) according to manufacturer's instructions. Briefly, cells were treated with either 0 or 10 nM E2 or PPT (10 nM) for 18 h. Cells were then treated with 1% formaldehyde to induce protein–chromatin cross-linking; 0.125 M glycine was used to quench unreacted formaldehyde. Cells were lysed and lysates were sonicated. Protein–chromatin fragments were immunoprecipitated with either ERα antibody (Santa Cruz, Santa Cruz, CA, ERα MC-20, #sc-542) or IgG (Santa Cruz) and selected with Protein G sepharose (Millipore). After reverse cross-linking, DNA was purified for detection using PCR. PCR primers used delimit four candidate EREs in the PHD3 promoter and are listed in Supplementary Table 1.
2.8. Ubiquitination and immunoblotting
NIH3T3 cells were plated in 6-cm dishes and transfected with pcDNA-mHIF1α, myc-Ub1 and pFlag-ERα, shPHD3 plasmids. After incubation for 48 h, cell lysates were obtained with lysis buffer (20 mM Tris (pH7.4), 1% NP40, 5 mM EDTA, 10 mM Na4P2O7, 100 mM NaF, 2 mM Na3VO4, 5 μg/ml aprotinin, 5 μg/mg leupeptin, 1 mM PMSF). Lysates were briefly sonicated and then incubated with 2 μg of HIF1α antibody (Novus, Littleton, CO, NB100-449) for 6 h and protein G sepharose (GE Healthcare) for another 2 h. Washed precipitates were immunoblotted with anti-Myc antibody (Sigma). Collected inguinal ATs were homogenized using a TissueLyser LT (Qiagen) and steel beads. The protein bands were detected with species-specific secondary antibodies (Santa Cruz) conjugated with infrared dyes and visualized with Li-Cor Odyssey infrared scanner (Li-Cor Bioscience).
2.9. Immunohistochemistry
Adipose tissues were collected from 95 day old mice and fixed overnight in 10% formalin. The Molecular Pathology Core at UT Southwestern Medical Center embedded tissues with paraffin, sectioned and immunostained with PHD3 antibody (Novus, NB100-303) or ERα antibody (Santa Cruz, ERα MC-20, #sc-542).
2.10. qPCR
Adipose tissues were excised and homogenized in TRIzol using a TissueLyser LT (Qiagen) and steel beads. For both cell culture and adipose tissue, total RNAs were extracted in TRIzol (Invitrogen) and isolated using the RNeasy RNA extraction kit (Qiagen) according to the manufacturer's instructions. The quantity and quality of the RNA were determined by absorbance at 260/280 nm. cDNA was prepared by reverse transcribing 1 μg RNA with SuperScript III reverse transcriptase (Invitrogen) and oligo(dT) (Invitrogen). Quantitative real-time PCRs (qPCRs) were performed with TaqMan or SYBR gene-specific primers on an ABI Prism 7900 HT sequence detection system (Applied Biosystems) using technical duplicates. Primers sequences are listed in Supplementary Table 2. The relative amounts of all mRNAs were calculated by using the comparative threshold cycle (CT) method. Glyceraldehyde-3-phosphate dehydrogenase (GAPDH), β-2 microglobulin (B2M) or hypoxanthine guanine phosphoribosyl transferase (HPRT) mRNA were used as the endogenous controls.
2.11. Statistical analysis
All the results are presented as means ± standard error of the mean (s.e.m.). Statistical significance between groups was determined by two-tailed Student's t-test or one-way ANOVA. P values <0.05 were considered statistically significant. Statistical analyses and graphs were generated using GraphPad prism6 software.
3. Results
3.1. ERα reduces HIF-1 activity in vitro
Initially we demonstrated that there is a sexual dimorphism in ERα protein and message in adipose tissue, with males having significant reductions in ERα relative to females (Figure 1B and C). We hypothesized that reduction of ERα in ATs promotes HIF-1 transcriptional activity. To evaluate this effect, we analyzed HIF-1 HRE luciferase in NIH3T3 cells in vitro. Addition of both ERα and E2 significantly decreased HIF-1 promoter driven luciferase activity (Figure 1A), whereas the addition of ERα alone did not have an effect, suggesting ligand dependence.
Figure 1.
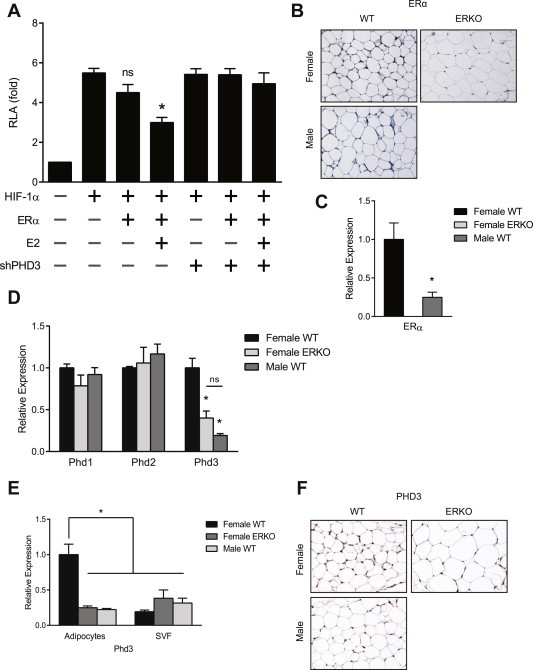
ERα expression reduces HIF-1 activity in vitro. (A) HRE luciferase activity in NIH3T3 cells transfected with the HRE luciferase vector (HRE Luc) and the expression vectors of Estrogen Receptor alpha (ERα), small hairpin PHD3 (shPHD3) and β-galactosidase. The luciferase activities were normalized to the activity of HRE Luc in the absence of Erα expression and 17-β-estradiol (E2). Data shown as the mean ± s.e.m. of 7 independent experiments. *, P < 0.05 versus the activity of HRE Luc without Erα or E2 by 1-way ANOVA. (B) Representative immunohistochemical image of ERα protein in visceral AT from female and male C57/Bl6 wild type (WT) mice. (C) qPCR quantification of Erα mRNAs from female (n = 5) and male (n = 5) C57/Bl6 WT mice. Data shown as mean ± s.e.m. *, P < 0.05 by two-tailed Student's t test relative to female WT. (D) qPCR quantification of Phd 1, 2 and 3 mRNAs from perigonadal adipose tissue of female WT, male WT and female ERKO mice (n = 4). Data shown as mean ± s.e.m. *, P < 0.05 by two-tailed Student's t test relative to female WT. (E) qPCR quantification of expression of Phd3 mRNA in adipocyte and stromal-vascular fractions of inguinal AT. *, P < 0.05 by two-tailed Student's t test relative to female WT. (F) Representative immunohistochemical image of PHD3 protein in visceral AT from female, male, and female ERKO mice. See also Supplementary Figure 1.
E2 and ERs positively regulate expression of Phd1 and Phd2 in breast cancer and epithelial cells, respectively [33]. Since Phds are critical regulators of HIF-1 activity, we examined how E2/ERα influences Phds expression in perigonadal AT. E2/ERα positively regulated Phd3 but not Phd1 or Phd2 mRNA in perigonadal AT of lean, weight matched, intact/cycling female WT, male WT and female ERα knockout (ERKO) mice (Figure 1D). To determine if a functional relationship exists between ERα, Phd3 and HIF-1 activity, we inhibited Phd3 using RNA interference. Knockdown of Phd3 abrogated the effect of E2/ERα on HIF-1 promoter driven luciferase, demonstrating that Phd3 is required for reduction of HIF-1 activity (Figure 1A).
Adipocytes represent only a fraction of the overall cell population of ATs [34]. To determine if Phd3 is expressed specifically in adipocytes, we separated whole AT into adipocyte-rich and adipocyte-poor fractions (SVF). The adipocyte-rich fraction strongly expressed adiponectin, an adipocyte-specific adipokine, while the adipocyte-poor fraction did not, confirming a clear separation by cell type (Supplementary Figure 1). Female WT adipocytes expressed significantly more Phd3 mRNA than either female ERKO or male WT (Figure 1E). Immunohistochemistry for PHD3 in perigonadal AT verified the up-regulation of protein levels in adipocytes (Figure 1F), further demonstrating that females have higher levels of PHD3 than males or ERKO mice.
3.2. ERα regulates HIF-1 activity by direct transcriptional activation of Phd3
Next, we utilized chromatin immunoprecipitation (ChIP) and luciferase reporter assays to determine whether ERα directly activates Phd3 gene expression. Computational analysis revealed potential EREs in the proximal promoter region of Phd3 (Figure 2A). Location analysis by ChIP-qPCR revealed that ERα binds to an ERE 599 bp upstream of the Phd3 promoter (Candidate −599) in differentiated 3T3-L1 adipocytes, but not at other potential EREs (Figure 2B, Supplementary Table 1). Treatment with E2 or PPT, an ERα-specific agonist, significantly increased ERα–ERE binding (Figure 2B), indicating a ligand-dependent effect. In luciferase reporter assays where the Phd3 promoter drives luciferase expression, only constructs including Candidate −599 responded significantly to E2/ERα, further indicating a ligand-dependent effect on Phd3 transcription (Figure 2C, Supplementary Table 1).
Figure 2.
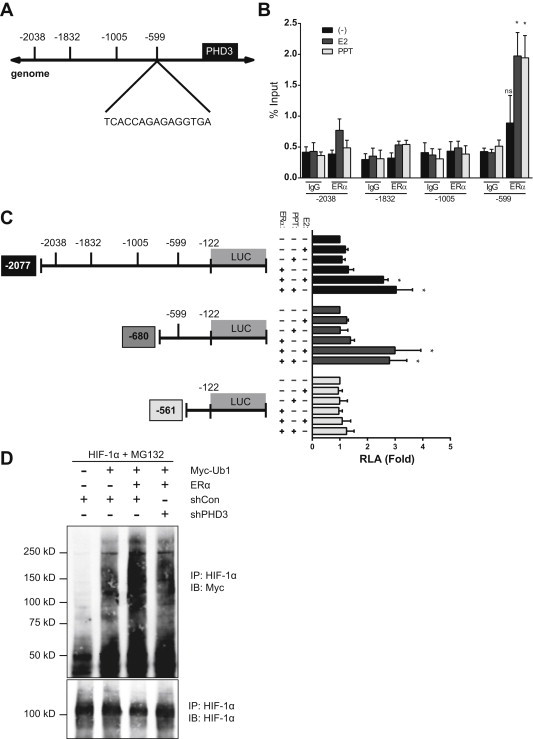
Identification of an ERE in the Phd3 promoter. (A) Putative ERE in promoter region of mouse Phd3 gene. (B) ChIP assay of differentiated 3T3-L1 cells treated with and without E2 (10 nM) or PPT (10 nM) for 48 h. Immunoprecipitation was performed using control immunoglobulin G (IgG) or anti-ERα antibody (anti-ERα). 5% of the cell lysates used for immunoprecipitation was used as the input for a positive control; polII binding of the cfos promoter ERE were used as positive controls (Supplementary Figure 4). PCR was performed using the primers described in Materials and methods (See Supplementary Table 1). Data are representative of results from 3 independent experiments. *, P < 0.05 by 1-way ANOVA (C) ERE luciferase activity in 293T cells transfected with candidate Phd3 promoter vectors (Phd3 (−2077) Luc, Phd3 (−680 Luc), Phd3 (−561) Luc) and the expression vectors of ERα and β-galactosidase and then incubated with E2 (10 nM) or PPT (10 nM) for 48 h. The luciferase activities were normalized to the activity of Phd3 (−2077) Luc in the absence of ERα expression, E2 or PPT. Data shown as the mean ± s.e.m. of 4 independent experiments. *, P < 0.05 by 1-way ANOVA. (D) HIF-1α ubiquitination in NIH3T3 cells transfected with expression vectors for pcDNA-mHIF1α, myc-Ub1, pFlag-ERα and shPHD3. After incubation with MG132 (10 μM) for 6 h, cell lysates were immunoprecipitated with HIF-1α antibody, and then immunoblotted with Myc antibody. Data are representative of results from 3 independent experiments. See also Supplementary Figure 2 and Table 1.
PHDs target HIF-1α for recognition and ubiquitination by pVHL [20]. In order to determine if the ERα–Phd3 regulatory axis leads to HIF-1α ubiquitination, we blocked proteosomal activity with MG132 and measured ubiquitinated HIF-1α in the presence and absence of ERα. Addition of ERα increased HIF-1α ubiquitination; this effect depended on Phd3 (Figure 2D, Supplementary Figure 2B).
3.3. ERα increases PHD3 transcription in vivo
To assess the effect of ERα on Phd3 expression in vivo, we injected the inguinal ATs of WT and ERKO mice with ERα overexpressing or silencing vectors (Supplementary Figure 3). Importantly, all of these experiments were done in intact female mice, without manipulation of the hormonal milieu. At baseline, ERKO ATs expressed less Phd3 mRNA than WT (Figure 3B). Additionally, ERKO ATs had higher mRNA levels of Lox, a direct transcriptional target of HIF-1, as well as markers of inflammation (Figure 3C and D). In ERKO mice, the ERα overexpression vector increased ERα expression (Figure 3A). Restoration of ERα directly in AT increased expression of Phd3, but not Phd1 or Phd2 mRNAs (Figure 3B), and reduced expression of inflammatory genes, as well as Lox, to WT levels (Figure 3C and D). In female WT mice, knockdown of ERα produced the opposite effect: Phd3 expression decreased (Figure 4A), while expression of Lox and inflammation markers significantly increased (Figure 4B and C).
Figure 3.
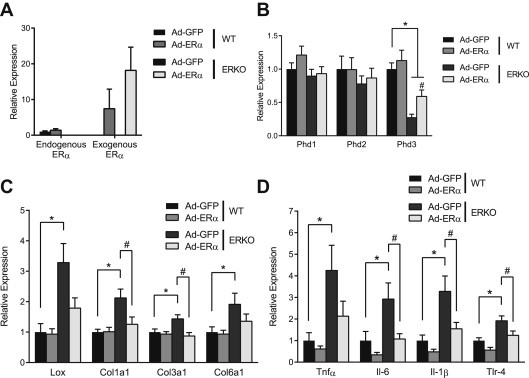
Erα reverses effects of HIF-1 in ERKO AT. 11-week-old female WT C57/Bl6 (n = 9) and female ERKO mice (n = 11) were injected with ERα overexpression adenovirus (Ad-ERα) in one inguinal AT pad and a control vector (Ad-GFP) in the contra-lateral pad. qPCR quantification of (A) Endogenous Erα, exogenous Erα, (B) Phd1, Phd2, Phd3, (C) Lox, Col1α1 and Col3α1 Col6α1 and (D) TNFα, IL6 and IL1β and TLR4 mRNA in inguinal ATs. Data shown as mean ± s.e.m. *, P < 0.05 by two-tailed Student's t-test relative to WT Ad-GFP. #, P < 0.05 by two-tailed Student's t-test relative to ERKO Ad-GFP. See also Supplementary Figures 3 and 4.
Figure 4.
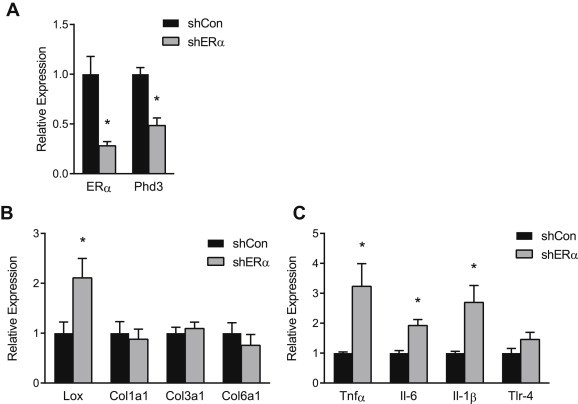
Erα interference down-regulates Phd3 and promotes HIF-1, fibrosis and inflammation in WT AT. 11-week-old female WT C57/Bl6 mice (n = 9) were injected with ERα interference adenovirus (shERα) in one inguinal AT pad and a control vector (shNS) in the contra-lateral pad. qPCR quantification of (A) Erα and Phd3, (B) Lox, Col1α1 and Col3α1 Col6α1 and (C) TNFα, IL6 and IL1β and TLR4 mRNA in inguinal ATs. Data shown as mean ± s.e.m. *P < 0.05 by two-tailed Student's t-test relative to shCon. See also Supplementary Figures 3 and 4.
3.4. Phd3 reverses the effects of HIF-1 activity in ERKO AT
Dysfunctional AT is characterized by increased fibrosis and inflammation [9,10]. To demonstrate the ability of Phd3 to ameliorate fibrosis and inflammation in AT, we performed Phd3 gain and loss of function experiments in vivo as previously described. Addition of Phd3 to ERKO AT significantly reduced expression of Col1α1 and Col3α1 mRNAs (Figure 5A and C). Consistent with a reduction in HIF-1 activity, addition of Phd3 decreased Lox and IL6 mRNAs (Figure 6B and C). Knockdown of Phd3 in WT mice did not otherwise affect ERα levels (Figure 6A) and induced markers of fibrosis and inflammation, particularly Lox and Col1α1 and Col3α1, as well as Tnfα and Tlr-4 mRNAs (Figure 6B and C).
Figure 5.
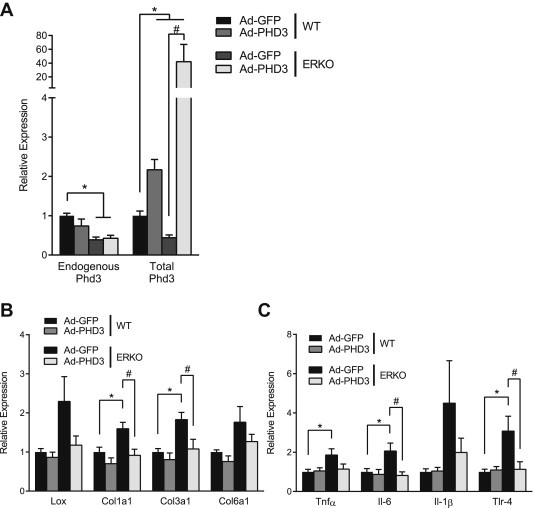
Phd3 reverses the effects of HIF-1 activity in ERKO AT. 12-week-old female C57/Bl6 (n = 7) and female ERKO mice (n = 8) were injected with Phd3 overexpression adenovirus (Ad-PHD3) in one inguinal AT pad and a control adenovirus (Ad-GFP) in the contra-lateral pad. (A) Endogenous Phd3 and total Phd3 mRNAs in inguinal ATs after injections. (B) qPCR quantification of Lox, Col1α1 and Col3α1 Col6α1 and (C) TNFα, IL6 and IL1β and TLR4 mRNA in inguinal ATs. Data shown as mean ± s.e.m. *, P < 0.05 by two-tailed Student's t-test relative to WT Ad-GFP. #, P < 0.05 by two-tailed Student's t-test relative to ERKO Ad-GFP. See also Supplementary Figures 3 and 4.
Figure 6.
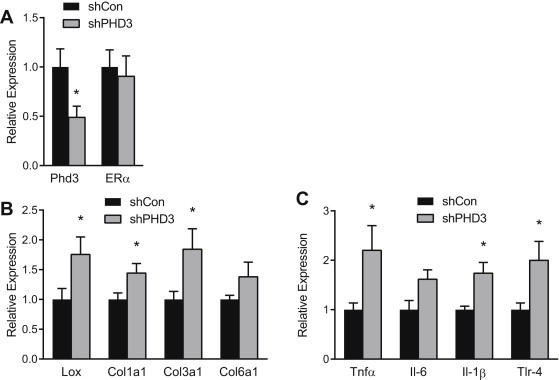
Phd3 interference promotes HIF-1, fibrosis and inflammation in WT AT. 12-week-old female C57/Bl6 mice (n = 7) were injected with Phd3 interference adenovirus (shPHD3) in one inguinal fat pad and a control vector (shNS) in the contra-lateral pad. qPCR quantification of (A) Phd3 and Erα, (B) Lox, Col1α1 and Col3α1 Col6α1 and (C) TNFα, IL6 and IL1β and TLR4 mRNA in inguinal ATs. Data shown as mean ± s.e.m. *P < 0.05 by two-tailed Student's t-test relative to shNS. See also Supplementary Figures 3 and 4.
4. Discussion
E2 and ERs protect against inflammation and insulin resistance in AT [3,9,10]; however, the mechanism underlying this phenomenon is unknown. HIF-1 activity produces fibrosis, inflammation and insulin resistance in AT [6–8]. In this report we link E2/ERα and HIF-1, demonstrating that E2/ERα directly promotes transcription of Phd3, a key enzyme in HIF-1 regulation, thus reducing markers of fibrosis and inflammation. The discovery of an E2/ERα dependent mechanism of HIF-1 regulation contributes to our understanding of the sexual dimorphism evident in AT function.
Previous reports describe an association between E2/ERα and HIF-1 protein levels. For example, removal of ovarian estrogens by OVX in rats results in hypoxic visceral AT and increased HIF-1 activity [15], while ERα overexpression in MCF-7 cells down-regulates HIF-1 activity [15,35]. Consistent with these studies, we demonstrate that E2/ERα reduces HIF-1 transcriptional activity in vitro and in an AT specific manner in vivo. Recently, Miyauchi et al. showed that E2 treatment destabilizes HIF-1α in osteoclasts in vitro, and that osteoclast specific deletion of ERα stabilizes HIF-1 in vivo [36]. Interestingly, that study found no evidence of increased ubiquitination or proteosomal degradation of HIF-1α, concluding that the regulatory mechanism was not related to the classical HIF-1α ubiquitination pathway [36]. However, we found that E2/ERα increases ubiquitination of HIF-1α, with consequent reduction of HIF-1 activity in AT.
Our data extends the association of E2/ERα with HIF-1 to include a heretofore uncharacterized interaction with prolyl-4-hydroxylase enzymes (Phds). The Phd family comprises three structurally similar and functionally overlapping enzymes, two of which have been associated with ER activity in tissues other than AT. E2 positively regulates Phd1 in breast cancer cells [33], while ERβ promotes Phd2 transcription in epithelial cells [37]. Therefore, we hypothesized that E2/ERα may affect HIF-1 activity via regulation of one of the Phd genes. We found interference with Phd3 induces HIF-1 activity (Figure 1A); neither Phd1 nor Phd2 were regulated by sex, estrogens, or ERα in our models (Figure 1D). Examination of ERKO and WT tissues revealed that Phd3 mirrors ERα levels in ATs and, specifically, in adipocytes: Female WT ATs are enriched in E2/ERα and Phd3 compared to males (which have substantially lower E2/ERα) and ERKO (which lack ERα) ATs (Figure 1B–F). Moreover, selective knockdown of ERα in the inguinal AT of WT mice proves that the disparity in Phd3 depends on ERα and is independent of body adiposity (Figure 4). Importantly, loss of ERα induces Lox, a known HIF-1 target [38], showing that HIF-1 protein is, indeed, transcriptionally active in these cells under these conditions (Figure 4B). Finally, ERβ can bind similar EREs to ERα, albeit with less affinity [39]. As such, it is not unreasonable to suspect that ERβ could promote Phd3 transcription. However, in ERKO mice, which have ERβ, we observed reduced Phd3 expression, indicating that ERβ does not influence this pathway appreciably (Supplementary Figure 4A–D). This does not, however, completely rule out a modulatory role for ERβ in mediating Phd3 transcription.
We observed that ERα only reduced HRE luciferase significantly in the presence of E2 (Figure 1A), suggesting that the ERα–Phd3 pathway is ligand-dependent. In our subsequent ChIP and ERE luciferase experiments, E2 and the ERα agonist PPT significantly induce ERE binding as well as promoter driven transcription. Since PPT is an ERα specific agonist, we conclude that ERα-related transcription of Phd3 is ligand mediated. This is consistent with conventional mechanisms of ER gene transcription [26,40] and with the observation that decrements in AT function and health accompany declining levels of ovarian estrogens in post-menopausal women [28,29].
Studies have concluded that PHD3 preferentially hydroxylates HIF-2α rather than HIF-1α and only becomes a significant contributor to HIF-1 regulation in hypoxic conditions [41,42]. Our results do not refute these findings; rather, taken with our identification of an ERE in the Phd3 promoter and findings that ERα and Phd3 are predominately expressed in the adipocyte fraction of adipose tissue, they demonstrate a novel regulatory relationship between E2/ERα and Phd3 in adipocytes.
While obesity-induced adipose tissue hypoxia has been implicated as the root cause of HIF-1 activation and consequent metabolic dysfunction, the transcriptional program driven by HIF-1 in AT requires neither obesity nor hypoxia. For example, in transgenic models, HIF-1 overexpression in normoxia led to similar increases in fibrosis, inflammation and insulin resistance as observed in obese, hypoxia models [7,8]. We have also recently reported that fibrosis and inflammation characterize the AT of both lean and obese ERKO mice as well as in mice with a selective knockdown of ERα from adipocytes [9]. Therefore, we determined if in vivo manipulation of the ERα–Phd3 transcriptional mechanism could affect HIF-1 activity to induce similar markers of fibrosis and inflammation in lean mice. Importantly, inhibition of Phd3 in lean, WT mice promotes Lox and collagen expression, as well as Tnfα and Tlr-4 expression, demonstrating that Phd3 alone can protect from AT fibrosis and inflammation (Figure 6B and C). To further demonstrate the critical roles of E2/ERα in regulating adipose tissue inflammation and fibrosis, we determined that restoration of ERα in ERKO (which have elevated circulating levels of E2) reduce both Lox and Tnfα (Figure 3B and C), and that restoration of Phd3 in ERKO also rescues the AT phenotype (Figure 5B and C).
In addition to serving as a proxy for HIF-1 activity, Lox induction has important metabolic consequences in AT. Lox is a HIF-1 sensitive oxidase that crosslinks fibrils and insolubilizes components of the ECM [38]. Previous reports implicate Lox in ECM remodeling and inflammation, leading to impaired insulin sensitivity and glucose intolerance in AT [7,38]. Indeed, inhibition of Lox reversed approximately 900 genes identified by microarray as dysregulated in HIF-1 overexpressing transgenic mice [7]. In our model, we observed greater expression of Lox in ERKO adipose at baseline, while restoration of ERα or Phd3 was sufficient to reverse both Lox and inflammatory markers (Figures 3 and 5). Loss of AT ERα or Phd3 in WT female mice replicated these findings, further evidence that the ERα–Phd3 mechanism operates in a physiologically relevant way (Figures 4 and 6). The anti-fibrotic effect of ERα restoration was more pronounced than the pro-fibrotic effect of ERα knockdown. We attribute this to the fact ERα was restored in ERKO mice, which are known to have elevated levels of E2 [27], and the presence of ligand strongly induces the ERα–Phd3 transcriptional mechanism. Conversely, knockdown of ERα in the WT mice does not result in complete removal of ERα from AT. The ERα–Phd3 pathway is weakened, but not completely absent, leading to a modest elevation of HIF-1 induced fibrosis.
While HIF-1 has been studied extensively in the context of cancer and hypoxic tumor growth, its contributions to normoxic metabolism are less clear. Indeed, precise calculations of the level of oxygenation required to attenuate HIF-1 activity are technically difficult and inconsistently reported in the literature [16]. Presently, it is unclear if E2/ERα promotes a more robust response to chronic AT hypoxia, thus mitigating the deleterious effects of HIF-1 activity in obesity, or if higher basal expression of Phd3 in ERα-rich ATs protects against such activity. Evidence suggests that Phd3 is more strongly induced, as well as retains its catalytic ability under prolonged hypoxia better than the other Phd isoforms [42]. Under non-reversible reaction conditions, it is reasonable to hypothesize that adipocytes expressing ERα will accumulate more PHD3, thereby reducing HIF-1 driven fibrosis and inflammation. Accordingly, investigations using hypoxia or hypoxia mimetics should be pursued to more precisely define the contribution of ERα induced Phd3 expression to the hypoxic response.
In addition to HIF-1 regulation, Phd3 has been linked to several important cellular pathways. Loss of Phd3 has been shown to decrease cell adhesion proteins, increasing the metastatic potential of tumors, while expression of Phd3 correlates with favorable tumor prognosis [43,44]. Phd3 has also been implicated in the regulation of apoptosis in a variety of cell lines [45]. The transcriptional relationship between E2/ERα and Phd3 sheds light on these and other Phd-related pathways.
Furthermore, demonstration that Phd3 inhibition is pro-fibrotic and pro-inflammatory in AT has important clinical implications. Recent reports suggest that Phd3 inhibition improves liver insulin sensitivity [46], while clinical studies are currently underway to assess the efficacy of Phd inhibition in the treatment of a variety of pathologies, including anemia and peripheral artery disease [47]. Since fibrosis and inflammation have been causally linked to insulin insensitivity, MetS and T2DM, our studies indicate that loss of Phd3 functionality in AT could have negative metabolic consequences. The effect of Phd inhibition interventions on AT function must be taken into account, especially for long-term treatments.
5. Conclusions
Here we demonstrate that E2/ERα is a direct transcriptional regulator of Phd3, a key regulatory enzyme in the HIF-1 degradation pathway. HIF-1 activity promotes adipose tissue fibrosis and inflammation. E2/ERα increases Phd3 transcription, reducing overall HIF-1 activity. Thus, ATs are protected from HIF-1 induced fibrosis and inflammation by an E2/ERα dependent, Phd3 mediated mechanism, as depicted in the cartoon summarizing the proposed mechanism (Figure 7). The revelation that E2/ERα participates in a direct regulatory pathway with Phd3 and HIF-1 provides a mechanistic explanation for the protective effect of E2/ERα regarding AT function.
Figure 7.
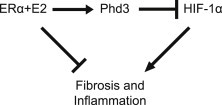
Cartoon summarizing the proposed mechanism. E2/ERα increases Phd3 transcription, reducing overall HIF-1 activity and protecting AT from HIF-1 induced fibrosis and inflammation.
Conflict of interest
None declared.
Appendix A. Supplementary data
References
- 1.Lackey D.E., Burk D.H., Ali M.R., Mostaedi R., Smith W.H., Park J. Contributions of adipose tissue architectural and tensile properties toward defining healthy and unhealthy obesity. American Journal of Physiology. Endocrinology and Metabolism. 2014;306:E233–E246. doi: 10.1152/ajpendo.00476.2013. [DOI] [PMC free article] [PubMed] [Google Scholar]
- 2.Asterholm I.W., Halberg N., Scherer P.E. Mouse models of lipodystrophy key reagents for the understanding of the metabolic syndrome. Drug Discovery Today: Disease Models. 2007;4:17–24. doi: 10.1016/j.ddmod.2007.10.003. [DOI] [PMC free article] [PubMed] [Google Scholar]
- 3.Nickelson K.J., Stromsdorfer K.L., Pickering R.T., Liu T.W., Ortinau L.C., Keating A.F. A comparison of inflammatory and oxidative stress markers in adipose tissue from weight-matched obese male and female mice. Experimental Diabetes Research. 2012;2012:859395. doi: 10.1155/2012/859395. [DOI] [PMC free article] [PubMed] [Google Scholar]
- 4.Guilherme A., Virbasius J.V., Puri V., Czech M.P. Adipocyte dysfunctions linking obesity to insulin resistance and type 2 diabetes. Nature Reviews Molecular Cell Biology. 2008;9:367–377. doi: 10.1038/nrm2391. [DOI] [PMC free article] [PubMed] [Google Scholar]
- 5.Divoux A., Tordjman J., Lacasa D., Veyrie N., Hugol D., Aissat A. Fibrosis in human adipose tissue: composition, distribution, and link with lipid metabolism and fat mass loss. Diabetes. 2010;59:2817–2825. doi: 10.2337/db10-0585. [DOI] [PMC free article] [PubMed] [Google Scholar]
- 6.Khan T., Muise E.S., Iyengar P., Wang Z.V., Chandalia M., Abate N. Metabolic dysregulation and adipose tissue fibrosis: role of collagen VI. Molecular and Cell Biology. 2009;29:1575–1591. doi: 10.1128/MCB.01300-08. [DOI] [PMC free article] [PubMed] [Google Scholar]
- 7.Halberg N., Khan T., Trujillo M.E., Wernstedt-Asterholm I., Attie A.D., Sherwani S. Hypoxia-inducible factor 1alpha induces fibrosis and insulin resistance in white adipose tissue. Molecular Cell Biology. 2009;29:4467–4483. doi: 10.1128/MCB.00192-09. [DOI] [PMC free article] [PubMed] [Google Scholar]
- 8.Sun K., Halberg N., Khan M., Magalang U.J., Scherer P.E. Selective inhibition of hypoxia-inducible factor 1alpha ameliorates adipose tissue dysfunction. Molecular Cell Biology. 2013;33:904–917. doi: 10.1128/MCB.00951-12. [DOI] [PMC free article] [PubMed] [Google Scholar]
- 9.Davis K.E., Neinast M.D., Sun K., Skiles W.M., Bills J.D., Zehr J.A., Clegg D.J. The sexually dimorphic role of adipose and adipocyte estrogen receptors in modulating adipose tissue expansion, inflammation, and fibrosis. Molecular Metabolism. 2013;2:227–242. doi: 10.1016/j.molmet.2013.05.006. [DOI] [PMC free article] [PubMed] [Google Scholar]
- 10.Ribas V., Nguyen M.T., Henstridge D.C., Nguyen A.K., Beaven S.W., Watt M.J. Impaired oxidative metabolism and inflammation are associated with insulin resistance in ERalpha-deficient mice. American Journal of Physiology. Endocrinology and Metabolism. 2010;298:E304–E319. doi: 10.1152/ajpendo.00504.2009. [DOI] [PMC free article] [PubMed] [Google Scholar]
- 11.Rogers N.H., Perfield J.W., 2nd, Strissel K.J., Obin M.S., Greenberg A.S. Reduced energy expenditure and increased inflammation are early events in the development of ovariectomy-induced obesity. Endocrinology. 2009;150:2161–2168. doi: 10.1210/en.2008-1405. [DOI] [PMC free article] [PubMed] [Google Scholar]
- 12.Stubbins R.E., Holcomb V.B., Hong J., Nunez N.P. Estrogen modulates abdominal adiposity and protects female mice from obesity and impaired glucose tolerance. European Journal of Nutrition. 2012;51:861–870. doi: 10.1007/s00394-011-0266-4. [DOI] [PubMed] [Google Scholar]
- 13.Stubbins R.E., Najjar K., Holcomb V.B., Hong J., Nunez N.P. Oestrogen alters adipocyte biology and protects female mice from adipocyte inflammation and insulin resistance. Diabetes, Obesity and Metabolism. 2012;14:58–66. doi: 10.1111/j.1463-1326.2011.01488.x. [DOI] [PMC free article] [PubMed] [Google Scholar]
- 14.Rausch M.E., Weisberg S., Vardhana P., Tortoriello D.V. Obesity in C57BL/6J mice is characterized by adipose tissue hypoxia and cytotoxic T-cell infiltration. International Journal of Obesity (London) 2008;32:451–463. doi: 10.1038/sj.ijo.0803744. [DOI] [PubMed] [Google Scholar]
- 15.Xu J., Xiang Q., Lin G., Fu X., Zhou K., Jiang P. Estrogen improved metabolic syndrome through down-regulation of VEGF and HIF-1alpha to inhibit hypoxia of periaortic and intra-abdominal fat in ovariectomized female rats. Molecular Biology Reports. 2012;39:8177–8185. doi: 10.1007/s11033-012-1665-1. [DOI] [PubMed] [Google Scholar]
- 16.Hodson L. Adipose tissue oxygenation: effects on metabolic function. Adipocyte. 2014;3:75–80. doi: 10.4161/adip.27114. [DOI] [PMC free article] [PubMed] [Google Scholar]
- 17.Hosogai N., Fukuhara A., Oshima K., Miyata Y., Tanaka S., Segawa K. Adipose tissue hypoxia in obesity and its impact on adipocytokine dysregulation. Diabetes. 2007;56:901–911. doi: 10.2337/db06-0911. [DOI] [PubMed] [Google Scholar]
- 18.Ye J., Gao Z., Yin J., He Q. Hypoxia is a potential risk factor for chronic inflammation and adiponectin reduction in adipose tissue of ob/ob and dietary obese mice. American Journal of Physiology. Endocrinology and Metabolism. 2007;293:E1118–E1128. doi: 10.1152/ajpendo.00435.2007. [DOI] [PubMed] [Google Scholar]
- 19.Huang L.E., Gu J., Schau M., Bunn H.F. Regulation of hypoxia-inducible factor 1alpha is mediated by an O2-dependent degradation domain via the ubiquitin-proteasome pathway. Proceedings of the National Academy of Sciences of the United States of America. 1998;95:7987–7992. doi: 10.1073/pnas.95.14.7987. [DOI] [PMC free article] [PubMed] [Google Scholar]
- 20.Bruick R.K., McKnight S.L. A conserved family of prolyl-4-hydroxylases that modify HIF. Science. 2001;294:1337–1340. doi: 10.1126/science.1066373. [DOI] [PubMed] [Google Scholar]
- 21.Semenza G.L. Hypoxia-inducible factor 1 and cardiovascular disease. Annual Review of Physiology. 2014;76:39–56. doi: 10.1146/annurev-physiol-021113-170322. [DOI] [PMC free article] [PubMed] [Google Scholar]
- 22.Sun K., Kusminski C.M., Scherer P.E. Adipose tissue remodeling and obesity. Journal of Clinical Investigation. 2011;121:2094–2101. doi: 10.1172/JCI45887. [DOI] [PMC free article] [PubMed] [Google Scholar]
- 23.Shi H., Clegg D.J. Sex differences in the regulation of body weight. Physiology & Behavior. 2009;97:199–204. doi: 10.1016/j.physbeh.2009.02.017. [DOI] [PMC free article] [PubMed] [Google Scholar]
- 24.Fox C.S., Massaro J.M., Hoffmann U., Pou K.M., Maurovich-Horvat P., Liu C.Y. Abdominal visceral and subcutaneous adipose tissue compartments: association with metabolic risk factors in the Framingham Heart Study. Circulation. 2007;116:39–48. doi: 10.1161/CIRCULATIONAHA.106.675355. [DOI] [PubMed] [Google Scholar]
- 25.Liu J., Fox C.S., Hickson D.A., May W.D., Hairston K.G., Carr J.J. Impact of abdominal visceral and subcutaneous adipose tissue on cardiometabolic risk factors: the Jackson Heart Study. Journal of Clinical Endocrinology & Metabolism. 2010;95:5419–5426. doi: 10.1210/jc.2010-1378. [DOI] [PMC free article] [PubMed] [Google Scholar]
- 26.Mauvais-Jarvis F., Clegg D.J., Hevener A.L. The role of estrogens in control of energy balance and glucose homeostasis. Endocrine Reviews. 2013;34:309–338. doi: 10.1210/er.2012-1055. [DOI] [PMC free article] [PubMed] [Google Scholar]
- 27.Heine P.A., Taylor J.A., Iwamoto G.A., Lubahn D.B., Cooke P.S. Increased adipose tissue in male and female estrogen receptor-alpha knockout mice. Proceedings of the National Academy of Sciences of the United States of America. 2000;97:12729–12734. doi: 10.1073/pnas.97.23.12729. [DOI] [PMC free article] [PubMed] [Google Scholar]
- 28.Ferrara C.M., Lynch N.A., Nicklas B.J., Ryan A.S., Berman D.M. Differences in adipose tissue metabolism between postmenopausal and perimenopausal women. Journal of Clinical Endocrinology & Metabolism. 2002;87:4166–4170. doi: 10.1210/jc.2001-012034. [DOI] [PubMed] [Google Scholar]
- 29.Carr M.C. The emergence of the metabolic syndrome with menopause. Journal of Clinical Endocrinology & Metabolism. 2003;88:2404–2411. doi: 10.1210/jc.2003-030242. [DOI] [PubMed] [Google Scholar]
- 30.Choi E.K., Kim W.K., Sul O.J., Park Y.K., Kim E.S., Suh J.H. TNFRSF14 deficiency protects against ovariectomy-induced adipose tissue inflammation. Journal of Endocrinology. 2014;220:25–33. doi: 10.1530/JOE-13-0341. [DOI] [PubMed] [Google Scholar]
- 31.Choi J.S., Koh I.-U., Song J. Genistein reduced insulin resistance index through modulating lipid metabolism in ovariectomized rats. Nutrition Research. 2012;32:844–855. doi: 10.1016/j.nutres.2012.10.002. [DOI] [PubMed] [Google Scholar]
- 32.Hong H.K., Cho Y.M., Park K.H., Lee C.T., Lee H.K., Park K.S. Peroxisome proliferator-activated receptor gamma mediated inhibition of plasminogen activator inhibitor type 1 production and proliferation of human umbilical vein endothelial cells. Diabetes Research and Clinical Practice. 2003;62:1–8. doi: 10.1016/s0168-8227(03)00142-6. [DOI] [PubMed] [Google Scholar]
- 33.Seth P., Krop I., Porter D., Polyak K. Novel estrogen and tamoxifen induced genes identified by SAGE (Serial Analysis of Gene Expression) Oncogene. 2002;21:836–843. doi: 10.1038/sj.onc.1205113. [DOI] [PubMed] [Google Scholar]
- 34.Berry R., Church C.D., Gericke M.T., Jeffery E., Colman L., Rodeheffer M.S. Imaging of adipose tissue. Methods in Enzymology. 2014;537:47–73. doi: 10.1016/B978-0-12-411619-1.00004-5. [DOI] [PMC free article] [PubMed] [Google Scholar]
- 35.Cho J., Kim D., Lee S., Lee Y. Cobalt chloride-induced estrogen receptor alpha down-regulation involves hypoxia-inducible factor-1alpha in MCF-7 human breast cancer cells. Molecular Endocrinology. 2005;19:1191–1199. doi: 10.1210/me.2004-0162. [DOI] [PubMed] [Google Scholar]
- 36.Miyauchi Y., Sato Y., Kobayashi T., Yoshida S., Mori T., Kanagawa H. HIF1alpha is required for osteoclast activation by estrogen deficiency in postmenopausal osteoporosis. Proceedings of the National Academy of Sciences of the United States of America. 2013;110:16568–16573. doi: 10.1073/pnas.1308755110. [DOI] [PMC free article] [PubMed] [Google Scholar]
- 37.Mak P., Chang C., Pursell B., Mercurio A.M. Estrogen receptor beta sustains epithelial differentiation by regulating prolyl hydroxylase 2 transcription. Proceedings of the National Academy of Sciences of the United States of America. 2013;110:4708–4713. doi: 10.1073/pnas.1221654110. [DOI] [PMC free article] [PubMed] [Google Scholar]
- 38.Higgins D.F., Kimura K., Bernhardt W.M., Shrimanker N., Akai Y., Hohenstein B. Hypoxia promotes fibrogenesis in vivo via HIF-1 stimulation of epithelial-to-mesenchymal transition. Journal of Clinical Investigation. 2007;117:3810–3820. doi: 10.1172/JCI30487. [DOI] [PMC free article] [PubMed] [Google Scholar]
- 39.Yi P., Driscoll M.D., Huang J., Bhagat S., Hilf R., Bambara R.A. The effects of estrogen-responsive element- and ligand-induced structural changes on the recruitment of cofactors and transcriptional responses by ER alpha and ER beta. Molecular Endocrinology (Baltimore, Md.) 2002;16:674–693. doi: 10.1210/mend.16.4.0810. [DOI] [PubMed] [Google Scholar]
- 40.Marino M., Galluzzo P., Ascenzi P. Estrogen signaling multiple pathways to impact gene transcription. Current Genomics. 2006;7:497–508. doi: 10.2174/138920206779315737. [DOI] [PMC free article] [PubMed] [Google Scholar]
- 41.Berra E., Benizri E., Ginouves A., Volmat V., Roux D., Pouyssegur J. HIF prolyl-hydroxylase 2 is the key oxygen sensor setting low steady-state levels of HIF-1alpha in normoxia. EMBO Journal. 2003;22:4082–4090. doi: 10.1093/emboj/cdg392. [DOI] [PMC free article] [PubMed] [Google Scholar]
- 42.Ginouves A., Ilc K., Macias N., Pouyssegur J., Berra E. PHDs overactivation during chronic hypoxia “desensitizes” HIFalpha and protects cells from necrosis. Proceedings of the National Academy of Sciences of the United States of America. 2008;105:4745–4750. doi: 10.1073/pnas.0705680105. [DOI] [PMC free article] [PubMed] [Google Scholar]
- 43.Place T.L., Nauseef J.T., Peterson M.K., Henry M.D., Mezhir J.J., Domann F.E. Prolyl-4-hydroxylase 3 (PHD3) expression is downregulated during epithelial-to-mesenchymal transition. PLoS ONE. 2013;8:e83021. doi: 10.1371/journal.pone.0083021. [DOI] [PMC free article] [PubMed] [Google Scholar]
- 44.Peurala E., Koivunen P., Bloigu R., Haapasaari K.M., Jukkola-Vuorinen A. Expressions of individual PHDs associate with good prognostic factors and increased proliferation in breast cancer patients. Breast Cancer Research and Treatment. 2012;133:179–188. doi: 10.1007/s10549-011-1750-5. [DOI] [PubMed] [Google Scholar]
- 45.Tennant D.A., Gottlieb E. HIF prolyl hydroxylase-3 mediates alpha-ketoglutarate-induced apoptosis and tumor suppression. Journal of Molecular Medicine (Berlin) 2010;88:839–849. doi: 10.1007/s00109-010-0627-0. [DOI] [PubMed] [Google Scholar]
- 46.Taniguchi C.M., Finger E.C., Krieg A.J., Wu C., Diep A.N., LaGory E.L. Cross-talk between hypoxia and insulin signaling through Phd3 regulates hepatic glucose and lipid metabolism and ameliorates diabetes. Nature Medicine. 2013;19:1325–1330. doi: 10.1038/nm.3294. [DOI] [PMC free article] [PubMed] [Google Scholar]
- 47.Rabinowitz M.H. Inhibition of hypoxia-inducible factor prolyl hydroxylase domain oxygen sensors: tricking the body into mounting orchestrated survival and repair responses. Journal of Medicinal Chemistry. 2013;56:9369–9402. doi: 10.1021/jm400386j. [DOI] [PubMed] [Google Scholar]
Associated Data
This section collects any data citations, data availability statements, or supplementary materials included in this article.