

Abstract
The effect of acute inhibition of both mTORC1 and mTORC2 on metabolism is unknown. A single injection of the mTOR kinase inhibitor, AZD8055, induced a transient, yet marked increase in fat oxidation and insulin resistance in mice, whereas the mTORC1 inhibitor rapamycin had no effect. AZD8055, but not rapamycin reduced insulin-stimulated glucose uptake into incubated muscles, despite normal GLUT4 translocation in muscle cells. AZD8055 inhibited glycolysis in MEF cells. Abrogation of mTORC2 activity by SIN1 deletion impaired glycolysis and AZD8055 had no effect in SIN1 KO MEFs. Re-expression of wildtype SIN1 rescued glycolysis. Glucose intolerance following AZD8055 administration was absent in mice lacking the mTORC2 subunit Rictor in muscle, and in vivo glucose uptake into Rictor-deficient muscle was reduced despite normal Akt activity. Taken together, acute mTOR inhibition is detrimental to glucose homeostasis in part by blocking muscle mTORC2, indicating its importance in muscle metabolism in vivo.
Keywords: Skeletal muscle, Metabolism, Glucose uptake, mTORC2, Rictor, Glycolysis
1. Introduction
The mammalian target of rapamycin (mTOR) protein is the catalytic subunit for two functionally and structurally distinct mTOR complexes (mTORC1 and mTORC2) [1]. mTORC1 is a major regulator of protein synthesis and cell growth [1]. Less is known, especially in vivo, about the more recently discovered mTORC2, but in the central nervous system, the liver and fat tissue it regulates glucose metabolism [2–5]. mTORC2 is also a major upstream kinase for the Akt Ser473 residue [6].
Understanding mTOR biology is vital in cancer, metabolism and aging research. Hyper-activated mTOR is common and possibly causal in cancer, because mutations of negative upstream regulators of the mTOR pathway lead to tumorigenesis [7]. Knockout of the mTOR target S6K1 [8] or long-term mTOR blockade by rapamycin treatment [9–13] extends lifespan in mice. However, other reports have shown detrimental health effects like insulin resistance and reduction in beta-cell mass following prolonged rapamycin treatment [14–19].
The tools to study mTOR biology on a whole-body level in mice are limited because knockout (KO) of mTOR is embryonic lethal and inducible global KO models can be “leaky” in some tissues [19]. Acute rapamycin treatment inhibits mTORC1, but it does so incompletely [20]. Chronic rapamycin treatment can abrogate mTORC2 activity [21], and insulin resistance in mice treated with rapamycin for several weeks has been attributed to impaired liver mTORC2 activity [19]. In other long-term rapamycin studies, however, in which rodents also exhibited insulin resistance, mTORC2 activity was normal judged by liver Akt S473 phosphorylation [15,17,18]. Moreover, different durations of chronic rapamycin treatment lead to different phenotypes along with varying degrees of mTORC2 activity [15]. Therefore, while the effects of rapamycin remain important to study, it may not be the best tool to study mTOR signaling per se.
A new generation of mTOR kinase inhibitors (mTOR-KI) acutely and potently inhibits both mTOR complexes, but the in vivo effects on metabolism have not been extensively investigated. These mTOR KIs are ATP-competitive mTOR inhibitors, whereas rapamycin forms a complex with FKBP12 to allosterically inhibit mTORC1. We used the mTOR-KI AZD8055 to study the effects of acute mTOR inhibition on glucose metabolism. We contrasted our findings to acute rapamycin treatment to seek out AZD8055 effects due to mTORC2 inhibition, which we further explored by using genetic mTORC2 KO models (SIN1 and Rictor KO).
2. Materials and methods
2.1. Animals
Female C57BL/6 mice (Taconic, Denmark) aged 11–12 weeks old were used, as well as female muscle specific Rictor knockout (mKO: RictorFloxed/Floxed, HSA-Cre−/+) and wildtype (WT: RictorFloxed/Floxed, HSA-Cre−/−) littermates, aged 11–14 weeks. Generation of these mice has been described elsewhere [22]. Animals were kept on a 12:12-h light–dark cycle and had free access to standard rodent chow diet (Altromin no. 1324; Chr. Pedersen, Denmark) and water. All mice were group-housed. All experiments were approved by the Danish Animal Experimental Inspectorate and complied with the terms of the “European Convention for the Protection of Vertebrate Animals Used for Experiments and Other Scientific Purposes.”
2.2. In vivo AZD8055 and rapamycin injection experiments
AZD8055 and rapamycin (Selleckchem, Houston, USA) were formulated according to Chresta et al. [23] and Chen et al. [10], respectively. In brief, AZD8055 was prepared at 1 mg/ml in a 30% (w/v) Captisol© (Ligand Pharmaceuticals, Inc, La Jolla, CA, USA) solution and the pH was adjusted to 3. For vehicle injections, 30% (w/v) Captisol©, pH3, was used. For rapamycin, a rapamycin stock solution (12.5 mg/ml in ethanol) was diluted to 0.4 mg/ml in 5% (w/v) Tween-80 and 5% (w/v) polyethylene glycol (PEG) (Sigma–Aldrich). For vehicle injections a 5% (w/v) Tween-80 and 5% (w/v) PEG solution was used. For all treatments 10 μl per gram mouse mass were injected. Mice were acclimatized to indirect calorimetry cages (PhenoMaster, TSE, Bad Homburg, Germany) for 3 days. After an overnight fast, mice were intraperitoneal (IP)-injected with vehicle or AZD8055 (10 mg kg−1) [23]; or vehicle or rapamycin (4 mg kg−1) [10] and given free access to food for 6 h. Expired carbon dioxide (VCO2) and inhaled oxygen (VO2) were measured to calculate respiratory exchange ratio (RER). Calculations of carbohydrate and fat utilization were adopted from Couture et al. [24] and normalized to mouse body mass. For plasma glucose determination, mixed tail blood was obtained at baseline, after an overnight fast and at 1, 3, 6, and 24 h following AZD8055 injection, during which mice had free access to food, and analyzed in duplicates with a glucometer (Contour XT, Bayer Consumer Care AG, Basel, Switzerland). For plasma insulin determination at the 3 h time-point mixed tail blood was collected into heparinized capillary tubes and plasma insulin levels were assayed with an ELISA kit (Mouse Ultrasensitive Insulin ELISA, #80-INSMSU-E01, Alpco, Salem, USA). Plasma fatty acids (FAs) were determined with a colorimetric commercial kit (NEFA-HR(2) kit, Wako Chemicals, Germany) using a Hitachi 912 Automatic Analyzer, Germany. For glucose tolerance test Rictor WT and mKO mice were fasted for three hours, injected with vehicle or AZD8055, and two hours later IP-injected with 2 g/kg bodyweight d-glucose (0.2 g in 1 ml saline). Blood glucose concentration in mixed tail blood was measured in duplicates with a glucometer just before drug and glucose injection (−120 and 0 min, respectively) and 20, 40, 60, 90 and 120 min after glucose injection. For the signaling experiment mice were overnight fasted, injected with vehicle or AZD8055 and granted free access to food. Two hours after injection mice were euthanized by cervical dislocation and gastrocnemius, quadriceps, liver, heart and gonadal adipose tissue were quickly dissected out and stored at −80 °C.
2.3. In vitro mouse muscle incubations and 2-deoxyglucose (2-DG) uptake
Soleus and EDL muscles from both legs were dissected out from 1 h fasted and anesthetized mice (6 mg pentobarbital and 0.24 mg lidocaine/100 g body wt). Mice were euthanized by cervical dislocation after muscles had been removed. Muscles were gently lengthened to resting tension (4–5 mN) in incubation chambers (Multi Myograph system; Danish Myo-Technology, Denmark). As described previously [25], these chambers contained 4 ml heated (30 °C) Krebs–Ringer–Henseleit (KRH) buffer supplemented with 2 mM pyruvate, 8 mM mannitol and 0.1% BSA. Muscles were incubated for 60 min with either 0.1% DMSO, 640 nM AZD8055 or 1 μM Rapamycin. When appropriate, insulin (Actrapid, Novo Nordisk, Bagsvaerd, Denmark) was added during the last 30 min of inhibitor and DMSO presence, resulting in an insulin concentration of 60 nM. During the last 10 min of insulin stimulation 2-DG uptake was measured with 3H-2-DG and 14C-Mannitol radioactive tracers and 1 mM of 2-DG [25]. Muscles were washed in ice-cold KRH buffer, blotted dry and snap-frozen in liquid nitrogen, trimmed and weighed, before stored at −80 °C.
2.4. 2-DG uptake and GLUT4 translocation and signaling in L6 myoblasts
L6 cells stably over-expressing GLUT4 with a c-myc epitope tag (L6-GLUT4myc) [26], a kind gift from Amira Klip, were grown in α-MEM media (GIBCO #1257-063) with 10% fetal bovine serum (GIBCO #26140-038), 100 units/mL penicillin, 100 μg/mL streptomycin, 0.25 μg/ml Fungizone© (GIBCO #15240-062) (5% CO2, 37 °C). For uptake, translocation and signaling experiments cells were grown until confluent and the following experimental scheme was applied: Cells were serum starved for four hours. During the last 50 min of starvation, inhibitors (0.1%DMSO, 500 nM AZD8055 or 100 nM Rapamycin) were added. Twenty minutes before the end of starvation, insulin (10 or 100 nM) was added when appropriate. 2-DG uptake over five minutes was then determined as previously described by Somwar et al. [27] and related to protein concentration in each well. Background determined with cytochalasin B was subtracted and experiments were assayed in duplicates. For the GLUT4 translocation assay, the media was removed at the end of basal or insulin stimulation and cells were immediately chilled on ice, fixed with 3% paraformaldehyde, blocked in 5% goat serum, and incubated with primary anti-myc antibody (Cell Signaling Technology). The signal was detected with a secondary HRP-antibody and o-Phenylenediamine reagent (Sigma–Aldrich) was added to each well to initiate a color reaction with the secondary antibody. This was terminated with 5 M HCl, before absorbance at 492 nm was measured. Background absorbance (no primary antibody) was subtracted. Each experiment was assayed in at least triplicates.
2.5. Glucose transport into giant sarcolemmal vesicles from rats
To investigate whether AZD8055 has direct effect on glucose transporters, giant sarcolemmal vesicles (GSV) were prepared from rat gastrocnemius muscle from four pooled rats as previously described [28]. For the glucose transport experiment, aliquots of freshly prepared GSV suspension were pre-incubated in KCl–MOPS buffer (140 mM KCl and 10 mM MOPS) with or without 640 or 1280 nM AZD8055 for 15 min at RT. Uptake medium was added for 45 s to yield a final concentration of 0.5 μCi ml−1 3H-2-deoxyglucose (2DG), 0.1 μCi ml−1 14C-Mannitol, 5 mM 2DG and 35 mM Mannitol (all in KCl–MOPS buffer). Glucose transport was terminated by adding ice-cold stop solution (KCl–MOPS containing 50 μM cytochalasin B). Specific glucose transport was calculated as the difference between total 3H-2DG and extravesicular 3H-2DG.
2.6. Western blot analysis
Tissues were homogenized 3 × 30 s at 30 Hz using a Tissuelyser II (Qiagen, USA) in ice-cold homogenization buffer (10% Glycerol, 20 mM Na-pyrophosphate, 150 mM NaCl, 50 mM HEPES (pH 7.5), 1% NP-40, 20 mM β-glycerophosphate, 10 mM NaF, 2 mM PMSF, 1 mM EDTA (pH 8.0), 1 mM EGTA (pH 8.0), 10 μg/ml Aprotinin, 10 μg/ml Leupeptin, 2 mM Na3VO4, 3 mM Benzamidine). Homogenates were rotated end-over-end for 1 h, before lysate supernatant was obtained by centrifugation for 20 min at 13,000 × g at 4 °C. Lysate protein content was determined with the bicinchoninic acid (BCA) method using BSA standards (Pierce) and BCA assay reagents (Pierce) and all lysates were diluted to the same protein concentration. Lysates from the adipose tissue from the in vivo AZD8055 injection experiment were pooled (two animals together for n = 1), because of the small amount of lysates obtained for these particular samples. Total protein and phosphorylation levels of indicated proteins were determined by standard immunoblotting technique loading equal amounts of protein (5–40 μg). The primary phospho-antibodies used were p-AktSer473 (#9271), p-AktThr308 (#9275), p-NDRG1Thr346 (#3217), p-p70S6k1Thr389 (9205), phospho-Akt Substrate (PAS) (#9614) (Cell Signaling Technology, all rabbit). The primary total antibodies used were beta-actin (#4967, Cell Signaling, rabbit), Akt2 (#2964, Cell Signaling, rabbit), p70S6K1 (#9202, Cell Signaling, rabbit), GSK3-beta (#610201, BD Bioscience, mouse), AS160 (#07-741, Millipore, rabbit), GLUT4 (#PA11065, Affinity Bioreagents, rabbit) and NDRG1 (ab37897, Abcam, goat). Polyvinylidene difluoride membranes (Immobilon Transfer Membrane; Millipore) were blocked in TBS-Tween 20 containing 5% skim milk or 3% BSA protein for 20 min at room temperature. Membranes were incubated with primary antibodies overnight at 4 °C, followed by incubation with horseradish peroxidase-conjugated (HRP) secondary antibody (Jackson ImmunoResearch Laboratories) for 45 min at room temperature. Bands were visualized in a BIO-RAD ChemiDoc™ MP Imaging System after incubation with enhanced chemiluminescence (ECL+; Amersham Biosciences).
2.7. SIN1 cell work
SIN1 KO MEFs were a kind gift from Bing Su. WT HA-SIN1 was re-expressed in SIN1−/− MEFs using the pMIG retrovirus vector which co-expresses GFP with HA-SIN1. 48 h after infection, GFP-positive cells were isolated by fluorescence-activated cell sorting. WT MEFs, SIN1−/− and SIN1−/− MEFs reexpressing HA-SIN1 were washed and treated for 16 h in 0.1% FCS, or in 10% FCS supplemented with 0.1% DMSO, 10 μM Akt inhibitor MK2006 or 500 nM AZD8055 as indicated. Media lactate levels were measured using the hydrazine sink method, as described previously [29], and normalized to cellular protein levels, measured using the BCA assay (Pierce).
2.8. In vivo glucose-induced glucose uptake and glycogen and muscle glucose determinations
Baseline mixed tail blood was collected from conscious and overnight-fasted (∼12 h) mice, before mice were IP injected (10 ml/kg body mass) with either saline or glucose (2 g/kg body mass) containing 0.1 mM 2-deoxyglucose (2-DG) and 60 μCi/ml 3H-labeled-2-DG [30]. Additional blood was drawn at 15 and 30 min post-injection. Immediately after the last blood draw mice were sacrificed by cervical dislocation and quadriceps muscles were rapidly excised and snap frozen in liquid nitrogen. The blood draws were used for blood glucose and plasma insulin determinations, which were carried out as described above. In addition, 10 μl of plasma was used to measure the plasma 3H activity by scintillation counting. Subsequently the area under the curve, AUC 3H-2-DG0–30 min, was calculated by the trapezoid method to estimate the 3H-2-DG levels the muscles had been exposed to [30]. Fifty milligrams of quadriceps muscle was used to determine the accumulation of phosphorylated 3H-2-DG (3H-2-DG-6-P) with the precipitation method [30]. Quadriceps muscle glycogen content was measured as glycosyl units after acid hydrolysis and muscle glucose was determined fluorometrically from neutralized perchloric acid extracts [31].
2.9. Statistical analysis
The error bars represent SEM. Statistical testing was performed using two-tailed Student t-tests when comparing two means. Analysis of variance (ANOVA) or, when experiments involved multiple testing, repeated measures ANOVA with Holm Sidak post hoc tests were performed when comparing more than two means. Statistical evaluation was performed using SigmaPlot 11.0. The significance level was set at p <0.05.
3. Results
3.1. AZD8055 but not rapamycin alters substrate utilization in vivo
We injected AZD8055 or rapamycin at doses used in preclinical cancer mouse studies [10,23] into fasted C57BL/6 mice and measured metabolic flexibility with indirect calorimetry during re-feeding. AZD8055, but not rapamycin, markedly decreased the respiratory exchange ratio (RER) (Figure 1A,B) without alterations in food consumption (Figure 1C,D). AZD8055 treated mice had reduced carbohydrate and increased fat utilization (Supplemental Figure 1a,b), while rapamycin treated mice showed no changes (Supplemental Figure 1c,d).
Figure 1.
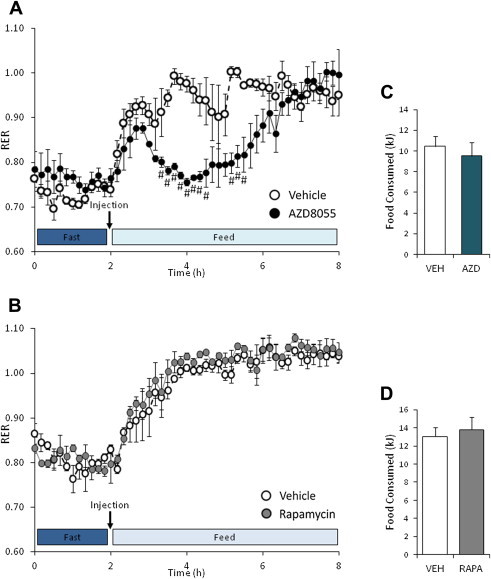
AZD8055 treatment alters fuel substrate utilization in vivo. (A,B) Overnight fasted mice were intraperitoneal-injected with vehicle or AZD8055 (10 mg kg−1); or vehicle or rapamycin (4 mg kg−1) before re-feeding was initiated. Respiratory exchange ratio (RER) was measured (n = 3–4). (C,D) Food eaten throughout 6 h of re-feeding in the AZD8055 and rapamycin experiment (n = 3–4). #p < 0.05 different from vehicle at indicated time points. Data are means ± SEM.
3.2. AZD8055 induces insulin resistance in vivo
Glucose levels in AZD8055 injected mice were elevated 3 and 6 h after drug injection but were similar to control mice at 24 h after drug injection (Figure 2A). Along with elevated glucose levels at 3 h, AZD8055 treated mice had 3-fold higher plasma insulin levels (Figure 2B) and lower plasma FAs (Figure 2C). These data indicate whole-body insulin resistance and suggest an increased reliance on FAs as an energy substrate in agreement with the indirect calorimetry data (Figure 1A).
Figure 2.
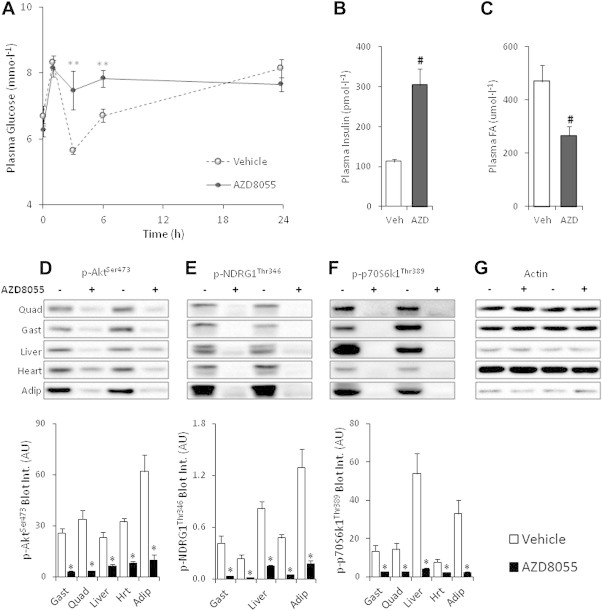
AZD8055 induces whole-body insulin resistance and impairs mTOR signaling in insulin responsive tissues. (A) Overnight fasted mice were intraperitoneal-injected with either vehicle or AZD8055 (10 mg kg−1), re-fed and mixed tail blood obtained at indicated time-points was analyzed for plasma glucose concentration (n = 5); (B,C) 3 h after AZD8055 injection additional blood was sampled for plasma insulin and fatty acids (FA) determinations (n = 4–5). (D–G) Representative western blots and quantitative analysis of mTOR signaling in mouse quadriceps, gastrocnemius, liver, heart, and adipose tissue two hours after vehicle or AZD8055 injection (n = 8; for adipose tissue n = 4). **p < 0.01 different from vehicle at indicated time-point; #p < 0.01 from vehicle; *p < 0.05 different from vehicle within each tissue. Data are means ± SEM.
3.3. AZD8055 reduces mTOR and Akt signaling in vivo
AZD8055 injection blocked phosphorylation of the mTORC1 readout p70S6K1Thr389, the mTORC2 substrate, AktSer473, and the mTORC2 biomarker, NDRG1Thr346 in skeletal muscle, adipose tissue, liver, and cardiac muscle 2 h after injection (Figure 2D–F). Phosphorylation of AktThr308, which is essential for full Akt kinase activation and may regulate p-AktSer473 [32], was unaffected by AZD8055 in skeletal muscle and liver tissue and increased in cardiac muscle and adipose tissue (Figure 3A). Phosphorylation of Akt substrate of 160 kDa (AS160), an Akt target and a key mediator of insulin-induced glucose uptake [33,34] was unchanged in skeletal and cardiac muscle following mTOR inhibition (Figure 3B). p-AS160 was decreased following AZD8055 treatment in adipose tissue whereas it was undetectable in liver (Figure 3B). AZD8055 injection had largely no effect on the amount of total AS160, p70S6K1, Akt2 and NDRG1 expression detected by immunoblotting (Supplemental Figure 2), except for a 9% decrease in gastrocnemius p70S6K1 levels (Supplemental Figure 2c) and a 30% decrease in adipose tissue AS160 levels (Supplemental Figure 2b).
Figure 3.
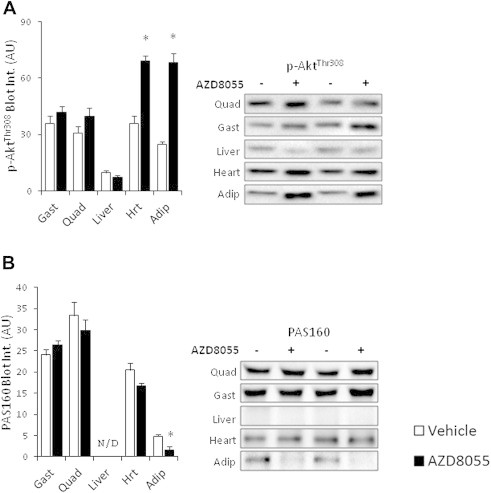
AZD8055 differentially affects p-AktThr308 and p-AS160 in vivo (A,B) Representative western blots and quantitative analysis of p-AktThr308 and pan-AS160 phosphorylation in mouse quadriceps, gastrocnemius, liver, heart, and adipose tissue two hours after vehicle or AZD8055 (10 mg kg−1) injection (n = 8, for adipose tissue n = 4). *p < 0.05 different from vehicle within each tissue. Data are means ± SEM.
3.4. AZD8055 but not rapamycin impairs insulin-stimulated glucose uptake in vitro
Acute AZD8055 treatment (1 h) impaired insulin-stimulated glucose uptake in soleus and EDL muscle by ∼30%, while rapamycin (1 h) had no effect (Figure 4A,B). Basal glucose uptake was unaffected suggesting GLUT1 function was unperturbed by the mTOR blockers (Figure 4A,B). Similar to the in vivo effects, AZD8055 treatment inhibited readouts of both mTOR complexes (p70S6K1Thr389, AktSer473, NDRG1Thr346) (Figure 5B–D, G–I). Acute rapamycin only inhibited the mTORC1 readout p-p70S6K1Thr389 (Figure 5D,I), but to a lesser extent than AZD8055. In contrast to in vivo, AZD8055 decreased p-AktThr308 in both soleus and EDL muscles (Figure 5E,J). Rapamycin enhanced insulin-stimulated p-AktThr308 in soleus, but had no effect in EDL muscle (Figure 5E,J). p-AS160 was insulin responsive, but was not affected by the mTOR inhibitors in either soleus or EDL muscle (Figure 5F,K). AZD8055 or Rapamycin treatment had no effect on total protein expression of Akt2, NDRG1, AS160, and p70S6K1 (Supplemental Figure 3). However, insulin treatment increased the amount of total AS160 detected by immunoblotting by ∼23% and ∼21% in soleus and EDL muscle, respectively (Supplemental Figure 3c,h).
Figure 4.
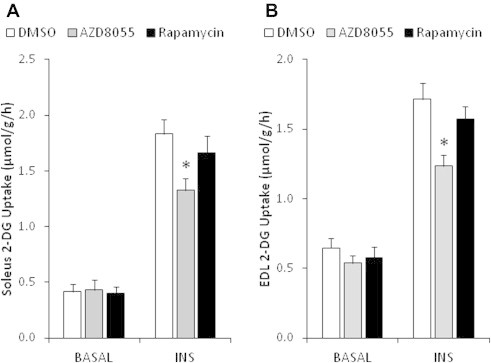
AZD8055, but not rapamycin, reduces muscle glucose uptake ex vivo. (A,B) Mouse soleus and EDL muscles were incubated ex vivo in the presence of 0.1% DMSO, 640 nM AZD8055 or 1 μM rapamycin for 30 min, followed by basal or insulin (60 nM) stimulation. Glucose uptake was measured with 3H-2-deoxyglucose (n = 7–8). *p < 0.05 different from corresponding DMSO. Data are means ± SEM.
Figure 5.
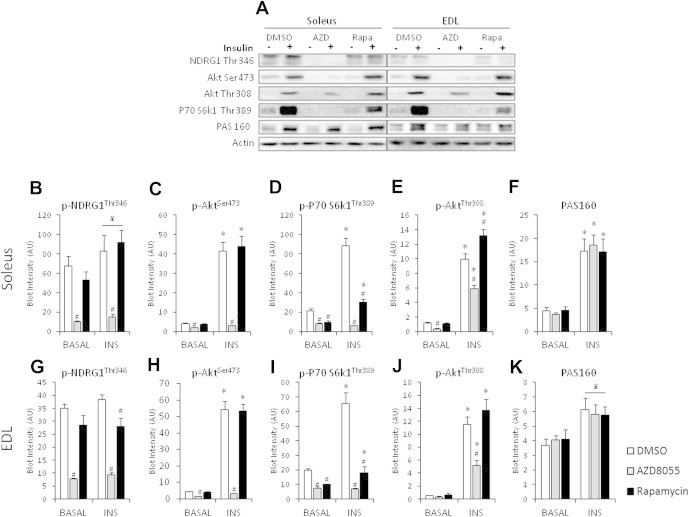
AZD8055 impairs insulin-stimulated mTOR, but not AS160 signaling ex vivo. (A) Representative Western blots in soleus and EDL muscle. (B–K) Western blotting quantification of indicated proteins in mouse soleus and EDL muscles that were incubated with either 0.1% DMSO, 640 nM AZD8055 or 1 μM rapamycin for 30 min and basal or insulin-stimulated (60 nM) ex vivo (n = 7–8). *p < 0.05 different from corresponding basal; #p < 0.05 different from corresponding DMSO; ¥p < 0.05 main effect of insulin. Data are means ± SEM.
3.5. AZD8055 reduces glucose uptake but not GLUT4 translocation and activity
AZD8055 reduced glucose uptake in L6 muscle cells during insulin stimulation (100 nM), while rapamycin had no effect (Figure 6A,B). This inhibitory effect on glucose uptake occurred despite normal insulin-stimulated (10 and 100 nM) GLUT4 translocation following AZD8055 and rapamycin pre-treatment (Figure 6C). To test whether AZD8055 had off-target effects on the glucose transporters we used giant sarcolemmal vesicles (GSV). In these vesicles glucose transporter translocation is absent and glucose transport relies solely on the glucose transporter present in the vesicle plasma membrane. AZD8055 had no effect on glucose uptake into these vesicles (Figure 6D), even at a higher concentration than was used in any of the experiments, while Cytochalasin B had the expected inhibitory effect (Figure 6D). Together these data indicate that AZD8055 inhibits glucose uptake in muscle cells independently of GLUT4 translocation and activity.
Figure 6.
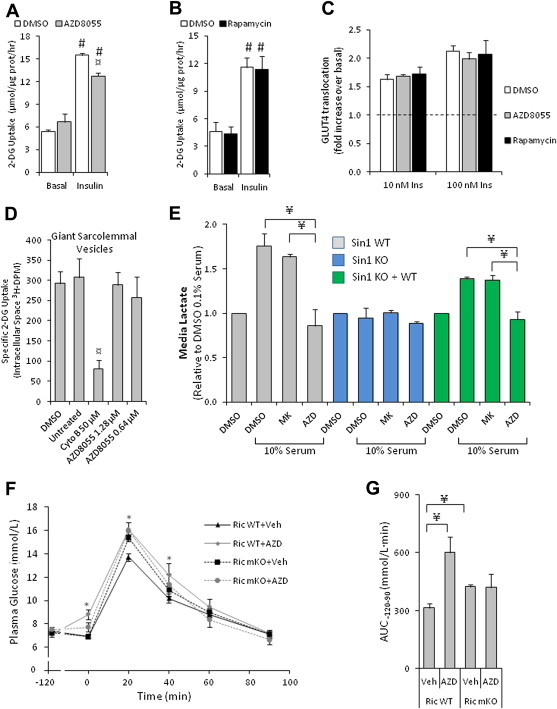
AZD8055 impairs insulin-stimulated glucose uptake but not GLUT4 translocation in muscle cells, blocks lactate release and induces glucose intolerance by blocking muscle mTORC2. (A,B) Insulin-stimulated 3H-2-deoxyglucose uptake following 50 min of 0.1% DMSO, 500 nM AZD8055 or 100 nM rapamycin pre-incubation in L6-GLUT4myc myoblasts (n = 3–5). (C) Insulin-induced (10 and 100 nM) GLUT4 translocation in L6-GLUT4myc myoblasts following AZD8055 (500 nM) or rapamycin (100 nM) pre-treatment for 50 min (n = 4). (D) Glucose transport into sarcolemmal giant vesicles pretreated with indicated inhibitors and concentrations (n = 3–4). (E) Overnight lactate release into media from SIN1 WT, KO and KO + WT MEFs that were treated with indicated inhibitors and concentrations of serum (n = 3). (F) Glucose concentrations measured from mixed tail blood at indicated time points in Rictor WT and mKO mice that were intraperitoneal-injected with either vehicle or AZD8055 (10 mg kg−1) at t = −120 min and with glucose (2 g/kg) at t = 0 (n = 8–9). (G) Area under the curve determined from (F) (n = 8–9). #p < 0.001 different from corresponding basal; ¤p < 0.05 different from corresponding DMSO; *p < 0.05 different from corresponding vehicle; ¥p < 0.05 difference between indicated groups. Data are means ± SEM.
3.6. AZD8055 reduces glycolysis by blocking mTORC2 activity
In light of the observed dissociation between normal GLUT4 translocation, AS160 phosphorylation, and reduced glucose uptake with AZD8055 treatment, we hypothesized an intracellular glucose handling defect. Recent reports have suggested that mTORC2 is a positive regulator of glycolysis [2,35]. To this end we measured lactate release into media of mouse embryonic fibroblast cells that were missing the critical mTORC2 subunit SIN1 (SIN1 KO MEFs) and two control cell conditions: wildtype (WT) MEFs and SIN1 KO MEFs in which WT SIN1 was re-introduced (SIN1 KO + WT). Lactate release was increased by serum stimulation in WT MEF cells and in SIN1 KO + WT cells, but no response was observed in SIN1 KO cells (Figure 6E). AZD8055 treatment diminished lactate release in SIN1 WT and SIN1 KO + WT cells, but the Akt inhibitor, MK2206, did not. Neither drug affected SIN1 KO cells. Thus, impairing mTORC2 activity either genetically or pharmacologically reduced glycolytic flux in these cells.
3.7. AZD8055 reduces glucose tolerance by blocking mTORC2 activity in skeletal muscle
In WT mice, AZD8055 injection led to glucose intolerance (Figure 6F,G). In mice lacking the mTORC2 subunit, Rictor, in skeletal muscle (Ric mKO), AZD8055 had no effect (Figure 6F,G). Furthermore, vehicle treated Ric mKO mice exhibited glucose intolerance compared to vehicle treated Rictor WT mice (Figure 6F,G). This indicates that acute mTOR inhibition by AZD8055 perturbs glucose tolerance in part by blocking mTORC2 activity in skeletal muscle.
3.8. In vivo glucose uptake into muscle is impaired in muscle lacking mTORC2 activity despite normal AS160 phosphorylation
Given the glucose intolerance of Ric mKO mice, which has been reported by others [36], we investigated whether in vivo glucose uptake into muscle of Ric mKO mice was impaired. To this end we aimed to mimic a glucose tolerance test. Conscious mice were injected with saline or a glucose solution spiked with 3H-2-DG to assess glucose uptake in skeletal muscle. Ric mKO exhibited glucose intolerance (Figure 7A), with no impairment in glucose-induced insulin release (Figure 7B). With saline injection, plasma insulin levels were lower at 15 min and returned to baseline levels by 30 min (Figure 7B) in both Ric WT and mKO mice. Overall glucose clearance (Kg) was ∼30% lower in Ric mKO muscle (Figure 7C). Glucose-induced glucose uptake (Rg), which accounts for the mass action of the plasma glucose concentrations, was 30% lower in Ric mKO muscle (Figure 7D). Muscle glycogen content and muscle free glucose concentrations were elevated by ∼24% and ∼16%, respectively, in Ric mKO muscle (Figure 7E,F). Phosphorylation of AktSer473 was markedly reduced and unresponsive to glucose stimulation (Figure 8B), while p-AktThr308 was elevated following saline and glucose stimulation in Ric mKO muscle (Figure 8C). Similarly p-AS160Thr642 was also increased following saline and glucose stimulation in Ric mKO muscle (Figure 8E). p-GSK3ßSer9, a readout of Akt activity, was similar in Ric WT and mKO muscle and responsive to glucose stimulation (Figure 8G). GLUT4, GSK3-beta and AS160 protein expression were unchanged between the genotypes (Figure 8F,H,I), while Ric mKO muscle had ∼40% less Akt2 protein (Figure 8D). These data indicate that mTORC2 activity is necessary for normal muscle glucose uptake in vivo, despite unimpaired Akt activity, judged by downstream targets.
Figure 7.
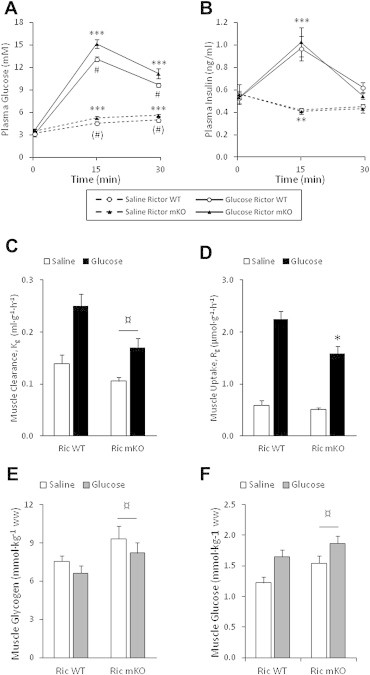
Rictor deficient muscles have impaired in vivo glucose uptake, elevated glucose and glycogen levels. (A,B) Plasma glucose and insulin levels in Rictor WT and mKO mice just before (0 min) and 15 and 30 min after glucose or saline injection (n = 8–9). (C,D) Glucose clearance and uptake into quadriceps muscle of Rictor WT and mKO mice 30 min after saline or glucose injection (n = 7–8). (E,F) Muscle glycogen and glucose levels from Rictor WT and mKO mice 30 min after saline or glucose injection (n = 7–9). ***p < 0.001 and **p < 0.01 effect of time compared to 0 min; #p < 0.05 effect of genotype within glucose stimulation; (#)p < 0.1 effect of genotype within saline stimulation; ¤p < 0.05 main effect of genotype; *p < 0.05 different from WT glucose stimulation. Data are means ± SEM.
Figure 8.
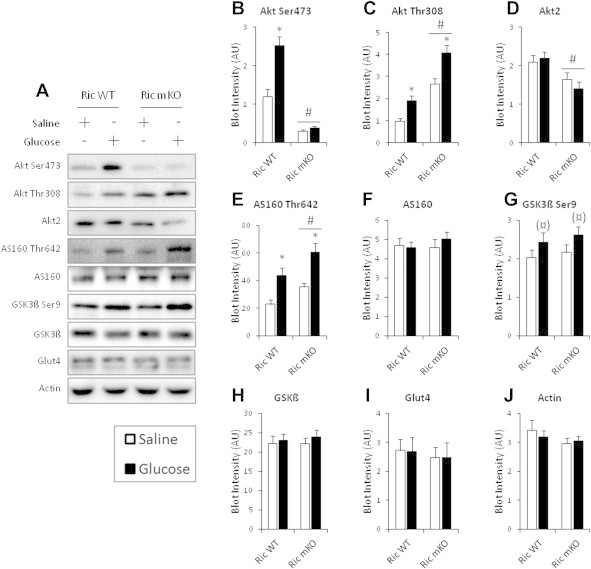
Glucose-induced Akt Ser473 phosphorylation is impaired in Rictor deficient muscle, but downstream Akt signaling is intact. (A) Representative western blots for indicated proteins and phosphorylation sites and (B–J) their densitometry quantification from muscles of Rictor WT and mKO mice 30 min after saline or glucose injection (n = 8–9). *p < 0.05 effect of glucose injection compared to corresponding saline group; (¤)p < 0.1 main effect of glucose injection; #p < 0.05 main effect of genotype. Data are means ± SEM.
4. Discussion
We provide in vivo and in vitro evidence that acute mTOR inhibition is detrimental to whole-body and skeletal muscle glucose metabolism. The effects on the whole-body include insulin resistance, increased lipid oxidation and glucose intolerance. The latter is largely due to blocking skeletal muscle mTORC2 activity. In muscle, acute mTOR inhibition leads to insulin resistance in vitro, although insulin-stimulated GLUT4 translocation is normal with AZD8055 treatment in muscle cells. Rictor deficient muscles exhibit reduced insulin-stimulated glucose uptake in vivo along with glucose accumulation. Abrogation of mTORC2 activity by SIN1 knockout or AZD8055 treatment decreased glycolysis in MEF cells. Collectively our data suggest that acute mTOR inhibition by AZD8055 or genetic abrogation of mTORC2 activity impairs glycolysis which reduces insulin sensitivity of glucose uptake in muscle.
We focused on acute mTOR inhibition with AZD8055, a highly selective and bioavailable mTOR-KI [23], to investigate experimental outcomes that stem from acute post-translational signaling changes due to inhibited mTORC1 and mTORC2 kinase activity. Others have studied the acute effect of mTORC1 inhibition by rapamycin. In contrast to the acute effect of AZD8055, acute rapamycin treatment may actually have insulin sensitizing effects. Insulin activates mTORC1 and its substrate S6K1, which phosphorylates and inhibits the insulin receptor substrate 1 (IRS-1). By blocking mTORC1, rapamycin disrupts this negative feedback loop and thereby increases IRS-1 activity, which is reflected in increased Akt activity in adipose and muscle cells [37,38]. In agreement, in humans acute rapamycin-treatment can actually improve whole-body insulin sensitivity [39]. Our data support this idea, because in soleus muscle insulin-stimulated p-AktThr308 is enhanced with rapamycin treatment. When we administered rapamycin we neither observed substrate changes, nor did we detect an inhibitory effect of rapamycin on muscle glucose uptake in vitro. Supporting our data, rapamycin injection in ob/ob mice, at a concentration similar to what we injected in the present study, had no effect on glucose or insulin tolerance, despite reducing S6K1 phosphorylation in muscle [40]. Collectively, these data suggest that the detrimental effect of AZD8055 on glucose metabolism is not mediated by mTORC1 signaling.
However, rapamycin does not fully inhibit mTORC1, whereas mTOR KIs likely do [20]. Evidence for this can also be found in the present study. AZD8055 inhibited p-S6K1 more effectively than rapamycin in incubated muscle. Therefore, AZD8055 could affect metabolism by inhibiting rapamycin-insensitive mTORC1 signaling. However, similar to acute rapamycin treatment, abrogation of mTORC1 activity by raptor deletion increases p-Akt in muscle cells and skeletal muscle [22,38]. Moreover, deletion of raptor in adipose tissue protects mice from high fat diet induced weight gain and improves their glucose tolerance [41]. This indicates that inhibited mTORC1 signaling by AZD8055 likely does not account for the metabolic effects observed by AZD8055.
Long-term rapamycin treatment has been used to inhibit mTORC1 and mTORC2 signaling. However, it takes several days for rapamycin to inhibit both mTOR complexes and this does not affect all tissues equally [1,14,15,17,18]. Long-term rapamycin treatment in mice also causes changes in gene transcription, body mass and food intake.
To better understand the effect of AZD8055 on insulin action and glucose uptake in skeletal muscle we used the in vitro muscle incubation method. Insulin-stimulated glucose uptake was diminished by AZD8055. Surprisingly insulin-stimulated GLUT4 translocation was normal in L6 cells, despite a similar glucose uptake defect as observed in mature striated muscle. Normal glucose transport into GSV indicates that AZD8055 has no direct inhibitory effect on the glucose transporter activity. In agreement with normal GLUT4 translocation observed in AZD8055-treated L6 myocytes, phosphorylation of AS160, a key regulator of GLUT4 translocation [33,34] and a well established Akt substrate, was normal in incubated muscle treated with AZD8055 under both basal and insulin-stimulated conditions. Overall our data suggest that glucose transport capacity was unaffected by AZD8055, because GLUT4 translocation and activity and the phosphorylation of the key regulator, AS160, were normal.
Consequently, we explored whether AZD8055 treatment leads to an intracellular glucose handling defect. In this light it is interesting that mTORC2 has been reported as a positive regulator of glycolysis in cancer and liver cells [2,35]. We reasoned that an AZD8055-induced defect in glycolysis may adversely affect the glucose concentration gradient necessary for normal glucose uptake and that this is mediated by blocking mTORC2 activity. In agreement with our hypothesis, AZD8055 decreased glycolysis judged by lactate release in MEF cells. Similarly, disruption of mTORC2 activity in MEFs, by knockout of SIN1, also impaired glycolysis, but this defect was rescued by re-introduction of wildtype SIN1 protein. Since AZD8055 had no effect on glycolysis in SIN1 KO MEFs, but reduced glycolysis in wildtype MEFs and in SIN1 KO MEFs that received wildtype SIN1 protein, we conclude that AZD8055 impairs glycolysis by inhibiting mTORC2 activity. Furthermore, given that the Akt inhibitor, MK2206, had no effect of glycolysis, AZD8055 and mTORC2 likely impact glycolysis independently of Akt signaling.
Glucose uptake was impaired in Rictor deficient muscles in vivo. Once again this occurred despite normal Akt activity, but Rictor mKO muscles had increased muscle glucose levels. This glucose build-up is compatible with an attenuated glycolytic flux and diminishes the transmembrane glucose gradient explaining the decreased glucose uptake. The increased glycogen content in Rictor mKO muscle likely reflects the shunting of glucose into storage, which also fits with a decrease in glycolytic flux.
Of some debate is whether phosphorylation of Akt Ser473 depends on or influences Thr308 phosphorylation, and vice versa [32]. In the present study, acute mTOR inhibition by AZD8055 markedly lowered p-AktSer473 without much impact on p-AktThr308 in vivo. In incubated muscles, p-AktT308 was lower with AZD8055 treatment, but remained insulin responsive. Abrogation of mTORC2 activity by Rictor deletion in skeletal muscle also markedly lowered p-AktSer473, but this had no inhibitory effect on p-AktT308, which has been reported in muscle by others [22,36]. Deletion of the kinase responsible for Akt Thr308 phosphorylation, PDK1, has reportedly no inhibitory effect on p-AktSer473 in liver and cardiac tissue [42–44]. Together these data indicate that Ser473 or Thr308 phosphorylation do not influence one another markedly. Furthermore, the effect of decreased p-AktSer473 on overall Akt activity is elusive. Judging by in vivo substrates, such as GSK3 and TSC2 phosphorylation, Akt activity is largely normal with genetic disruption of mTORC2 (Rictor or SIN1 KO) and subsequent reduction in p-AktSer473 [3,36,45–47]. In contrast, Akt phosphorylation sites on FoxO1 and FoxO3a have been found to be impaired with blockade of mTORC2 activity by several groups [3,4,36,45,46]. It remains to be seen whether reduced p-AktSer473 affects a certain subset of Akt substrates.
The role of mTORC2 in metabolism in mature skeletal muscle in vivo has not previously been studied. Together with in vitro evidence by others [36,48], our data suggest that mTORC2 may play a role in muscle insulin resistance. Although the liver, like muscle, is an important organ in regulating whole-body glucose homeostasis [49]; and liver mTORC2 activity was inhibited following AZD8055 injection, the observation that AZD8055-induced glucose intolerance is absent in Rictor mKO mice indicates that reduced muscle mTORC2 activity accounts for most of the impairment in whole-body glucose metabolism with acute global mTOR inhibition. In contrast, chronic rapamycin treatment leads to whole-body insulin resistance by disrupting liver mTORC2 signaling and increasing liver glucose output [19]. The difference between our study and the chronic rapamycin study [19] likely indicates the different responses to acute and chronic inhibition of the mTOR complexes.
In conclusion, we have shown that acute mTOR inhibition by AZD8055 leads to insulin resistance and glucose intolerance along with changes in substrate utilization. Insulin-mediated glucose transport into muscle cells is perturbed despite normal GLUT4 translocation, which points to an intracellular glucose handling defect. Fittingly, AZD8055 suppressed glycolysis through inhibition of mTORC2, and furthermore Rictor deficient muscle exhibited impaired in vivo glucose uptake along with muscle glucose accumulation. These findings warrant future investigations into the physiological role of mTORC2 in skeletal muscle, which as a large glucose sink is indispensable for normal glucose homeostasis. In addition, the severe metabolic consequences following AZD8055 treatment may limit the clinical usefulness of mTOR-KIs.
Authors' contributions
MK and EAR designed and conceived the studies and wrote the manuscript. MK performed all the mouse studies and the subsequent tissue and plasma analyses, along with data analyses. LSH greatly assisted in all the animal studies and provided guidance in preparation of the manuscript. DJF, JRK, KC and GY performed the WT and SIN1 KO experiments in MEF cells. AJO with assistance from MK performed the L6 cell experiments. TEJ assisted in the in vivo studies in the Rictor mKO mice. MAR generated the Rictor mKO mice. PS performed genotyping of the Rictor mKO mice. ABJ prepared the giant sarcolemmal vesicles. DEJ, BK supervised part of the studies and provided critical guidance in the preparation of the manuscript. All authors read and provided comments on the final version of the manuscript.
Competing financial interests
The authors declare no competing financial interests.
Acknowledgments
We thank Amira Klip, Bing Su and Estela Jacinto for shared reagents. We also thank Irene Bech Nielsen and Betina Bolmgren (University of Copenhagen) for their skillful technical assistance. This work was supported by grants from The Danish Council for Independent Research|Natural Sciences, The Danish Council for Independent Research|Medical Sciences, the Novo Nordisk Foundation,The Lundbeck Foundation, and the University of Copenhagen Excellence Program for Interdisciplinary Research (2016). In addition it was supported by a NHMRC Program Grant (DEJ). DEJ is a NHMRC senior principal research fellow.
Conflict of interest
None declared.
Appendix A. Supplementary data
The following are the Supplementary data related to this article:
Supplemental Figure S1.
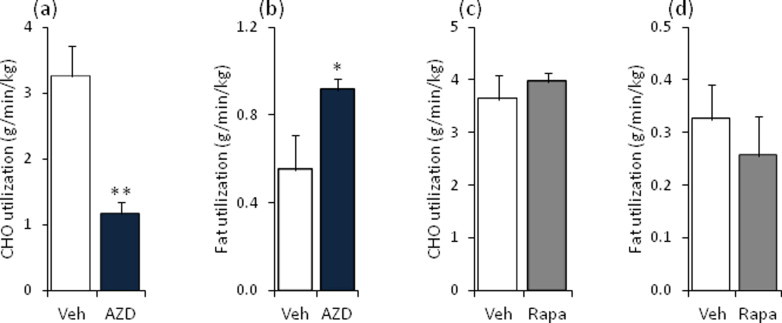
Substrate utilization is altered in mice injected with AZD8055. Overnight fasted mice were intraperitoneal-injected with vehicle or AZD8055 (10 mg kg−1); or vehicle or rapamycin (4 mg kg−1) before re-feeding was initiated. (a,c) Carbohydrate (CHO) and (b,d) fat utilizations were calculated based on the respiratory exchange ratio (Figure 1) throughout 6 h of re-feeding (n = 3–4). **p < 0.01 and *p < 0.05 different from vehicle. Data are means ± SEM.
Supplemental Figure S2.

Total protein expression of AS160, p70S6K1, Akt2, NDRG1, and beta-actin two hours after in vivo AZD8055 injection in insulin responsive tissues. (a) Representative western blots and (b–f) quantitative analysis of indicated total protein immunoblot detection in mouse gastrocnemius, quadriceps, liver, heart, and adipose tissue two hours after vehicle or AZD8055 injection (n = 8; for adipose tissue n = 4). Corresponding phospho-blots are in Figure 2. *p < 0.05 and (*)p < 0.1 different from vehicle within each tissue. Data are means ± SEM.
Supplemental Figure S3.
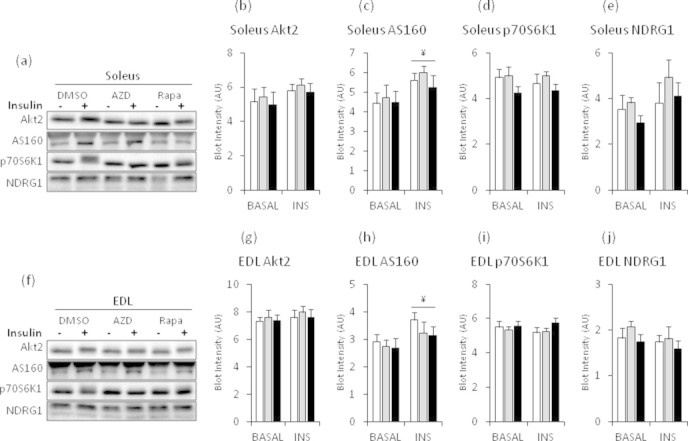
Total protein expression of AS160, p70S6K1, Akt2, and NDRG1 following one hour of AZD8055 or rapamycin incubations ex vivo in mouse soleus and EDL muscles. (a,f) Representative western blots for soleus and EDL muscles. (b–e, g–j) quantitative analysis of indicated total protein immunoblot detection in mouse soleus and EDL muscles that were incubated in 0.1% DMSO, 640 nM AZD8055 or 1 μM rapamycin for 60 min. During the last 30 min indicated muscles were stimulated with insulin (60 nM) (n = 7–8). Corresponding phospho-blots are in Figure 5. ¥p < 0.05 main effect of insulin. Data are means ± SEM.
References
- 1.Laplante M., Sabatini D. MTOR signaling in growth control and disease. Cell. 2012;149:274–293. doi: 10.1016/j.cell.2012.03.017. [DOI] [PMC free article] [PubMed] [Google Scholar]
- 2.Hagiwara A., Cornu M., Cybulski N., Polak P., Betz C., Trapani F. Hepatic MTORC2 activates glycolysis and lipogenesis through Akt, glucokinase, and SREBP1c. Cell Metabolism. 2012;15:725–738. doi: 10.1016/j.cmet.2012.03.015. [DOI] [PubMed] [Google Scholar]
- 3.Kumar A., Lawrence J.C., Jung D.Y., Ko H.J., Keller S.R., Kim J.K. Fat cell-specific ablation of rictor in mice impairs insulin-regulated fat cell and whole-body glucose and lipid metabolism. Diabetes. 2010;59:1397–1406. doi: 10.2337/db09-1061. [DOI] [PMC free article] [PubMed] [Google Scholar]
- 4.Yuan M., Pino E., Wu L., Kacergis M., Soukas A.A. Identification of Akt-independent regulation of hepatic lipogenesis by mammalian target of rapamycin (MTOR) complex 2. Journal of Biological Chemistry. 2012;287:29579–29588. doi: 10.1074/jbc.M112.386854. [DOI] [PMC free article] [PubMed] [Google Scholar]
- 5.Kocalis H.E., Hagan S.L., George L., Turney M.K., Siuta M.A., Laryea G.N. Rictor/MTORC2 facilitates central regulation of energy and glucose homeostasis. Molecular Metabolism. 2014;3:394–407. doi: 10.1016/j.molmet.2014.01.014. [DOI] [PMC free article] [PubMed] [Google Scholar]
- 6.Sarbassov D.D., Guertin D.A., Ali S.M., Sabatini D.M. Phosphorylation and regulation of Akt/PKB by the rictor-MTOR complex. Science. 2005;307:1098–1101. doi: 10.1126/science.1106148. [DOI] [PubMed] [Google Scholar]
- 7.Benjamin D., Colombi M., Moroni C., Hall M.N. Rapamycin passes the torch: a new generation of MTOR inhibitors. Nature Reviews Drug Discovery. 2011;10:868–880. doi: 10.1038/nrd3531. [DOI] [PubMed] [Google Scholar]
- 8.Selman C., Tullet J.M.A., Wieser D., Irvine E., Lingard S.J., Choudhury A.I. Ribosomal protein S6 kinase 1 signaling regulates mammalian life span. Science. 2009;326:140–144. doi: 10.1126/science.1177221. [DOI] [PMC free article] [PubMed] [Google Scholar]
- 9.Anisimov V.N., Zabezhinski M.A., Popovich I.G., Piskunova T.S., Semenchenko A.V., Tyndyk M.L. Rapamycin increases lifespan and inhibits spontaneous tumorigenesis in inbred female mice. Cell Cycle. 2011;10:4230–4236. doi: 10.4161/cc.10.24.18486. [DOI] [PubMed] [Google Scholar]
- 10.Chen C., Liu Y., Liu Y., Zheng P. MTOR regulation and therapeutic rejuvenation of aging hematopoietic stem cells. Science Signalling. 2009;2:ra75. doi: 10.1126/scisignal.2000559. [DOI] [PMC free article] [PubMed] [Google Scholar]
- 11.Harrison D.E., Strong R., Sharp Z.D., Nelson J.F., Astle C.M., Flurkey K. Rapamycin fed late in life extends lifespan in genetically heterogeneous mice. Nature. 2009;460:392–395. doi: 10.1038/nature08221. [DOI] [PMC free article] [PubMed] [Google Scholar]
- 12.Neff F., Flores-Dominguez D., Ryan D.P., Horsch M., der S., Adler T. Rapamycin extends murine lifespan but has limited effects on aging. The Journal of Clinical Investigation. 2013;123:3272–3291. doi: 10.1172/JCI67674. [DOI] [PMC free article] [PubMed] [Google Scholar]
- 13.Miller R.A., Harrison D.E., Astle C.M., Baur J.A., Boyd A.R., de Cabo R. Rapamycin, but not resveratrol or simvastatin, extends life span of genetically heterogeneous mice. The Journals of Gerontology Series A: Biological Sciences and Medical Sciences. 2011;66A:191–201. doi: 10.1093/gerona/glq178. [DOI] [PMC free article] [PubMed] [Google Scholar]
- 14.Chang G.R., Wu Y.Y., Chiu Y.S., Chen W.Y., Liao J.W., Hsu H.M. Long-term administration of rapamycin reduces adiposity, but impairs glucose tolerance in high-fat diet-fed KK/HlJ mice. Basic & Clinical Pharmacology & Toxicology. 2009;105:188–198. doi: 10.1111/j.1742-7843.2009.00427.x. [DOI] [PubMed] [Google Scholar]
- 15.Fang Y., Westbrook R., Hill C., Boparai R., Arum O., Spong A. Duration of rapamycin treatment has differential effects on metabolism in mice. Cell Metabolism. 2013;17:456–462. doi: 10.1016/j.cmet.2013.02.008. [DOI] [PMC free article] [PubMed] [Google Scholar]
- 16.Fraenkel M., Ketzinel-Gilad M., Ariav Y., Pappo O., Karaca M., Castel J. MTOR inhibition by rapamycin prevents beta-cell adaptation to hyperglycemia and exacerbates the metabolic state in type 2 diabetes. Diabetes. 2008;57:945–957. doi: 10.2337/db07-0922. [DOI] [PubMed] [Google Scholar]
- 17.Houde V.P., Brûlé S., Festuccia W.T., Blanchard P.G., Bellmann K., Deshaies Y. Chronic rapamycin treatment causes glucose intolerance and hyperlipidemia by upregulating hepatic gluconeogenesis and impairing lipid deposition in adipose tissue. Diabetes. 2010;59:1338–1348. doi: 10.2337/db09-1324. [DOI] [PMC free article] [PubMed] [Google Scholar]
- 18.Yang S.B., Lee H., Young D., Tien A.C., Rowson-Baldwin A., Shu Y. Rapamycin induces glucose intolerance in mice by reducing islet mass, insulin content, and insulin sensitivity. Journal of Molecular Medicine. 2012;90:575–585. doi: 10.1007/s00109-011-0834-3. [DOI] [PMC free article] [PubMed] [Google Scholar]
- 19.Lamming D.W., Ye L., Katajisto P., Goncalves M.D., Saitoh M., Stevens D.M. Rapamycin-induced insulin resistance is mediated by MTORC2 loss and uncoupled from longevity. Science. 2012;335:1638–1643. doi: 10.1126/science.1215135. [DOI] [PMC free article] [PubMed] [Google Scholar]
- 20.Thoreen C.C., Kang S.A., Chang J.W., Liu Q., Zhang J., Gao Y. An ATP-competitive mammalian target of rapamycin inhibitor reveals rapamycin-resistant functions of MTORC1. Journal of Biological Chemistry. 2009;284:8023–8032. doi: 10.1074/jbc.M900301200. [DOI] [PMC free article] [PubMed] [Google Scholar]
- 21.Sarbassov D.D., Ali S.M., Sengupta S., Sheen J.H., Hsu P.P., Bagley A.F. Prolonged rapamycin treatment inhibits MTORC2 assembly and Akt/PKB. Molecular Cell. 2006;22:159–168. doi: 10.1016/j.molcel.2006.03.029. [DOI] [PubMed] [Google Scholar]
- 22.Bentzinger C.F., Romanino K., Cloetta D., Lin S., Mascarenhas J.B., Oliveri F. Skeletal muscle-specific ablation of raptor, but not of rictor, causes metabolic changes and results in muscle dystrophy. Cell Metabolism. 2008;8:411–424. doi: 10.1016/j.cmet.2008.10.002. [DOI] [PubMed] [Google Scholar]
- 23.Chresta C.M., Davies B.R., Hickson I., Harding T., Cosulich S., Critchlow S.E. AZD8055 is a potent, selective, and orally bioavailable ATP-competitive mammalian target of rapamycin kinase inhibitor with in vitro and in vivo antitumor activity. Cancer Research. 2010;70:288–298. doi: 10.1158/0008-5472.CAN-09-1751. [DOI] [PubMed] [Google Scholar]
- 24.Couture S., Massicotte D., Lavoie C., Hillaire-Marcel C., Péronnet F. Oral [13C]Glucose and endogenous energy substrate oxidation during prolonged treadmill running. Journal of Applied Physiology. 2002;92:1255–1260. doi: 10.1152/japplphysiol.00437.2001. [DOI] [PubMed] [Google Scholar]
- 25.Jensen T.E., Rose A.J., Jørgensen S.B., Brandt N., Schjerling P., Wojtaszewski J.F.P. Possible CaMKK-dependent regulation of AMPK phosphorylation and glucose uptake at the onset of mild tetanic skeletal muscle contraction. American Journal of Physiology – Endocrinology and Metabolism. 2007;292:E1308–E1317. doi: 10.1152/ajpendo.00456.2006. [DOI] [PubMed] [Google Scholar]
- 26.Wang Q., Khayat Z., Kishi K., Ebina Y., Klip A. GLUT4 translocation by insulin in intact muscle cells: detection by a fast and quantitative assay. FEBS Letters. 1998;427:193–197. doi: 10.1016/s0014-5793(98)00423-2. [DOI] [PubMed] [Google Scholar]
- 27.Somwar R., Sweeney G., Ramlal T., Klip A. Stimulation of glucose and amino acid transport and activation of the insulin signaling pathways by insulin lispro in L6 skeletal muscle cells. Clinical Therapeutics. 1998;20:125–140. doi: 10.1016/s0149-2918(98)80040-4. [DOI] [PubMed] [Google Scholar]
- 28.Ploug T., Wojtaszewski J., Kristiansen S., Hespel P., Galbo H., Richter E.A. Glucose transport and transporters in muscle giant vesicles: differential effects of insulin and contractions. American Journal of Physiology – Endocrinology and Metabolism. 1993;264:E270–E278. doi: 10.1152/ajpendo.1993.264.2.E270. [DOI] [PubMed] [Google Scholar]
- 29.Prabhu A.V., Krycer J.R., Brown A.J. Overexpression of a key regulator of lipid homeostasis, Scap, promotes respiration in prostate cancer cells. FEBS Letters. 2013;587:983–988. doi: 10.1016/j.febslet.2013.02.040. [DOI] [PubMed] [Google Scholar]
- 30.Maarbjerg S.J., Jorgensen S.B., Rose A.J., Jeppesen J., Jensen T.E., Treebak J.T. Genetic impairment of AMPKalpha2 signaling does not reduce muscle glucose uptake during treadmill exercise in mice. American Journal of Physiology – Endocrinology and Metabolism. 2009;297:E924–E934. doi: 10.1152/ajpendo.90653.2008. [DOI] [PubMed] [Google Scholar]
- 31.Lowry O.H., Passonneau J.V. Academic Press; New York: 1972. A flexible system of enzymatic analysis. [Google Scholar]
- 32.Humphrey S.J., James D.E. Uncaging Akt. Science Signalling. 2012;5:e20. doi: 10.1126/scisignal.2003085. [DOI] [PubMed] [Google Scholar]
- 33.Miinea C.P., Sano H., Kane S., Sano E., Fukuda M., Peranen J. AS160, the Akt substrate regulating GLUT4 translocation, has a functional Rab GTPase-activating protein domain. Biochemical Journal. 2005;391:87–93. doi: 10.1042/BJ20050887. [DOI] [PMC free article] [PubMed] [Google Scholar]
- 34.Sano H., Kane S., Sano E., Mîinea C.P., Asara J.M., Lane W.S. Insulin-stimulated phosphorylation of a Rab GTPase-activating protein regulates GLUT4 translocation. Journal of Biological Chemistry. 2003;278:14599–14602. doi: 10.1074/jbc.C300063200. [DOI] [PubMed] [Google Scholar]
- 35.Masui K., Tanaka K., Akhavan D., Babic I., Gini B., Matsutani T. MTOR complex 2 controls glycolytic metabolism in glioblastoma through FoxO acetylation and upregulation of C-Myc. Cell Metabolism. 2013;18:726–739. doi: 10.1016/j.cmet.2013.09.013. [DOI] [PMC free article] [PubMed] [Google Scholar]
- 36.Kumar A., Harris T.E., Keller S.R., Choi K.M., Magnuson M.A., Lawrence J.C. Muscle-specific deletion of rictor impairs insulin-stimulated glucose transport and enhances basal glycogen synthase activity. Molecular and Cellular Biology. 2008;28:61–70. doi: 10.1128/MCB.01405-07. [DOI] [PMC free article] [PubMed] [Google Scholar]
- 37.Tremblay F., Gagnon A., Veilleux A., Sorisky A., Marette A. Activation of the mammalian target of rapamycin pathway acutely inhibits insulin signaling to Akt and glucose transport in 3T3-L1 and human adipocytes. Endocrinology. 2005;146:1328–1337. doi: 10.1210/en.2004-0777. [DOI] [PubMed] [Google Scholar]
- 38.Tzatsos A., Kandror K.V. Nutrients suppress phosphatidylinositol 3-kinase/Akt signaling via raptor-dependent MTOR-mediated insulin receptor substrate 1 phosphorylation. Molecular and Cellular Biology. 2006;26:63–76. doi: 10.1128/MCB.26.1.63-76.2006. [DOI] [PMC free article] [PubMed] [Google Scholar]
- 39.Krebs M., Brunmair B., Brehm A., Artwohl M., Szendroedi J., Nowotny P. The mammalian target of rapamycin pathway regulates nutrient-sensitive glucose uptake in man. Diabetes. 2007;56:1600–1607. doi: 10.2337/db06-1016. [DOI] [PubMed] [Google Scholar]
- 40.Miller A.M., Brestoff J.R., Phelps C.B., Berk E.Z., Reynolds T.H. Rapamycin does not improve insulin sensitivity despite elevated mammalian target of rapamycin complex 1 activity in muscles of Ob/Ob mice. American Journal of Physiology – Regulatory, Integrative and Comparative Physiology. 2008;295:R1431–R1438. doi: 10.1152/ajpregu.90428.2008. [DOI] [PMC free article] [PubMed] [Google Scholar]
- 41.Polak P., Cybulski N., Feige J.N., Auwerx J., Rüegg M.A., Hall M.N. Adipose-specific knockout of raptor results in lean mice with enhanced mitochondrial respiration. Cell Metabolism. 2008;8:399–410. doi: 10.1016/j.cmet.2008.09.003. [DOI] [PubMed] [Google Scholar]
- 42.Mora A., Davies A.M., Bertrand L., Sharif I., Budas G.R., Jovanovic S. Deficiency of PDK1 in cardiac muscle results in heart failure and increased sensitivity to hypoxia. The EMBO Journal. 2003;22:4666–4676. doi: 10.1093/emboj/cdg469. [DOI] [PMC free article] [PubMed] [Google Scholar]
- 43.Mora A., Lipina C., Tronche F., Sutherland C., Alessi D.R. Deficiency of PDK1 in liver results in glucose intolerance, impairment of insulin-regulated gene expression and liver failure. Biochemical Journal. 2005;385:639–648. doi: 10.1042/BJ20041782. [DOI] [PMC free article] [PubMed] [Google Scholar] [Retracted]
- 44.Zhao X., Lu S., Nie J., Hu X., Wen L., Wu X. Phosphoinositide-dependent kinase and MTORC2 synergistically maintain postnatal heart growth and heart function in mice. Molecular and Cellular Biology. 2014;11:1966–1975. doi: 10.1128/MCB.00144-14. [DOI] [PMC free article] [PubMed] [Google Scholar]
- 45.Guertin D.A., Stevens D.M., Thoreen C.C., Burds A.A., Kalaany N.Y., Moffat J. Ablation in mice of the MTORC components raptor, rictor, or MLST8 reveals that MTORC2 is required for signaling to Akt-FOXO and PKCa, but not S6K1. Developmental Cell. 2006;11:859–871. doi: 10.1016/j.devcel.2006.10.007. [DOI] [PubMed] [Google Scholar]
- 46.Jacinto E., Facchinetti V., Liu D., Soto N., Wei S., Jung S.Y. SIN1/MIP1 maintains rictor-MTOR complex integrity and regulates Akt phosphorylation and substrate specificity. Cell. 2006;127:125–137. doi: 10.1016/j.cell.2006.08.033. [DOI] [PubMed] [Google Scholar]
- 47.Shiota C., Woo J.T., Lindner J., Shelton K.D., Magnuson M.A. Multiallelic disruption of the rictor gene in mice reveals that MTOR complex 2 is essential for fetal growth and viability. Developmental Cell. 2006;11:583–589. doi: 10.1016/j.devcel.2006.08.013. [DOI] [PubMed] [Google Scholar]
- 48.Ye L., Varamini B., Lamming D.W., Sabatini D.M., Baur J.A. Rapamycin has a biphasic effect on insulin sensitivity in C2C12 myotubes due to sequential disruption of MTORC1 and MTORC2. Frontiers in Genetics. 2012;3 doi: 10.3389/fgene.2012.00177. [DOI] [PMC free article] [PubMed] [Google Scholar]
- 49.Moore M.C., Coate K.C., Winnick J.J., An Z., Cherrington A.D. Regulation of hepatic glucose uptake and storage in vivo. Advances in Nutrition: An International Review Journal. 2012;3:286–294. doi: 10.3945/an.112.002089. [DOI] [PMC free article] [PubMed] [Google Scholar]