

Abstract
Obesity is associated with an activated macrophage phenotype in multiple tissues that contributes to tissue inflammation and metabolic disease. To evaluate the mechanisms by which obesity potentiates myeloid activation, we evaluated the hypothesis that obesity activates myeloid cell production from bone marrow progenitors to potentiate inflammatory responses in metabolic tissues. High fat diet-induced obesity generated both quantitative increases in myeloid progenitors as well as a potentiation of inflammation in macrophages derived from these progenitors. In vivo, hematopoietic stem cells from obese mice demonstrated the sustained capacity to preferentially generate inflammatory CD11c+ adipose tissue macrophages after serial bone marrow transplantation. We identified that hematopoietic MyD88 was important for the accumulation of CD11c+ adipose tissue macrophage accumulation by regulating the generation of myeloid progenitors from HSCs. These findings demonstrate that obesity and metabolic signals potentiate leukocyte production and that dietary priming of hematopoietic progenitors contributes to adipose tissue inflammation.
Keywords: Obesity, Hematopoietic stem cells, Myelopoiesis
1. Introduction
The prevalence of obesity has tripled in the United States over the past three decades [1]. As a result, the burden of obesity-related morbidity has increased dramatically, generating an urgent need to understand the mechanisms that promote metabolic disease. Substantial evidence supports the contribution of obesity-induced inflammation (metainflammation) to diseases such as diabetes and cardiovascular disease via the pro-inflammatory activation of leukocytes in mice [2–4] and humans [5–7]. In humans and animal models, obesity is associated with a pro-inflammatory activation profile of macrophages in a wide variety of tissues that include the liver, adipose tissue, skeletal muscle, pancreatic islets, and the hypothalamus. A major site of leukocyte activation is visceral adipose tissue where a pro-inflammatory population of CD11c+ adipose tissue macrophages (ATMs) accumulates with progressive obesity [8–10]. CD11c+ ATMs secrete pro-inflammatory cytokines and promote an M1-like activation profile in adipose tissue that contributes to adipocyte dysfunction and insulin resistance [9,11]. Activated macrophages have also been implicated in metabolic dysfunction in the liver [12], pancreas [13], and central nervous system [14,15]. Numerous studies in mice have shown that suppression of this macrophage activation can uncouple obesity from metabolic disease and the development of insulin resistance [16–18].
The processes that govern the accumulation of pro-inflammatory macrophages in diverse tissues in response to obesity are not fully understood. Obesity-induced ATM accumulation is dependent on the trafficking of monocytes to adipose tissue where they are differentiate into macrophages and surround dead and dying adipocytes [19–23]. Consistent with this, obesity triggers an expansion of the pool of circulating classical blood monocytes (CCR2+ Ly6chi) in mice. Similar observations are seen in obese humans as an increase in the frequency of circulating neutrophils and CD14dim CD16+ monocytes is seen in obese insulin resistant patients [24] and is suppressed with weight loss [11,25].
These observations suggest that myeloid cell production and activation may be an important regulated step in generating metainflammation and a biomarker of obesity-induced inflammation. While atherosclerosis prone mice have been shown to harbor a reservoir of Ly6chi monocytes within the spleen [26], the primary site of monocyte production is the bone marrow (BM) compartment where they are generated from hematopoietic stem cells (HSCs) [27]. HSCs are active participants in peripheral inflammatory responses and can alter their cellular output depending on environmental cues [28]. In sepsis, lipopolysaccharide (LPS) can “push” HSCs to increase production of myeloid cells by direct [29,30] and indirect [31] action on HSCs in order to potentiate peripheral immune responses. Consistent with this, clinical studies have identified an increase in circulating hematopoietic progenitors in obese patients suggesting that obesogenic cues can trigger the activation of HSCs [32]. Diabetes associated hyperglycemia has been identified as one potential signal that increases myeloid cell production from the BM [33,34].
Many studies have supported a role for MyD88 and TLR signaling in the development of obesity-associated metainflammation [35]. Activation of these pathways within adipose tissue have been implicated in potentiating HSC activation toward myelopoiesis [36]. These pathways have also been implicated in the activation of myelopoiesis in other inflammatory settings [37]. It remains unclear how TLR/MyD88 on hematopoietic stem cells may contribute to high fat diet-induced inflammation.
Based on these observations, we examined the hypothesis that myeloid cell production by HSCs is potentiated by high fat diet induced obesity and plays a crucial role in the generation of pro-inflammatory tissue macrophages. Using mouse models of obesity, we found that obesity induces qualitative and quantitative changes in myeloid BM progenitors that amplify the generation of CD11c+ ATMs. Serial transplantation experiments demonstrate that long term self-renewing HSCs (LT-HSC) retain this property in a cell autonomous fashion. Competitive reconstitution experiments demonstrate that the capacity of HSCs to activate myelopoiesis is dependent on MyD88 for the generation of CD11c+ ATMs in visceral adipose depots.
2. Materials and methods
2.1. Animals and animal care
Mice used in these experiments were male C57Bl/6J, CD45.1 CD57 Bl/6J mice (B6.SJL-Ptprca Pepcb/BoyJ), Tlr4−/− and MyD88−/− (Jackson Laboratories). Heterozygous CD45 1.2 mice were bred for BMT experiments. Mice were fed ad lib either a control normal diet (ND) consisting of 4.5% fat (5001; LabDiet) or a high fat diet (HFD) of 60% of calories from fat (Research Diets, Inc., D12492) starting at 6–8 weeks of age for 16 weeks unless specified. In all experiments animals were age matched by purchase or less then one week apart in date of birth. Animals were housed in a specific pathogen-free facility with a 12 h light/12 h dark cycle and given free access to food and water. All animal use was in compliance with the Institute of Laboratory Animal Research Guide for the Care and Use of Laboratory Animals and approved by the University Committee on Use and Care of Animals at the University of Michigan (Animal welfare assurance number A3114-01). Peritoneal macrophages were elicited by 2 ml of 3% thioglycollate injection as previously described [20].
2.2. Cell culture
BM cells were isolated from C57Bl/6 mice by flushing of tibia and fibula. After RBC lysis, cells were plated at 1.5 × 10⁶ cells/ml prior to differentiation into BM derived macrophages (BMMP, 20% L929 conditioned media) or BM derived dendritic cells (BMDC, GM-CSF) for 6 days as previously described [38]. Differentiation was confirmed by demonstrating CD11c and MHCII expression in BMDC by flow cytometry. Cells were then placed in 10% serum media for 24 h prior to treatment with LPS (10–100 ng/ml) for 18–24 h. Cells were sorted by fluorescent activated cell sorting in the University of Michigan core facility for CD11c+ live BMDC or BMMP.
2.3. Microarray and real-time RT-PCR
RNA extraction was performed with an RNeasy kit (Qiagen). RT reactions were performed and real-time PCR analysis was performed normalized to GAPDH (SYBR Green, ABI Prism 7200 Sequence Detection System; Applied Biosystems). Relative expression was assessed by the comparative CT method correcting for amplification efficiency of the primers and performed in duplicate as previously described [9]. PCR primers used are reported in Supplementary Table 3. For microarray experiments, RNA quality was assessed on Agilent Bioanalyzer Picochip. RNA was amplified and RNA prepared as previously described before hybridization to Mouse Affymetrix 430 2.0 gene strip array [39]. After quality control assessments probe sets with unadjusted p-value of 0.05 or less were identified. Genes with significant differences from lean and obese cells were analyzed using DAVID and ConceptGen. Analysis was performed through the University of Michigan Microarray Core using affy, limma, and affy PLM packages of bioconductor implemented in the R statistical environment.
2.4. Adipose tissue stromal vascular fraction (SVF) isolation and flow cytometry
Adipose tissue fractionation and flow cytometry analysis was performed as previously described [40]. Whole adipose tissue was digested in collagenase (1 mg/ml) and SVF fraction pelleted. After red blood cell lysis cells were stained with CD64 PE, CD45.1 PECy7, CD45.2 e450, F4/80-APC, CD11b-APC-Cy7, and CD11c-PE-Cy7 (eBioscience) [9]. Stained cells were analyzed using Canto II cytometer. Initial gating focused on CD45+ singlet cells. Macrophages were identified as F4/80+ CD11b+ or CD64+ cells in the CD45+ gate and then differentiated based on CD11c expression as shown in Supplementary Figure 1.
2.5. Flow cytometry assessment of HSC and myeloid progenitors
BM from one femur was flushed with PBS, made into single cell suspension with a syringe, and centrifuged. Pellet with then treated with RBC lysis solution for 5 min. After re-suspension in PBS and washing cells were stained with lineage markers on APC (CD4, CD5, CD8, CD11b, B220 (CD45R), Gr1, Ter119, CD41) (eBioscience), CD117 APCCy7 (eBioscience), Sca 1 PECy7 (eBioscience), CD150 PE (Biolegend), Endoglin Pacific Blue (Biolegend), CD16/32 PerCP5.5 (eBioscience) and gating as described by Pronk et al. [41]. Initial gating identified lineage (CD4, CD5, CD8, CD11b, B220, Gr1, Ter119, CD41) negative singlet cells. Cells were classified as Lin− Sca+ Kit+ (LSK) or Lin− Kit+ (LK). LSK cells were further subdivided between Endoglin− CD150− multipotent progenitors (MPP) or Endoglin+ CD150+ long term hematopoietic stem cells (LT-HSC). LK cells were further subdivided between CD16/32+ CD150− granulocyte macrophage progenitors (GMP) or CD16/32− CD150−Endoglin− pre-granulocyte macrophage (Pre-GM) cells. Representative sample showed in Supplementary Figure 1B. In competitive BMTs CD45.1 and CD45.2 stains were used for determining donors in the blood and SVF. Within the BM compartment and HSC staining CD45.2 staining was used to differentiate the CD45.2 and CD45.1 donor groups.
2.6. Colony forming unit assays
BM from a femur was flushed with IMDM media. Cells were then re-suspended in methocult media and plated at 10,000 cells per plate per protocol (Stem Cell Technology). After 7 days, colonies were counted.
2.7. BM transplantation
BM cells were isolated from donor groups [42] and injected retro-orbitally into lethally irradiated (900 Rad) 6 week old recipient mice (10 million cells/mouse). LSK BMTs were performed with 4000 sorted LSK cells with 0.5 × 10⁶ whole BM from a CD45 1.2 mouse. Competitive BMTs were performed with 5 million cells from each donor mouse (CD45.1 and CD45.2) per recipient. Animals were treated with antibiotics (polymyxin and neomycin) for 4 weeks post BM transplantation. Blood flow analysis was performed to assess reconstitution two weeks after bone marrow transplantation. Following two weeks of normal chow diet, they were started on ND or HFD diets as detailed in individual results sections. Glucose tolerance testing was performed as described [20] after 6 h of fasting with intraperitoneal injection of 0.7 g/kg of dextrose.
2.8. Statistics
Results are presented as mean ± SEM. Statistical analyses were conducted using a 2-sample Student's t-test, with significance set at p-value <0.05. For competitive BMT experiments the ratio from donor groups was compared to 1 using one-sample t-test. Results with multiple groups were first assessed with one-way or two-way ANOVA as appropriate followed by confirmatory analysis.
3. Results
3.1. Bone marrow derived myeloid cells from obese mice are polarized towards an activated state ex vivo
The activation profile of macrophages is the result of a combination of the tissue microenvironment and the potential of myeloid progenitors and monocytes from which they are derived [28]. To examine the hypothesis that obesity modifies the profile of BM derived myeloid cells, BM dendritic cells (BMDC) were generated from C57Bl/6 mice fed a normal (ND) or 60% high fat diet (HFD) for 12 weeks. These cells were chosen given the similarities between BMDCs and obesity-associated ATMs in terms of the induction of CD11c and APC function [43]. After 7 days of ex vivo differentiation in GM-CSF, unstimulated BMDCs from HFD mice had significantly higher Tnfα, Il6, and Nos2 gene expression compared to BMDC from ND mice (Figure 1A). With LPS stimulation, BMDCs from obese mice had a higher induction of Il6 and Nos2 compared to BMDCs from lean mice (Figure 1B). Similar, gene expression changes were seen in BM derived macrophages from lean and obese mice. Flow cytometry analysis showed that BM from obese mice produced more mature MHCIIhigh CD11c+ BMDCs compared to lean mice, suggesting that BM cells from obese mice have a propensity toward a mature DC profile independent of stimulation (Figure 1C and D). Gene expression microarray analysis of unstimulated BMDCs derived from lean and obese mice identified 520 genes with increased expression in obese BMDCs and 84 genes with decreased expression in obese BMDCs compared to lean BMDCs. Pathway analysis identified “regulation of cell proliferation” and “immune system development” as gene sets that were most significantly increased in HFD derived BMDCs (Supplementary Tables 1 and 2, Figure 1E). These observations demonstrate that diet induced obesity (DIO) promotes a pro-inflammatory profile in BM derived myeloid cells that persists even after removal from the obesogenic environment.
Figure 1.
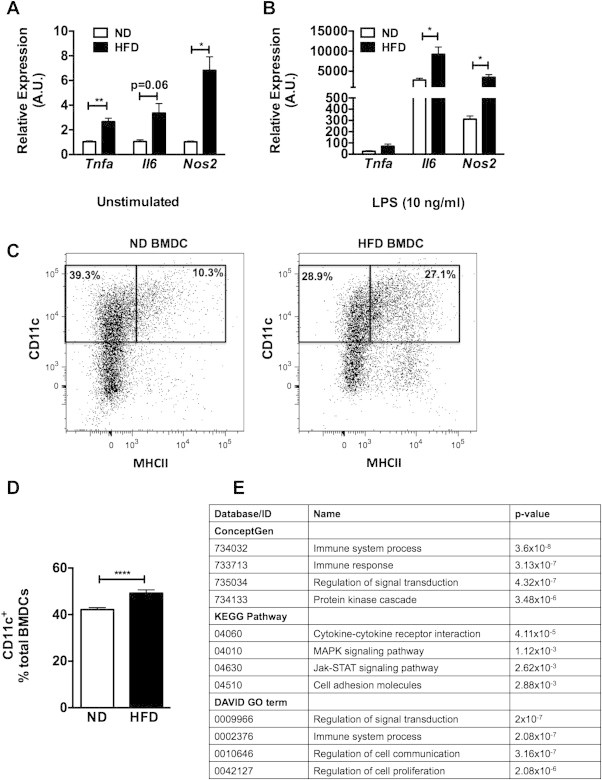
Bone marrow derived cells from obese mice are polarized towards an activated state. BM cells from ND or HFD fed mice were differentiated in GM-CSF (n = 4 wells). After (A) vehicle or (B) LPS stimulation for 6 h, M1 gene expression analyzed by RT-PCR. (C and D) Representative flow cytometry assessment for MHCII CD11c in BMDC derived from ND and HFD fed mice (n = 3 per group). (E) Results of pathway analysis from microarray of genes overexpressed in BMDC derived from obese mice compared to lean. Table of most-significant pathways shown. Two-sided Student's t-test. *p < 0.05, **p < 0.01, ****p < 0.001.
3.2. Obesity primes macrophages for inflammatory trafficking
To assess whether obesity primes BM-derived myeloid cells for a pro-inflammatory response in vivo, we examined macrophage activation in a competitive mixed chimera model. ND (CD45.1) and HFD (CD45.2) BM was mixed in a 1:1 ratio prior to injected into lethally irradiated lean mice (CD45.1) (Figure 2A). After reconstitution, animals were injected IP with PBS or thioglycollate (Thio) to induce peritoneal macrophage (PM) accumulation (Figure 2B). PMs were collected by lavage and CD45 chimerism assessed by flow cytometry to evaluate the differential contribution of BM precursors from ND and HFD mice to PMs (Figure 2C). PMs from control PBS injected mice had a CD45.2/CD45.1 ratio of HFD to ND derived cells significantly less than 1 that was similar to blood leukocyte chimerism (Figure 2D). This represents the baseline reconstitution of the myeloid compartment in this experimental paradigm. With Thio administration the CD45.2/CD45.1 ratio of PMs was significantly increased demonstrating the preferential accumulation of macrophages derived from the HFD BM in the peritoneum with this inflammatory stimulus (Figure 2D). This is in contrast to the peritoneal neutrophils (PMNs) in the peritoneum where there was no change in the HFD/ND ratio indicating equal contributions of PMNs in the Thio treatment group. To examine the properties of the PMs derived from the different BM progenitors, HFD and ND derived PMs were sorted by FACS and cultured to assess cytokine production. CD45.2 PMs derived from HFD donors produced more TNFα after LPS stimulation compared to CD45.1 PMs from ND donors (Figure 2E). In summary, these observations support the in vitro studies and suggest that BM progenitors from obese mice are primed to generate macrophages with an increased capacity to traffic to inflammatory sites and maintain a proinflammatory profile.
Figure 2.
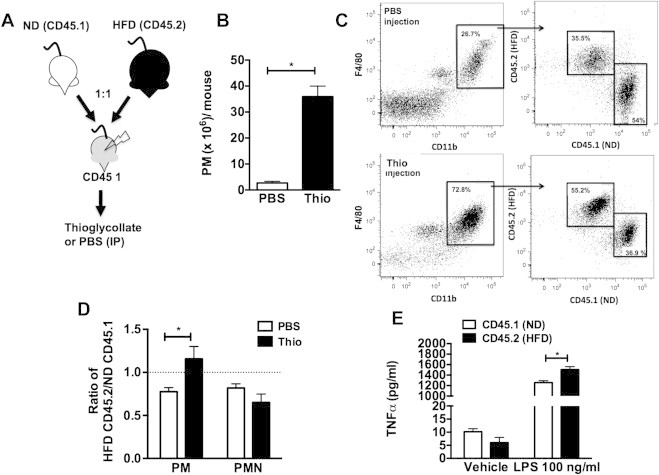
Obese BM derived macrophages are primed for inflammatory trafficking. (A) BM from ND (CD45.1) and HFD (CD45.2) mice were mixed in a 1:1 ratio prior to injection into CD45.1 wild-type mice. (B–D) IP injection of thioglycollate (Thio) was then used to induce PM recruitment and donor origin of the PMs (F4/80+CD11b+) assessed by flow cytometry using CD45 specific antibodies. Data reported as ratio of HFD derived (CD45.2) to ND derived (CD45.1) cells. (E) Cytokine production of FACS purified PMs from the different donor sources. This is representative data from two different experiments with similar results. Two-sided Student's t-test. *p < 0.05, N = 4.
3.3. HFD-induced obesity triggers the expansion of BM long-term HSCs and myeloid progenitors
We next examined the influence of DIO on the quantity HSCs and myeloid progenitors. Flow cytometry was used to quantify stem cell progenitors in the BM in mice fed either a ND chow or long-term HFD (8–16 weeks). HFD-fed animals had more fat mass, were glucose intolerant, and had increased Ly6chi blood monocytes and CD11c+ ATMs in perigonadal adipose tissue (Supplementary Figure 2A–D). Compared to ND controls, HFD increased the number of long term repopulating (LT) HSC (LSK CD150+) as well as all myeloid progenitor populations (MPP, GMP, Pre-GM) in the BM [41] (Figure 3A–E). Consistent with this result BM from HFD mice generated more granulocyte and macrophage CFU (Figure 3F). We did not observe a significant increase in the LT-HSCs or GMP populations in the spleen of HFD fed mice (Figure 3G). This demonstrates that HFD promotes the quantitative expansion of HSCs and generation of myeloid progenitors in the BM compartment.
Figure 3.
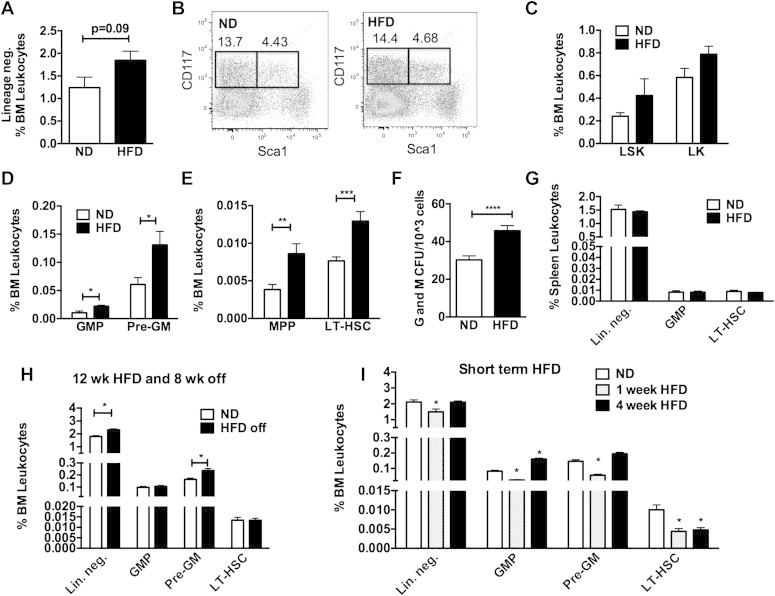
Long-term HSC and myeloid progenitors are increased with HFD. Flow cytometry quantitation of BM resident (A) lineage neg. (Lin−) cells, (B,C) LSK cells, (D) GMP and Pre-GM, and (E) LT-HSC and MPP populations in lean and DIO mice. (F) Granulocyte and macrophage colonies from BM of ND and HFD fed mice. (G) Analysis of splenic progenitors in lean and DIO mice. (H) Quantitation of BM progenitors in animals fed HFD for 12 weeks and then taken off diet and age matched ND fed controls. (I) Assessment of BM progenitors after short term HFD feeding. Two-sided Student's t-test for two group comparisons and one-way ANOVA with Tukey's multiple comparisons where three groups are present. *p < 0.05, **p < 0.01, ***p < 0.005. n = 4–8 per group.
Our previous experiments suggest that HFD leads to sustained changes in the production of myeloid cells from BM precursors. To examine this longitudinally, HFD fed mice (12 weeks) were switched off of HFD chow to ND chow for 8 weeks to induce weight loss. This diet switch led to a significant decrease in body weight to match those of age-matched ND controls (Supplementary Figure 2E) and a normalization of glycemic control based on glucose tolerance tests (Supplementary Figure 2F). In the BM, while the number of LT-HSCs normalized, the quantity of Pre-GMs and Lin− cells remained elevated in the BM despite weight loss and normalization of glucose tolerance (Figure 3H). This suggests that while the expansion of LT-HSC by DIO may be reversible, an increase in the production of some myeloid progenitors persists after removal of obesogenic stimuli.
To examine the effect of short term HFD feeding on BM HSCs, mice were examined after one and four weeks of HFD. One week of HFD feeding did not lead to significant differences in body weight (ND 30.35 ± 2.9 g and 1 week HFD 30.04 ± 3.9 g) but a rapid expansion of fat pad weight (ND 0.27 ± 0.11 g vs 1 week 0.70 ± 0.12 g, p < 0.0001). The number of LT-HSCs decreased with short term HFD. GMP and Pre-GM myeloid progenitors in the BM declined after one-week of HFD exposure and then increased by 4 weeks (Figure 3I). This suggests that rapid fat expansion with short term HFD exposure triggers a transient depletion of LT-HSCs followed by a later increase in the generation of myeloid BM progenitors.
3.4. BM from obese mice produces more Ly6chi monocytes and CD11c+ ATMs than lean mice after BMT
To compare the myeloid cell output between HSCs from lean and obese mice, BM from ND and HFD mouse donors (CD45.2) were injected into irradiated congenic CD45.1 lean mice. Mice that received HFD marrow (H ⇒ N) had increased numbers of Ly6chi monocytes (Figure 4A). Consistent with a continued myeloid bias after BMT, colony forming unit (CFU) assays from the chimeras showed that BM from H ⇒ N mice generated more granulocyte and myeloid colonies (CFU-G/M/GM) compared to mice reconstituted with ND donors N ⇒ N; (Figure 4B). Evaluation of ATMs demonstrated that H ⇒ N mice had an increased number of CD11c+ ATMs in visceral fat compared to N ⇒ N controls (Figure 4C). A set of chimeric mice was then fed a HFD 6 weeks after reconstitution. HFD increase the number of ATMs in gonadal fat to a similar degree in both donor groups. However, mice receiving HFD donor BM (H ⇒ H) had a higher percentage of CD11c+ ATMs in visceral adipose tissue compared to those receiving BM from ND fed donors (N ⇒ H). This generated an overall increase in the ratio of CD11c+ to CD11c− ATMs in H ⇒ H mice. Evaluation of adipose tissue T cells showed an increase in CD8+ T cells in fat with obesity, but no differences were seen between donor groups (Figure 4D). CD4+ T cells in fat were induced with obesity but were decreased in H ⇒ H compared to N ⇒ H. Analysis of adipose tissue regulatory T cells (Treg; CD4+ Foxp3+) showed a marginally significant decrease in Tregs in mice that received HFD BM. HFD challenged mice reconstituted with HFD BM were more insulin resistant than those receiving ND marrow based on elevated fasting insulin levels (Figure 4E) and glucose tolerance testing primarily during phase 2 (Figure 4F). No differences in glucose tolerance were seen between donor groups in lean ND fed mice.
Figure 4.
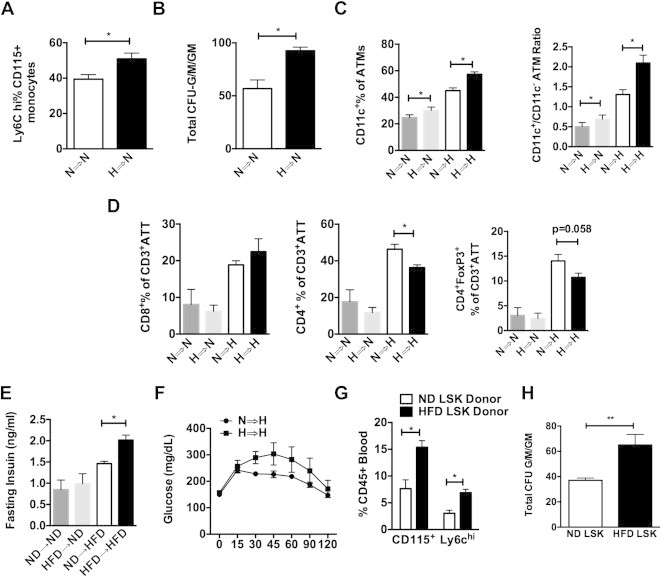
BM from HFD mice produce more Lychi monocytes and CD11c+ ATMs than ND mice after BMT. BM chimeras generated from ND or HFD donors. Groups are noted by the donor source followed by the dietary challenge (N = normal diet, H = high fat diet for 16 weeks). (A) Flow cytometry quantitation of Ly-6chi classical monocytes as a percentage of all CD115+ monocytes. N = 4. (B) Colony forming unit assays enumerating CFU-G/M/GM (N = 4 independent mice). (C) Flow cytometry quantitation of CD11c+ ATMs in gonadal white adipose tissue expressed as percentage of total ATMs and ratio of CD11c+/CD11c− ATMs. (D) Quantitation of T cells in adipose tissue expressed as percentage of total CD3+ lymphocytes (ATT). (E) Fasting insulin and (F) glucose tolerance tests (N = 7 per group). (G–H) BM chimeras generated with equal numbers of FACS purified LSK cells from ND or 16-week HFD donor animals. (G) Flow analysis of blood monocytes 4 weeks after BMT. (H) Colony forming unit assays from LSK donor chimeras 16 weeks after BMT (N = 6 plates per group). When two groups are analyzed Student's t-test was used. When more then one group is present ANOVA was done first followed by Students t-test comparing groups with ND control. *p < 0.05.
To confirm that the effects were due to differences at the level of HSCs, another BMT experiment was performed using equal numbers (4000) of FACS sorted donor LSK cells from ND and HFD mice. 4 weeks after BMT, animals reconstituted with HFD LSK cells had more monocytes and more Ly6chi monocytes in circulation (Figure 4G). After HFD feeding, CFU assays from BM cells demonstrated a significant increase in CFU-G/M/GM in HFD chimeras compared to ND chimeras (Figure 4G).
3.5. BM from obese mice has the sustained potential to generate inflammatory macrophages
To perform the most stringent test for obesity-induced alterations in LT-HSC function, a serial BMT experiment was performed starting with HFD and ND BM donor cells (Figure 5A). After the first transplant, recipient mice were maintained on a ND for 16 weeks prior to a second round of BMT using these mice as donors. After second transplantation, mice were fed either ND or HFD for 16 weeks. HFD chimeras had excess weight gain compared to ND fed controls. No differences in body weight or adipose tissue weight were seen based on donor origin (Figure 5B and Supplementary Figure 3A). After the second transplant, lean mice did not show any significant differences in the quantity of HSCs, myeloid progenitors, or ATMs based on the original donor source (Data not shown). Compared to mice derived from ND BM (N ⇒⇒ H), obese mice that originally received HFD BM (H ⇒⇒ H) had similar numbers of LT-HSCs, but had more BM Lin− and LSK cells as well as an increase in Pre-GM and MPP myeloid progenitors (Figure 5C). H ⇒⇒ H mice demonstrated an increase in CD11c+ BM cells as well as total ATMs, and CD11c+ ATMs in visceral adipose tissue (Figure 5D). Consistent with this, immunofluorescence imaging of the adipose tissue demonstrated in increase in the number of crown-like structures (CLS) that correlate with inflammatory ATM accumulation (Figure 5E). T-cells (CD3+ total and CD4 and CD8 positive sub-sets) were not different in the spleen and adipose tissue amongst all groups.
Figure 5.
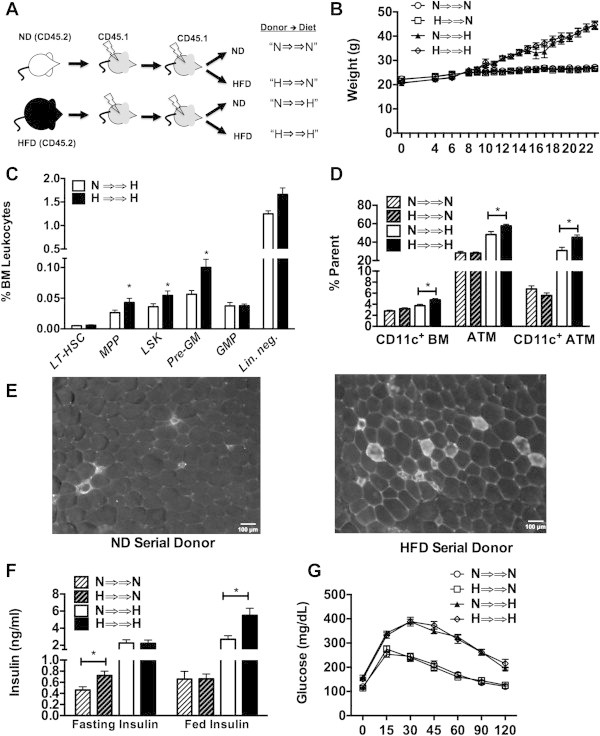
BM from HFD mice has the sustained potential to generate inflammatory macrophages after serial transplantation. (A) Experimental design of serial BMT experiments. Groups designated by initial donor source (N vs H) followed by diet challenge after the 2nd BMT. (B) Body weight of mice after the 2nd BMT. HFD initiated 6 weeks after BM transfer. (C) Quantitation of BM progenitors after the 2nd transplant in mice fed a HFD. No differences noted in mice fed ND. (D) Quantitation of CD11c+ BM cells, total CD64+ ATMs and CD11c+ ATMs. (E) Immunofluorescence of epididymal fat pads stained for CD11c highlighting crown-like structures. Representative images shown from similar results from 4 mice per group. (F) Fasting insulin and (G) glucose tolerance testing in ND and HFD donor groups after 2nd BMT. N = 8 in ND groups, N = 10 in HFD groups.
Glucose tolerance testing did not demonstrate any significant differences in fasting glucose or glucose tolerance after serial BMT by donor (Figure 5G). As anticipated, obese mice did have higher glucose levels compared to lean mice. Lean mice derived from HFD BM (H ⇒⇒ N) had higher fasting insulin levels (Figure 5F). Obese mice derived from HFD donors (H ⇒⇒ H) demonstrated elevated fed insulin levels compared to those derived from a ND donor. Gene expression analysis showed that inflammatory gene expression did not differ based on donor source, however adiponectin expression was lower in H ⇒⇒ H mice compared to N ⇒⇒ H (Supplementary Figure 3B). This data show that sustained changes in LT-HSCs induced by HFD can potentiate myeloid output, the generation of CD11c+ ATMs, and influence adipokine signaling.
3.6. The cell autonomous effect of obesity on HSC generation of adipose tissue macrophage production is dependent on MyD88
Since TLR/MyD88 signals have been implicated in HSC activation in response to microbial infection, we examined the contribution of these pathways to HFD induced myeloid cell production in a long-term competitive reconstitution model. Donor BM from Myd88−/− (CD45.2) and WT (CD45.1) mice were mixed in a 1:1 ratio prior to injection into irradiated WT recipients. Chimeras were fed a HFD for 16 weeks prior to analysis of the ratio of Myd88−/− (CD45.2) to WT (CD45.1) cells. BM was stained and progenitors were analyzed by gating lineage negative cells for LSK, GMP, and HSC populations as shown in Figure 6A. Myd88−/− and WT donors contributed similarly to LT-HSCs suggesting that Myd88 is not required for the reconstitution or maintenance of LT-HSCs. However, compared to WT cells, fewer Myd88−/− cells contributed to either Lin− progenitors or GMPs (CD45.2/CD45.1 ratio <1) consistent with impairment in myelopoiesis in cells lacking Myd88 (Figure 6B). The preferential contribution of WT donors relative to Myd88−/− donors (CD45.2/CD45.1 ratio <1) was observed in blood monocytes and total ATMs from visceral adipose tissue. Stratification of ATMs based on CD11c expression demonstrated the preferential accumulation of WT CD11c+ ATMs over Myd88−/− CD11c+ ATMs, without a significant difference in the donor contributions to CD11c− resident ATMs. These results suggest that MyD88 regulates the generation activated CD11c+ ATMs with obesogenic stimuli at the level of myeloid progenitor production.
Figure 6.
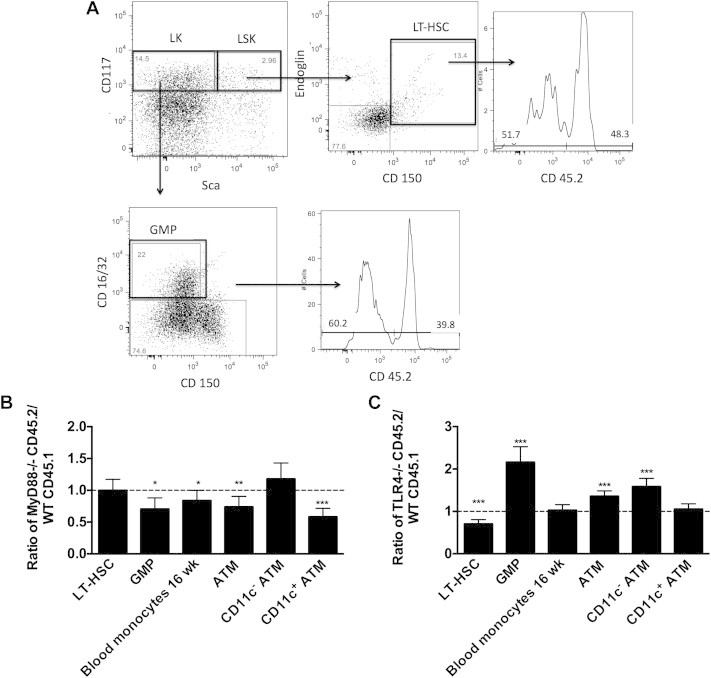
Generation of myeloid progenitors and adipose tissue macrophages is dependent on MyD88. (A) A competitive BMT was performed with MyD88−/− (CD45.2) and WT (CD45.1) marrow in a 1:1 ratio into CD45 1.2 heterozygous animals. After 16 weeks of HFD the ratio of donor contribution to HSC, GMP, monocytes, and ATMs was determined by flow cytometry (N = 8). Data expressed as a ratio of CD45.2 to CD45.1 (CD45.2 negative staining) cells in each pool. (B) A competitive BMT was performed with TLR4−/− (CD45.2) and WT (CD45.1) marrow in a 1:1 ratio into CD45 1.2 heterozygous animals. After 16 weeks of HFD the ratio of donor contribution to HSC, GMP, monocytes, and ATMs was determined (N = 7). *p < 0.05, **p < 0.01, ***p < 0.005, ****p < 0.001.
To examine if TLR4 contributes to the same process, a similar long-term reconstitution model was performed with chimeras generated from donor BM from an equal ratio of Tlr4−/− (CD45.2) and WT (CD45.1) BM fed a HFD for 16 weeks (Figure 6C). In contrast to Myd88−/− chimeras, there was a decrease in Tlr4−/− LT-HSCs relative to WT demonstrating that Tlr4−/− HSCs have a competitive disadvantage in reconstitution compared to WT cells. Tlr4−/− derived cells contributed more to GMPs suggesting that TLR4 may inhibit the generation of myeloid precursors in the BM after long-term HFD. These BM differences did not persist in blood monocytes. Tlr4−/− derived cells preferentially contributed to CD11c− ATMs and equally to CD11c+ ATMs. Overall, our results suggest the MyD88 is required for maximal myeloid production in the setting of HFD and while TLR4 is required for LT-HSC expansion it is not required for the increased myeloid cell production.
4. Discussion
An increase in peripheral leukocytes of the myeloid lineage (monocytes and neutrophils) is a common feature of obesity in children [44] and adults [25]. More importantly, leukocytosis is a biomarker for risk of obesity-associated diseases such as diabetes and atherosclerosis [45,46]. The underlying mechanisms by which obesity triggers peripheral leukocytosis has remained unclear. This study demonstrates that high fat diet induced obesity leads to alterations in the BM pool of HSCs that contributes to 1) quantitative expansion of the HSC pool in the BM, 2) increased production of myeloid precursors from HSCs, and 3) qualitative changes at the level of BM progenitors that potentiate the generation of pro-inflammatory macrophages. The quantitative expansion of HSCs appears to be reversible with removal of HFD exposure. However, the increased capacity for obese HSCs to generate activated myeloid cells is sustained and amplified by HFD in mouse BMT models. MyD88 in HSCs contributes to myelopoiesis with HFD that ultimately impairs the generation of CD11c+ ATMs.
Our results support the growing evidence that HSCs are not passive bystanders in inflammatory responses and can alter their output in response to a range of inflammatory and nutritional stimuli [28,47]. DIO has been shown to increase hematopoiesis and lymphopoiesis in mice but progenitors were not examined in this study [34]. Hyperglycemia itself has been also shown to induce myelopoiesis in the setting of diabetes [33]. HSCs from diabetic db/db mice demonstrate markers of inflammatory activation and upregulation of adhesion molecules suggesting that leptin signaling may play a role in HSC regulation [48,49]. Cholesterol metabolism is also critical to the proper maintenance of HSC proliferation and production of myeloid cells from committed progenitors [50]. The atherosclerosis-prone phenotype of Apoe deficient mice is directly linked to defective cholesterol efflux in HSCs that amplifies myeloid cell production and activation and promotes atherosclerosis. Recent studies have found a suppression of B cell lymphopoiesis after HFD, which is consistent with our findings of myeloid activation which could lead to such lymphoid differentiation [51]. Our findings that MyD88 is critical for ATM accumulation and development is consistent with the recent findings that MyD88 in mature macrophages and endothelial cells is important for obesity-induced inflammation [52]. Our work emphasizes the role of MyD88 activity in myelopoiesis in obesity [37].
Given recent studies showing the contribution of committed myeloid progenitors in the spleen to the production of Ly6chi monocytes in atherogenesis [26,53] we investigated this and found that with high fat diet induced there was no significant quantitative induction of splenic progenitors. A consistent finding in several of our BM chimera experiments is an increased generation of CD11c+ ATMs generated from HSCs from obese mouse donors. This matches our in vitro observations of a potentiation of inflammatory capacity of BM derived macrophages from obese mice. This may also relate to alterations in ATM proliferation and differentiation into CD11c+ ATMs [54,55]. However, the weight of evidence still supports an important role of monocyte trafficking to adipose tissue as the mechanism of obesity-induced CD11c+ ATM accumulation [19,20].
Overall, our serial BM transplant studies support the concept that obesity can durably reprogram the output of BM progenitors and that this is taking place at the level of long term repopulating (LT) HSCs. We hypothesize that obesity-induced epigenetic changes may play a role in generating this phenotype as this has been shown to influence macrophage activation states after chronic and acute inflammatory stimuli [56,57]. The preferential accumulation of CD11c+ ATMs and crown-like structures was not associated with any significant derangements in glucose metabolism in lean or obese conditions in the serial transplant. This may be due to physiologic changes related to the conditioning irradiation known to influence weight gain after BMT. It may also relate to compensatory protective changes in other adipose tissue leukocyte populations such as regulator T cells that we have found to be radio-resistant to standard conditioning regimens.
Our results have implication for interpretation of BM chimeras in the study of obesity-induced inflammation. Most of these have focused primarily on mature macrophage responses and have not taken into account the important role innate immune signals such as TLRs and NLRs play in HSC function and myeloid progenitor from the BM pool. Our studies suggest that MyD88 in HSCs controls the generation of myeloid progenitors in the setting of HFD while TLR4 itself is not required for this process. The competitive advantage WT cells have over MyD88ko cells extends outside of the BM compartment and extends toward the generation of CD11c+ ATMs.
This study suggests that obesity may have life-long effects on inflammatory responses by altering HSC function. This view is supported by epidemiologic data linking rapid early growth to an increase in leukocyte counts that tracks throughout childhood and into adulthood [58]. It is also consistent with the importance of the duration of obesity on diabetes risk and the observation that adults who were obese as children retain an increased risk of insulin resistance [59,60]. Our observations may explain the data that adipose tissue inflammation and fibrosis are not resolved even after returning to normal weight after weight loss [61,62]. This has implications not only towards effects of childhood obesity, but also toward the impact of obesity on other obesity-associated diseases with an inflammatory component that includes cancer, kidney disease, and liver disease [63–65].
5. Conclusions
Our studies demonstrate that obesity-induces changes at the level of HSCs and early BM myeloid progenitors that expand myeloid cell production and potentiate the production of pro-inflammatory macrophages. MyD88 dependent generation of myeloid precursors contributes to the generation of CD11c+ adipose tissue macrophages.
Acknowledgments
Support for this work was provided by grants from the National Institutes of Health, United States (HD028820 (K.S.), DK090262 and DK092873 (C.L.)), the American Diabetes Association (7-12-CD-08) (C.L.), National Institutes of Health, United States Training Grant (T32 AI007413 (B.Z.)) and a Janette Ferrantino Investigator Award from the Department of Pediatrics (K.S.). This work utilized Core Services from the Michigan Nutrition and Obesity Research Center supported by grant DK089503 of National Institutes of Health, United States to the University of Michigan. This work utilized the Microscopy Core of the Michigan Diabetes Research Center funded by National Institutes of Health, United States 2P30-DK20572 from the National Institute of Diabetes & Digestive & Kidney Diseases.
Conflict of interest
The authors have no conflicts of interest.
Appendix A. Supplementary data
The following are the supplementary data related to this article:
Supplementary Figure 1.
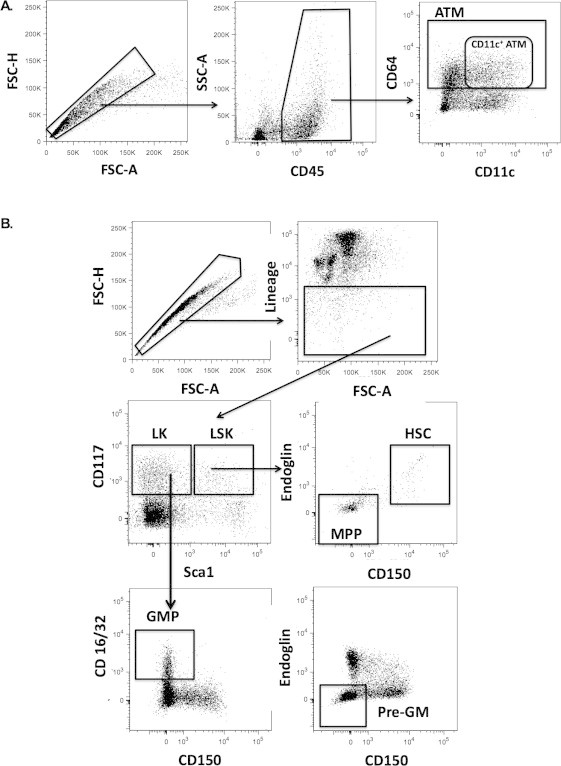
(A) Gaiting strategy for ATMs from singlets to CD45+ to CD64+ total ATMs, CD64+CD11c+ ATMs (B) Gating strategy for HSCs using singlets, lineage negative cells and then LK and LSK populations for sub-gating of GMPs, Pre-GMs, MPP, and LT-HSC cells.
Supplementary Figure 2.
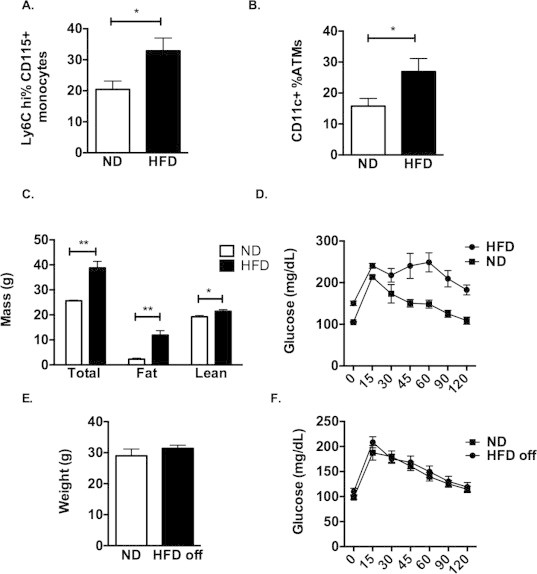
Characteristics of ND and HFD fed mice and weight loss model (A) C57Bl/6J mice fed ND or HFD for 16 weeks. Flow quantitation of Ly6chi circulating monocytes expressed as a percentage of total CD115+ monocytes. (B) Quantitation of CD11c+ ATMs from epididymal adipose tissue expressed as a percent of total ATMs (n = 8 per group). (C) Body composition analysis on a representative group of 4 animals each diet. (D) Glucose tolerance testing demonstrating glucose intolerance in HFD fed mice. (E) Mice were fed a HFD for 12 weeks and then switched to a ND for 8 weeks (HFD off). (E) Body weight and (F) glucose tolerance is shown relative to age matched ND fed controls. (n = 8 ND and 12 HFD off). Two-sided Student's t-test with *p < 0.05.
Supplementary Figure 3.
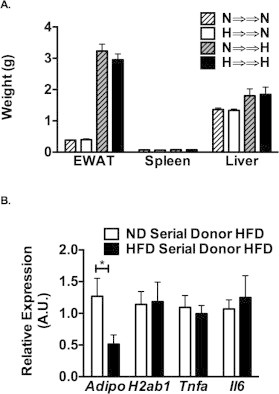
Tissue weight and RT-PCR analysis of serial BMT mice. (A) Tissue weights of mice undergoing serial BMT assessed after the 2nd transplant. (B) Gene expression from epididymal fat pads from HFD fed mice after the 2nd BMT.
References
- 1.Flegal K.M., Carroll M.D., Ogden C.L., Curtin L.R. Prevalence and trends in obesity among US adults, 1999-2008. JAMA. 2010;303:235–241. doi: 10.1001/jama.2009.2014. [DOI] [PubMed] [Google Scholar]
- 2.Berg A.H., Scherer P.E. Adipose tissue, inflammation, and cardiovascular disease. Circulation Research. 2005;96:939–949. doi: 10.1161/01.RES.0000163635.62927.34. [DOI] [PubMed] [Google Scholar]
- 3.Hotamisligil G.S., Erbay E. Nutrient sensing and inflammation in metabolic diseases. Nature Reviews: Immunology. 2008;8:923–934. doi: 10.1038/nri2449. [DOI] [PMC free article] [PubMed] [Google Scholar]
- 4.Xu H., Barnes G.T., Yang Q., Tan G., Yang D., Chou C.J. Chronic inflammation in fat plays a crucial role in the development of obesity-related insulin resistance. Journal of Clinical Investigation. 2003;112:1821–1830. doi: 10.1172/JCI19451. [DOI] [PMC free article] [PubMed] [Google Scholar]
- 5.Phillips C.M., Perry I.J. Does inflammation determine metabolic health status in obese and nonobese adults? Journal of Clinical Endocrinology and Metabolism. 2013;98:E1610–E1619. doi: 10.1210/jc.2013-2038. [DOI] [PubMed] [Google Scholar]
- 6.Poirier P., Giles T.D., Bray G.A., Hong Y., Stern J.S., Pi-Sunyer F.X. Obesity and cardiovascular disease: pathophysiology, evaluation, and effect of weight loss: an update of the 1997 American Heart Association Scientific Statement on Obesity and Heart Disease from the Obesity Committee of the Council on Nutrition, Physical Activity, and Metabolism. Circulation. 2006;113:898–918. doi: 10.1161/CIRCULATIONAHA.106.171016. [DOI] [PubMed] [Google Scholar]
- 7.Visser M., Bouter L.M., McQuillan G.M., Wener M.H., Harris T.B. Elevated C-reactive protein levels in overweight and obese adults. JAMA. 1999;282:2131–2135. doi: 10.1001/jama.282.22.2131. [DOI] [PubMed] [Google Scholar]
- 8.Lumeng C.N., Bodzin J.L., Saltiel A.R. Obesity induces a phenotypic switch in adipose tissue macrophage polarization. Journal of Clinical Investigation. 2007;117:175–184. doi: 10.1172/JCI29881. [DOI] [PMC free article] [PubMed] [Google Scholar]
- 9.Lumeng C.N., DelProposto J.B., Westcott D.J., Saltiel A.R. Phenotypic switching of adipose tissue macrophages with obesity is generated by spatiotemporal differences in macrophage subtypes. Diabetes. 2008;57:3239–3246. doi: 10.2337/db08-0872. [DOI] [PMC free article] [PubMed] [Google Scholar]
- 10.Lumeng C.N., Deyoung S.M., Saltiel A.R. Macrophages block insulin action in adipocytes by altering expression of signaling and glucose transport proteins. American Journal of Physiology: Endocrinology and Metabolism. 2007;292:E166–E174. doi: 10.1152/ajpendo.00284.2006. [DOI] [PMC free article] [PubMed] [Google Scholar]
- 11.Aron-Wisnewsky J., Tordjman J., Poitou C., Darakhshan F., Hugol D., Basdevant A. Human adipose tissue macrophages: m1 and m2 cell surface markers in subcutaneous and omental depots and after weight loss. Journal of Clinical Endocrinology and Metabolism. 2009;94:4619–4623. doi: 10.1210/jc.2009-0925. [DOI] [PubMed] [Google Scholar]
- 12.Stefanovic-Racic M., Yang X., Turner M.S., Mantell B.S., Stolz D.B., Sumpter T.L. Dendritic cells promote macrophage infiltration and comprise a substantial proportion of obesity-associated increases in CD11c+ cells in adipose tissue and liver. Diabetes. 2012;61:2330–2339. doi: 10.2337/db11-1523. [DOI] [PMC free article] [PubMed] [Google Scholar]
- 13.Nicol L.E., Grant W.R., Comstock S.M., Nguyen M.L., Smith M.S., Grove K.L. Pancreatic inflammation and increased islet macrophages in insulin-resistant juvenile primates. Journal of Endocrinology. 2013;217:207–213. doi: 10.1530/JOE-12-0424. [DOI] [PMC free article] [PubMed] [Google Scholar]
- 14.Guyenet S.J., Nguyen H.T., Hwang B.H., Schwartz M.W., Baskin D.G., Thaler J.P. High-fat diet feeding causes rapid, non-apoptotic cleavage of caspase-3 in astrocytes. Brain Research. 2013;1512:97–105. doi: 10.1016/j.brainres.2013.03.033. [DOI] [PMC free article] [PubMed] [Google Scholar]
- 15.Johnson A.R., Milner J.J., Makowski L. The inflammation highway: metabolism accelerates inflammatory traffic in obesity. Immunological Reviews. 2012;249:218–238. doi: 10.1111/j.1600-065X.2012.01151.x. [DOI] [PMC free article] [PubMed] [Google Scholar]
- 16.Goldfine A.B., Silver R., Aldhahi W., Cai D., Tatro E., Lee J. Use of salsalate to target inflammation in the treatment of insulin resistance and type 2 diabetes. Clinical and Translational Science. 2008;1:36–43. doi: 10.1111/j.1752-8062.2008.00026.x. [DOI] [PMC free article] [PubMed] [Google Scholar]
- 17.Kanda H., Tateya S., Tamori Y., Kotani K., Hiasa K., Kitazawa R. MCP-1 contributes to macrophage infiltration into adipose tissue, insulin resistance, and hepatic steatosis in obesity. Journal of Clinical Investigation. 2006;116:1494–1505. doi: 10.1172/JCI26498. [DOI] [PMC free article] [PubMed] [Google Scholar]
- 18.Patsouris D., Li P.P., Thapar D., Chapman J., Olefsky J.M., Neels J.G. Ablation of CD11c-positive cells normalizes insulin sensitivity in obese insulin resistant animals. Cell Metabolism. 2008;8:301–309. doi: 10.1016/j.cmet.2008.08.015. [DOI] [PMC free article] [PubMed] [Google Scholar]
- 19.Weisberg S.P., Hunter D., Huber R., Lemieux J., Slaymaker S., Vaddi K. CCR2 modulates inflammatory and metabolic effects of high-fat feeding. Journal of Clinical Investigation. 2006;116:115–124. doi: 10.1172/JCI24335. [DOI] [PMC free article] [PubMed] [Google Scholar]
- 20.Westcott D.J., Delproposto J.B., Geletka L.M., Wang T., Singer K., Saltiel A.R. MGL1 promotes adipose tissue inflammation and insulin resistance by regulating 7/4hi monocytes in obesity. Journal of Experimental Medicine. 2009;206:3143–3156. doi: 10.1084/jem.20091333. [DOI] [PMC free article] [PubMed] [Google Scholar]
- 21.Tsou C.L., Peters W., Si Y., Slaymaker S., Aslanian A.M., Weisberg S.P. Critical roles for CCR2 and MCP-3 in monocyte mobilization from bone marrow and recruitment to inflammatory sites. Journal of Clinical Investigation. 2007;117:902–909. doi: 10.1172/JCI29919. [DOI] [PMC free article] [PubMed] [Google Scholar]
- 22.Eguchi K., Manabe I., Oishi-Tanaka Y., Ohsugi M., Kono N., Ogata F. Saturated fatty acid and TLR signaling link beta cell dysfunction and islet inflammation. Cell Metabolism. 2012;15:518–533. doi: 10.1016/j.cmet.2012.01.023. [DOI] [PubMed] [Google Scholar]
- 23.Nishimura S., Manabe I., Nagasaki M., Seo K., Yamashita H., Hosoya Y. In vivo imaging in mice reveals local cell dynamics and inflammation in obese adipose tissue. Journal of Clinical Investigation. 2008;118:710–721. doi: 10.1172/JCI33328. [DOI] [PMC free article] [PubMed] [Google Scholar]
- 24.Herishanu Y., Rogowski O., Polliack A., Marilus R. Leukocytosis in obese individuals: possible link in patients with unexplained persistent neutrophilia. European Journal of Haematology. 2006;76:516–520. doi: 10.1111/j.1600-0609.2006.00658.x. [DOI] [PubMed] [Google Scholar]
- 25.Poitou C., Dalmas E., Renovato M., Benhamo V., Hajduch F., Abdennour M. CD14dimCD16+ and CD14+CD16+ monocytes in obesity and during weight loss: relationships with fat mass and subclinical atherosclerosis. Arteriosclerosis, Thrombosis, and Vascular Biology. 2011;31:2322–2330. doi: 10.1161/ATVBAHA.111.230979. [DOI] [PubMed] [Google Scholar]
- 26.Robbins C.S., Chudnovskiy A., Rauch P.J., Figueiredo J.L., Iwamoto Y., Gorbatov R. Extramedullary hematopoiesis generates Ly-6Chigh monocytes that infiltrate atherosclerotic lesions. Circulation. 2012;125:364–374. doi: 10.1161/CIRCULATIONAHA.111.061986. [DOI] [PMC free article] [PubMed] [Google Scholar]
- 27.Granick J.L., Simon S.I., Borjesson D.L. Hematopoietic stem and progenitor cells as effectors in innate immunity. Bone Marrow Research. 2012;2012:165107. doi: 10.1155/2012/165107. [DOI] [PMC free article] [PubMed] [Google Scholar]
- 28.King K.Y., Goodell M.A. Inflammatory modulation of HSCs: viewing the HSC as a foundation for the immune response. Nature Reviews: Immunology. 2011;11:685–692. doi: 10.1038/nri3062. [DOI] [PMC free article] [PubMed] [Google Scholar]
- 29.Esplin B.L., Shimazu T., Welner R.S., Garrett K.P., Nie L., Zhang Q. Chronic exposure to a TLR ligand injures hematopoietic stem cells. The Journal of Immunology. 2011;186:5367–5375. doi: 10.4049/jimmunol.1003438. [DOI] [PMC free article] [PubMed] [Google Scholar]
- 30.Megias J., Yanez A., Moriano S., O'Connor J.E., Gozalbo D., Gil M.L. Direct Toll-like receptor-mediated stimulation of hematopoietic stem and progenitor cells occurs in vivo and promotes differentiation toward macrophages. Stem Cells. 2012;30:1486–1495. doi: 10.1002/stem.1110. [DOI] [PubMed] [Google Scholar]
- 31.Boettcher S., Ziegler P., Schmid M.A., Takizawa H., van Rooijen N., Kopf M. Cutting edge: LPS-induced emergency myelopoiesis depends on TLR4-expressing nonhematopoietic cells. The Journal of Immunology. 2012;188:5824–5828. doi: 10.4049/jimmunol.1103253. [DOI] [PubMed] [Google Scholar]
- 32.Bellows C.F., Zhang Y., Simmons P.J., Khalsa A.S., Kolonin M.G. Influence of BMI on level of circulating progenitor cells. Obesity (Silver Spring) 2011;19:1722–1726. doi: 10.1038/oby.2010.347. [DOI] [PMC free article] [PubMed] [Google Scholar]
- 33.Nagareddy P.R., Murphy A.J., Stirzaker R.A., Hu Y., Yu S., Miller R.G. Hyperglycemia promotes myelopoiesis and impairs the resolution of atherosclerosis. Cell Metabolism. 2013;17:695–708. doi: 10.1016/j.cmet.2013.04.001. [DOI] [PMC free article] [PubMed] [Google Scholar]
- 34.Trottier M.D., Naaz A., Li Y., Fraker P.J. Enhancement of hematopoiesis and lymphopoiesis in diet-induced obese mice. Proceedings of the National Academy of Sciences of the United States of America. 2012;109:7622–7629. doi: 10.1073/pnas.1205129109. [DOI] [PMC free article] [PubMed] [Google Scholar]
- 35.Nagai Y., Garrett K.P., Ohta S., Bahrun U., Kouro T., Akira S. Toll-like receptors on hematopoietic progenitor cells stimulate innate immune system replenishment. Immunity. 2006;24:801–812. doi: 10.1016/j.immuni.2006.04.008. [DOI] [PMC free article] [PubMed] [Google Scholar]
- 36.Nagareddy P.R., Kraakman M., Masters S.L., Stirzaker R.A., Gorman D.J., Grant R.W. Adipose tissue macrophages promote myelopoiesis and monocytosis in obesity. Cell Metabolism. 2014;19:821–835. doi: 10.1016/j.cmet.2014.03.029. [DOI] [PMC free article] [PubMed] [Google Scholar]
- 37.Fiedler K., Kokai E., Bresch S., Brunner C. MyD88 is involved in myeloid as well as lymphoid hematopoiesis independent of the presence of a pathogen. American Journal of Blood Research. 2013;3:124–140. [PMC free article] [PubMed] [Google Scholar]
- 38.Singer K., Morris D.L., Oatmen K.E., Wang T., Delproposto J., Mergian T. Neuropeptide Y is produced by adipose tissue macrophages and regulates obesity-induced inflammation. PLoS One. 2013;8:e57929. doi: 10.1371/journal.pone.0057929. [DOI] [PMC free article] [PubMed] [Google Scholar]
- 39.Lumeng C.N., Deyoung S.M., Bodzin J.L., Saltiel A.R. Increased inflammatory properties of adipose tissue macrophages recruited during diet-induced obesity. Diabetes. 2007;56:16–23. doi: 10.2337/db06-1076. [DOI] [PubMed] [Google Scholar]
- 40.Morris D.L., Oatmen K.E., Wang T., DelProposto J.L., Lumeng C.N. CX3CR1 deficiency does not influence trafficking of adipose tissue macrophages in mice with diet-induced obesity. Obesity (Silver Spring) 2012;20:1189–1199. doi: 10.1038/oby.2012.7. [DOI] [PMC free article] [PubMed] [Google Scholar]
- 41.Pronk C.J., Rossi D.J., Mansson R., Attema J.L., Norddahl G.L., Chan C.K. Elucidation of the phenotypic, functional, and molecular topography of a myeloerythroid progenitor cell hierarchy. Cell Stem Cell. 2007;1:428–442. doi: 10.1016/j.stem.2007.07.005. [DOI] [PubMed] [Google Scholar]
- 42.Erickson J.C., Clegg K.E., Palmiter R.D. Sensitivity to leptin and susceptibility to seizures of mice lacking neuropeptide Y. Nature. 1996;381:415–421. doi: 10.1038/381415a0. [DOI] [PubMed] [Google Scholar]
- 43.Nguyen M.T., Favelyukis S., Nguyen A.K., Reichart D., Scott P.A., Jenn A. A subpopulation of macrophages infiltrates hypertrophic adipose tissue and is activated by free fatty acids via Toll-like receptors 2 and 4 and JNK-dependent pathways. Journal of Biological Chemistry. 2007;282:35279–35292. doi: 10.1074/jbc.M706762200. [DOI] [PubMed] [Google Scholar]
- 44.Skinner A.C., Steiner M.J., Henderson F.W., Perrin E.M. Multiple markers of inflammation and weight status: cross-sectional analyses throughout childhood. Pediatrics. 2010;125:e801–809. doi: 10.1542/peds.2009-2182. [DOI] [PMC free article] [PubMed] [Google Scholar]
- 45.Yarnell J.W., Patterson C.C., Sweetnam P.M., Lowe G.D. Haemostatic/inflammatory markers predict 10-year risk of IHD at least as well as lipids: the Caerphilly collaborative studies. European Heart Journal. 2004;25:1049–1056. doi: 10.1016/j.ehj.2004.04.011. [DOI] [PubMed] [Google Scholar]
- 46.Cannon C.P., McCabe C.H., Wilcox R.G., Bentley J.H., Braunwald E. Association of white blood cell count with increased mortality in acute myocardial infarction and unstable angina pectoris. OPUS-TIMI 16 Investigators. American Journal of Cardiology. 2001;87 doi: 10.1016/s0002-9149(00)01444-2. 636–639, A610. [DOI] [PubMed] [Google Scholar]
- 47.Baldridge M.T., King K.Y., Boles N.C., Weksberg D.C., Goodell M.A. Quiescent haematopoietic stem cells are activated by IFN-gamma in response to chronic infection. Nature. 2010;465:793–797. doi: 10.1038/nature09135. [DOI] [PMC free article] [PubMed] [Google Scholar]
- 48.Li T.S., Ikeda S., Kubo M., Ohshima M., Kurazumi H., Takemoto Y. Diabetic impairment of C-kit bone marrow stem cells involves the disorders of inflammatory factors, cell adhesion and extracellular matrix molecules. PLoS One. 2011;6:e25543. doi: 10.1371/journal.pone.0025543. [DOI] [PMC free article] [PubMed] [Google Scholar]
- 49.Claycombe K., King L.E., Fraker P.J. A role for leptin in sustaining lymphopoiesis and myelopoiesis. Proceedings of the National Academy of Sciences of the United States of America. 2008;105:2017–2021. doi: 10.1073/pnas.0712053105. [DOI] [PMC free article] [PubMed] [Google Scholar]
- 50.Murphy A.J., Akhtari M., Tolani S., Pagler T., Bijl N., Kuo C.L. ApoE regulates hematopoietic stem cell proliferation, monocytosis, and monocyte accumulation in atherosclerotic lesions in mice. Journal of Clinical Investigation. 2011;121:4138–4149. doi: 10.1172/JCI57559. [DOI] [PMC free article] [PubMed] [Google Scholar]
- 51.Adler B.J., Green D.E., Pagnotti G.M., Chan M.E., Rubin C.T. High fat diet rapidly suppresses B lymphopoiesis by disrupting the supportive capacity of the bone marrow niche. PLoS One. 2014;9:e90639. doi: 10.1371/journal.pone.0090639. [DOI] [PMC free article] [PubMed] [Google Scholar]
- 52.Yu M., Zhou H., Zhao J., Xiao N., Roychowdhury S., Schmitt D. MyD88-dependent interplay between myeloid and endothelial cells in the initiation and progression of obesity-associated inflammatory diseases. The Journal of Experimental Medicine. 2014;211:887–907. doi: 10.1084/jem.20131314. [DOI] [PMC free article] [PubMed] [Google Scholar]
- 53.Swirski F.K. The spatial and developmental relationships in the macrophage family. Arteriosclerosis, Thrombosis, and Vascular Biology. 2011;31:1517–1522. doi: 10.1161/ATVBAHA.110.221150. [DOI] [PMC free article] [PubMed] [Google Scholar]
- 54.Amano S.U., Cohen J.L., Vangala P., Tencerova M., Nicoloro S.M., Yawe J.C. Local proliferation of macrophages contributes to obesity-associated adipose tissue inflammation. Cell Metabolism. 2014;19:162–171. doi: 10.1016/j.cmet.2013.11.017. [DOI] [PMC free article] [PubMed] [Google Scholar]
- 55.Haase J., Weyer U., Immig K., Kloting N., Bluher M., Eilers J. Local proliferation of macrophages in adipose tissue during obesity-induced inflammation. Diabetologia. 2014;57:562–571. doi: 10.1007/s00125-013-3139-y. [DOI] [PubMed] [Google Scholar]
- 56.Carson W.F., Cavassani K.A., Dou Y., Kunkel S.L. Epigenetic regulation of immune cell functions during post-septic immunosuppression. Epigenetics. 2011;6:273–283. doi: 10.4161/epi.6.3.14017. [DOI] [PMC free article] [PubMed] [Google Scholar]
- 57.Ishii M., Wen H., Corsa C.A.S., Liu T., Coelho A.L., Allen R.M. Epigenetic regulation of the alternatively activated macrophage phenotype. Blood. 2009;114:3244–3254. doi: 10.1182/blood-2009-04-217620. [DOI] [PMC free article] [PubMed] [Google Scholar]
- 58.Chen W., Srinivasan S.R., Berenson G.S. Influence of birth weight on white blood cell count in biracial (black-white) children, adolescents, and young adults: the Bogalusa Heart Study. American Journal of Epidemiology. 2009;169:214–218. doi: 10.1093/aje/kwn341. [DOI] [PMC free article] [PubMed] [Google Scholar]
- 59.Lee J.M., Gebremariam A., Vijan S., Gurney J.G. Excess body mass index-years, a measure of degree and duration of excess weight, and risk for incident diabetes. Archives of Pediatrics and Adolescent Medicine. 2012;166:42–48. doi: 10.1001/archpedi.166.1.42. [DOI] [PMC free article] [PubMed] [Google Scholar]
- 60.Power C., Thomas C. Changes in BMI, duration of overweight and obesity, and glucose metabolism: 45 years of follow-up of a birth cohort. Diabetes Care. 2011;34:1986–1991. doi: 10.2337/dc10-1482. [DOI] [PMC free article] [PubMed] [Google Scholar]
- 61.Cancello R., Zulian A., Gentilini D., Mencarelli M., Della Barba A., Maffei M. Permanence of molecular features of obesity in subcutaneous adipose tissue of ex-obese subjects. International Journal of Obesity (2005) 2013;37:867–873. doi: 10.1038/ijo.2013.7. [DOI] [PubMed] [Google Scholar]
- 62.Divoux A., Tordjman J., Lacasa D., Veyrie N., Hugol D., Aissat A. Fibrosis in human adipose tissue: composition, distribution, and link with lipid metabolism and fat mass loss. Diabetes. 2010;59:2817–2825. doi: 10.2337/db10-0585. [DOI] [PMC free article] [PubMed] [Google Scholar]
- 63.Calle E.E., Kaaks R. Overweight, obesity and cancer: epidemiological evidence and proposed mechanisms. Nature Reviews: Cancer. 2004;4:579–591. doi: 10.1038/nrc1408. [DOI] [PubMed] [Google Scholar]
- 64.Stanley A.H., Demissie K., Rhoads G.G. Asthma development with obesity exposure: observations from the cohort of the National Health and Nutrition Evaluation Survey Epidemiologic Follow-up Study (NHEFS) Journal of Asthma. 2005;42:97–99. doi: 10.1081/jas-51338. [DOI] [PubMed] [Google Scholar]
- 65.Vachharajani V., Vital S. Obesity and sepsis. Journal of Intensive Care Medicine. 2006;21:287–295. doi: 10.1177/0885066606290670. [DOI] [PubMed] [Google Scholar]
Associated Data
This section collects any data citations, data availability statements, or supplementary materials included in this article.