

SUMMARY
In this issue of Molecular Cell, Kubota et al show how different temporal patterns of insulin are decoded by the AKT signaling network, providing both new mechanistic insights and physiological relevance.
Cells can be remarkably frugal. They often use the same molecule for different purposes. This can be accomplished, for example, through covalent modifications or cofactors that change the function of a protein. Cells can also change the specificity of a signaling molecule by varying its dynamical behavior. Examples of this phenomenon have emerged from diverse signaling pathways (Batchelor et al., 2011; Boulware and Marchant, 2008; Brabant et al., 1992; Santos et al., 2007), but the question of how different dynamical patterns are interpreted by cells remains unclear. On p. XXXX of this issue, Kubota et al tackle this question by investigating the mechanisms that decode different temporal patterns of insulin signaling (Kubota et al., 2012). Using an elegant combination of experiments and computational modeling, they show how specific temporal features of the insulin signal are selectively decoded by the kinetics and connectivity of the downstream processing network.
Insulin is a hormone that is critically important for carbohydrate and fat metabolism. It is released by the pancreas in three distinct dynamical patterns (Polonsky et al., 1988) (Figure 1): a sustained elevation in response to meals (additional secretion); a persistently low level in response to fasting (basal secretion); and 10-15 minute oscillations (pulses), a pattern that appears to be optimal for efficient glucose uptake (Bratusch-Marrain et al., 1986). The observation of distinct dynamical patterns of insulin signaling suggests that each pattern may have a specific physiological role. How do cells decode these patterns? What roles might they play in metabolism?
Figure 1. Interpreting mixed insulin signals.
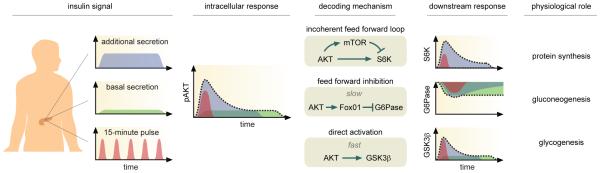
Three patterns of insulin dynamics have been observed in vivo: additional secretion in response to meals; basal secretion during low glucose uptake; and 10-15 minute pulses. These dynamical responses are captured simultaneously in the temporal pattern of pAKT. According to model predictions, the intracellular activity of pAKT is decoded by the kinetics and connectivity of the downstream signaling network. An incoherent feed forward loop structure triggers rapid activation followed by delayed inhibition of S6K. This architecture allows S6K to sense changes in pAKT and ensures that S6K returns to the same level. G6Pase is activated through an inhibitory feed forward structure with slow kinetics but high sensitivity to pAKT. These properties allow G6Pase to filter out transient fluctuations in the input signal. GSK3β, which is controlled by direct activation, reproduces all dynamical features of AKT. For downstream responses, dotted lines represent the combined dynamical behavior in response to multiple insulin signals layered onto pAKT simultaneously; shaded trajectories represent the different components resulting from the distinct patterns of insulin dynamics.
To address these questions, Kubota and colleagues first determined how different dynamical patterns of insulin are presented to cells. They found that all patterns were captured by the temporal pattern of phosphorylated AKT (pAKT), which serves as an intracellular readout for extracellular insulin signals (Figure 1). They termed this process “encoding“. Next, they hypothesized that specific downstream molecules in the AKT network could detect distinct dynamic features of pAKT, effectively “decoding“ the layered signal into individual parts. Specifically, they measured the temporal profiles of pAKT and three of its downstream effectors: ribosomal protein S6 kinase (S6K), glucose-6-phosphatase (G6Pase), and glycogen synthase kinase-3β (GSK3β). As will be seen, these enzymes can detect subtle and specific differences in pAKT dynamics.
To determine which downstream components detect transient pAKT dynamics, they performed a series of “step up“ stimulations in which the starting and ending amounts of insulin are the same—the only difference is how quickly the concentration is ramped up. Interestingly, one of the downstream molecules, S6K, could detect these differences quite well. In contrast, G6Pase was insensitive to the step-up rate, showing similar induction regardless of the rate of insulin increase. Next, they tested how each enzyme responds to sustained pAKT activation. They exposed cells to a burst of insulin followed by a “step down“ in which the concentration was lowered to different sustained levels. Under these conditions, G6Pase and GSK3β showed strong sensitivity to the final pAKT level. S6K, on the other hand, returned to the same starting level regardless of the final pAKT level. Through this series of time-dependent stimulations and experimental measurements, Kubota and colleagues were able to methodically unravel which temporal features of the pAKT (and thus the insulin signal) are detected by S6K, G6Pase, and GSK3β.
What properties of the downstream effectors allow them to respond to different upstream dynamics? To help explain the mechanism of decoding, the authors constructed a computational model of the AKT signaling network and fit the model to measurements obtained through step-up and step-down stimulations. Good fits between experimental measurements and simulations required fast activation kinetics for S6K and GSK3β, and slow kinetics with high pAKT sensitivity for G6Pase. Further mechanistic insight was suggested by the topology of the AKT network. In the model, S6K is activated through an incoherent feed forward loop that involves rapid activation followed by delayed inactivation through mTOR (Figure 1). This motif structure could explain why S6K levels return to the same concentration regardless of the final stimulus level, a property known as perfect adaptation (Goentoro et al., 2009; Ma et al., 2009). In contrast, GSK3β was activated directly by pAKT and G6Pase was inhibited through a single intermediate, Fox01. These enzymes could not reproduce the adaptation of S6K in response to step-up stimulation of insulin, but could readily detect sustained stimulation.
The model harmonizes well with our current understanding of insulin physiology. S6K, which is involved in protein synthesis, interpreted the transient AKT response with perfect adaptation. Thus, it is well suited to respond to the additional secretion of insulin after a meal, when blood is rich with amino acids and other nutrients. G6Pase, which is involved in gluconeogenesis, was predicted to have slow activation kinetics but high sensitivity to low insulin concentrations. As such, G6Pase may function when insulin levels are low for long periods, such as during fasting. GSK3β is involved in glycogenesis, the storage of glucose as glycogen. This enzyme responded rapidly to all insulin levels, reflecting its ability to process glucose consistently under all types of insulin signaling. Each dynamical pattern may therefore signify a unique physiological response in vivo.
Kubota and colleagues have presented an attractive model of insulin signal processing in which the decoding potential of the network arises from “design logic“— differences in kinetic behavior and network connectivity. Their study therefore provides a concrete example of how complex signaling dynamics are encoded and decoded by a molecular network. It also study raises a few interesting questions about the insulin response. For example, the model predicted a delayed inhibition of S6K through mTOR, but the existence and precise nature of such inhibition remains to be validated experimentally. Another question is how S6K, G6Pase, and GSK3β will respond to insulin oscillations, rather than to a single pulse. A microfluidics approach that controls the timing of insulin pulses may reveal whether these enzymes function optimally at a specific frequency, as was observed for yeast responding to repeated osmotic shock (Mettetal et al., 2008). Since it is well known that aberrant insulin signaling can lead to various metabolic diseases including diabetes mellitus, a more complete understanding of how insulin dynamics control downstream responses promises to provide a new way of thinking about how to diagnose and treat metabolic disorders.
REFERENCES
- Batchelor E, Loewer A, Mock C, Lahav G. Stimulus-dependent dynamics of p53 in single cells. Molecular systems biology. 2011;7:488. doi: 10.1038/msb.2011.20. [DOI] [PMC free article] [PubMed] [Google Scholar]
- Boulware MJ, Marchant JS. Timing in cellular Ca2+ signaling. Curr Biol. 2008;18:R769–R776. doi: 10.1016/j.cub.2008.07.018. [DOI] [PMC free article] [PubMed] [Google Scholar]
- Brabant G, Prank K, Schofl C. Pulsatile patterns in hormone secretion. Trends Endocrinol Metab. 1992;3:183–190. doi: 10.1016/1043-2760(92)90169-2. [DOI] [PubMed] [Google Scholar]
- Bratusch-Marrain PR, Komjati M, Waldhausl WK. Efficacy of pulsatile versus continuous insulin administration on hepatic glucose production and glucose utilization in type I diabetic humans. Diabetes. 1986;35:922–926. doi: 10.2337/diab.35.8.922. [DOI] [PubMed] [Google Scholar]
- Goentoro L, Shoval O, Kirschner MW, Alon U. The incoherent feedforward loop can provide fold-change detection in gene regulation. Mol Cell. 2009;36:894–899. doi: 10.1016/j.molcel.2009.11.018. [DOI] [PMC free article] [PubMed] [Google Scholar]
- Kubota H, Noguchi R, Toyoshima Y, Ozaki Y, Uda S, Watanabe K, Ogawa W, Kuroda S. Temporal Coding of Insulin Action through Multiplexing of the AKT Pathway. Mol Cell. 2012 doi: 10.1016/j.molcel.2012.04.018. [DOI] [PubMed] [Google Scholar]
- Ma W, Trusina A, El-Samad H, Lim WA, Tang C. Defining network topologies that can achieve biochemical adaptation. Cell. 2009;138:760–773. doi: 10.1016/j.cell.2009.06.013. [DOI] [PMC free article] [PubMed] [Google Scholar]
- Mettetal JT, Muzzey D, Gomez-Uribe C, van Oudenaarden A. The frequency dependence of osmo-adaptation in Saccharomyces cerevisiae. Science. 2008;319:482–484. doi: 10.1126/science.1151582. [DOI] [PMC free article] [PubMed] [Google Scholar]
- Polonsky KS, Given BD, Van Cauter E. Twenty-four-hour profiles and pulsatile patterns of insulin secretion in normal and obese subjects. J Clin Invest. 1988;81:442–448. doi: 10.1172/JCI113339. [DOI] [PMC free article] [PubMed] [Google Scholar]
- Santos SD, Verveer PJ, Bastiaens PI. Growth factor-induced MAPK network topology shapes Erk response determining PC-12 cell fate. Nature cell biology. 2007;9:324–330. doi: 10.1038/ncb1543. [DOI] [PubMed] [Google Scholar]