

Abstract
Animal experiments indicate that after repeated pairings of palatable food receipt and cues that predict palatable food receipt, dopamine signaling increases in response to predictive cues, but decreases in response to food receipt. Using functional MRI and mixed effects growth curve models with 35 females (M age = 15.5 ± 0.9; M BMI = 24.5 ± 5.4) we documented an increase in BOLD response in the caudate (r = .42) during exposure to cues predicting impending milkshake receipt over repeated exposures, demonstrating a direct measure of in vivo cue-reward learning in humans. Further, we observed a simultaneous decrease in putamen (r = −.33) and ventral pallidum (r = −.45) response during milkshake receipt that occurred over repeated exposures, putatively reflecting food reward habitation. We then tested whether cue-reward learning and habituation slopes predicted future weight over 2-year follow-up. Those who exhibited the greatest escalation in ventral pallidum responsivity to cues and the greatest decrease in caudate response to milkshake receipt showed significantly larger increases in BMI (r = .39 and −.69 respectively). Interestingly, cue-reward learning propensity and food reward habituation were not correlated, implying that these factors may constitute qualitatively distinct vulnerability pathways to excess weight gain. These two individual difference factors may provide insight as to why certain people have shown obesity onset in response to the current obesogenic environment in western cultures, whereas others have not.
Keywords: Cue-reward learning, food reward habituation, incentive salience, Pavlovian conditioning, obesity risk factors, fMRI
1. INTRODUCTION
Animal experiments indicate that firing of dopamine (DA) neurons projecting to the striatopallidal complex initially occurs in response to receipt of palatable food, but after repeated exposures, shifts to occur in response to cues that predict impending food receipt (Day et al., 2007; Schultz et al., 1997; Tindell et al., 2004). Theorists posit this shift during cue-reward learning acts to either update knowledge regarding the predictive cues or attribute reward value to the cues themselves thereby guiding behavior (Balleine et al., 2008; Robinson & Berridge, 1993; Smith et al., 2009; Flagel et al., 2010). The incentive-sensitization model indicates that greater striatopallidal responsivity to sensitized cues produces food ‘wanting’ and consequent overeating, echoing the processes that maintain habitual drug use (Robinson & Berridge, 1993). In animals that readily exhibit incentive salience toward cues that predict food reward, the cues robustly motivate behavior (Flagel et al., 2010; Robinson & Flagel, 2009). Cross-sectional support for the incentive-sensitization model of obesity is evident when evaluating blood oxygen level dependent (BOLD) response to food cues in obese versus lean individuals. Compared to their lean counterparts, overweight and obese individuals show significantly greater activation in the striatum, orbitofrontal cortex (OFC), and amygdala in response to images of palatable food (Bruce et al., 2010; Martin et al 2010; Nummenmaa et al., 2012; Rothemund et al., 2007; Stice et al., 2010; Stoeckel et al. 2008) and to cues that predict impending palatable food receipt (Ng et al., 2011; Stice et al., 2008b). In support of this data, the degree to which lean humans are habitually eating beyond energy needs is related to greater striatal response to cues for impending palatable food receipt (Burger & Stice 2013). Moreover, animal studies of incentive salience indicate critical individual differences in cue-reward learning (e.g., Flagel et al., 2010; Robinson & Flagel 2009). Although elevated reward region responsivity to food cues has predicted future weight gain (Chouinard et al., 2010; Demos et al., 2012; Yokum et al., 2011), research has not tested for individual differences in cue-reward learning or whether greater reward-cue learning predicts future weight gain, as implied by the incentive-sensitization model. The prediction of weight gain would represent a rigorous behavioral test of the impact of this potential neural vulnerability factor. Given that virtually all humans consume energy-dense foods on occasion, but only 30% become obese, it vital to test whether some individuals show elevated reward-cue learning, which may set the stage for incentive sensitization processes that lead to overeating.
Habitation to repeated intake of one food (i.e., sensory specific satiety) is thought to impact weight regulation (e.g., Epstein et al., 2009), however, the vast majority of animal and human studies use acute food intake as the outcome (see Raynor & Epstein 2001 for review). The mesolimbic neuroadaptive processes associated habitation to reward receipt from food has not been investigated thoroughly. One positron emission tomography study found that over repeated tastes of chocolate, preferences and striatal response food declined in nine ‘chocolate lovers’ (Small et al., 2001). Elucidating this process is vital given prominent theories hypothesizing that reduced sensitivity of reward circuitry increases risk for compensatory overeating and obesity (Volkow et al., 2008; Johnson & Kenny 2010). Supporting this theory, obese versus lean humans have fewer striatal DA D2 receptors (Volkow et al., 2008; deWeijer et al., 2011) and show reduced striatal response to palatable food intake (Babbs et al., 2013; Green et al., 2011; Stice et al., 2008a,b). Additionally, habitual consumption of sweet foods is inversely related to striatal and amygdala response during intake of similar foods (Burger & Stice 2012; Green & Murphy 2012; Rudenga & Small 2012). There is evidence that this vulnerability may be acquired, as habitual energy-dense food intake that results in weight gain decreases DA D2 receptor density and DA sensitivity in animals (Geiger et al., 2009; Johnson & Kenny 2010) and reduces striatal response to food receipt in humans (Stice et al., 2010). In previous decision-based reward learning tasks, the reward feedback signal in the caudate associated with monetary gain decreased as learning progressed (Delgado et al., 2005). This indicates habituation of reward feedback during reward-based learning. These data imply that striatal habituation can be observed in an acute setting during a reward-learning task. Although lower reward region responsivity to palatable food receipt has predicted future weight gain for individuals at genetic risk for compromised DA signaling in reward circuitry (Stice et al., 2008a), research has not tested for individual differences in propensity for striatal habituation to palatable food receipt in humans or whether greater habituation propensity predicts weight gain. As most humans consume energy-dense foods at least periodically, but only some become obese, it is vital to investigate individual difference factors that may set the stage for a blunting of reward circuitry responsivity to habitual palatable food intake that may contribute to overeating.
To investigate in vivo individual differences in both cue-reward learning and food receipt reward habituation, we used fMRI during repeated exposures to milkshake and tasteless solution receipt that were paired with unconditioned cues and modeled the data to assess change BOLD response over repeated exposures. We tested the hypotheses that 1) striatopallidal response to cues that predicted impending palatable food receipt would increase after repeated exposures (cue-reward learning); and 2) striatopallidal response to palatable food receipt would decrease after repeated milkshake tastes (food reward habituation). We also assessed BMI at baseline and at 6-month, 1-year, and 2-year follow-ups, which allowed us to test the hypotheses that individuals who show a greater cue-reward learning propensity and a greater food reward habituation propensity showed elevated future increases in BMI.
2. METHODS
2.1 Participants & Procedures
Healthy adolescent girls (n = 35; M age = 15.5 ± 0.94; M BMI = 24.5 ± 5.35, range = 17.3-38.9) underwent an fMRI session while viewing cues (geometric shapes: diamond, square, circle) that predicted impending receipt of a palatable milkshake or a tasteless solution. The sample consisted of: 2% Asian/Pacific Islanders, 2% African Americans, 86% European Americans, 5% Native Americans, and 5% mixed racial heritage. We excluded those who reported binge eating or compensatory behaviors (e.g., vomiting for weight control) in the previous three months, regular use of psychotropic medications or illicit drugs, head injury with a loss of consciousness or current Axis I psychiatric disorder per Diagnostic and Statistical Manual of Mental Disorders, 4th edition criteria (1994). Informed consent was obtained from parents and assent from adolescents. The local Institutional Review Board approved this study.
On the day of the baseline assessment, participants were asked to consume their regular meals but to refrain from eating or drinking for at least 4-6 hr immediately preceding their imaging session for standardization. This deprivation period was selected to capture the timing that most individuals experience as they approach their next meal, which is a time when individual differences in food reward would logically impact caloric intake. Although participants were not observed during this time, they reported a mean fasting time of 7.6 ± 4.6 hours prior to the scan time. At baseline participants completed the fMRI paradigm, as well as a diagnostic screen and surveys. Before the baseline imaging session, participants were familiarized with the milkshake conditioning paradigm on a laptop computer by research staff. This included showing participants images of the shapes and explaining that tastes of fluids would sometimes follow the visual cues. No tastants were consumed prior to imaging session. Measures of height and weight were made at baseline and at 6 month, 1-year and 2-year follow-ups.
2.2 Body Mass
The body mass index (BMI; kg/m2) was used to reflect height-adjusted weight. After removal of shoes and coats, height was measured to the nearest millimeter using a stadiometer and weight was assessed to the nearest 0.1 kg using a digital scale. Two measures of height and weight were obtained and averaged. Height and weight measures allowed us to calculate BMI at each assessment.
2.3 fMRI acquisition and paradigm
Scanning was performed by a Siemens Allegra 3 Tesla head-only MRI scanner. A standard birdcage coil was used to acquire data from the entire brain. A thermo foam vacuum pillow and additional padding was used to restrict head motion. Functional scans used a T2-weighted gradient single-shot echo planar imaging (EPI) sequence (TE=30 ms, TR=2000 ms, flip angle=80°) with an in plane resolution of 3.0 × 3.0mm2 (64×64 matrix; 192 × 192mm2 field of view). To cover the whole brain, thirty-two 4-mm slices (interleaved acquisition, no skip) were acquired along the AC-PC transverse, oblique plane as determined by the midsagittal section. Structural scans were collected using an inversion recovery T1 weighted sequence (MP-RAGE) in the same orientation as the functional sequences to provide detailed anatomic images aligned to functional scans. High-resolution structural MRI sequences (FOV = 256 × 256mm2, 256×256 matrix, thickness = 1.0 mm, slice number ≈160) were also acquired.
The milkshake conditioning paradigm was designed to examine blood oxygen level dependent (BOLD) response when receiving milkshake or the tasteless solution or in response to cues signaling impending receipt of these two beverages. The milkshake (270 kcals, 13.5g fat, 28g sugar per 150mL) was prepared with 60g of vanilla Häagen-Dazs® ice cream, 80mL of 2% milk, and 15mL of Hershey’s® chocolate syrup. The tasteless solution was designed to mimic the natural taste and osmolality of saliva, consisted of 25 mM KCl and 2.5 mM NaHCO3. Three black shapes (diamond, square, circle) were presented that signaled the impending delivery of 0.5 mL of a chocolate milkshake, a tasteless solution, or no fluid. Pairing of cues with stimuli was randomly determined across participants. On 50% of the milkshake and tasteless solution trials, the taste was not delivered as expected to allow the investigation of the BOLD response to the cue that was not confounded with response to the actual receipt of the taste (unconfounded trials) and to possibly increase incentive salience attribution (Anselme et al., 2012). The events of interest in this paradigm were: (a) receipt of milkshake (milkshake receipt), (b) milkshake cue followed by no milkshake taste (unconfounded milkshake cue), (c) receipt of tasteless solution (tasteless solution receipt), and (d) tasteless solution cue followed by no tasteless solution (unconfounded tasteless solution cue). Cues were presented with a digital projector/reverse screen display system at the back end of the MRI scanner bore, which was visible via a mirror mounted on the head coil. Tanstants were delivered using programmable syringe pumps (Braintree Scientific BS-8000, Braintree, MA) and a customized manifold attached to the head coil that fit into the participants’ mouths and delivered the taste to a consistent tongue segment. All stimuli operated through MATLAB (Mathworks, Inc., Sherborn, MA) to ensure consistent volume, rate, and timing. A timeline of the paradigm can be seen in Figure 1. Cues were presented in a jittered time span for 5–12 s (M = 7 s). 4–11 s (M = 7 s) after onset of the cue, taste delivery occurred for duration of 5 s. The taste cue remained on the screen for 8.5 s after the taste delivery onset (3.5 s after the taste stopped). Participants were instructed to swallow when the cue disappeared. The next cue appeared for a jittered time span of 1–5 s after the previous cue went off. The use of jitter timing decreased the predictability of the stimuli and insured stimuli were presented at various time points relative to the slice acquisition. Each run consisted of four trials of each condition (milkshake receipt, tasteless solution receipt and cues predicting milkshake receipt and tasteless solution receipt). Trials were presented in a randomized order. Participants underwent four runs, resulting in a total 16 trials of each event of interest.
Figure 1.
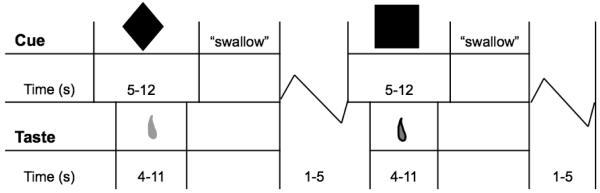
Sample timeline of presentation of geometric shapes (cues) and delivery of milkshake and tasteless solution. Cues followed a similar time course (presented for 5-12 s) with no taste delivery. Presentation of stimuli and assignment of geometric cue were randomized.
2.4 fMRI preprocessing
All fMRI data were preprocessed and analyzed using SPM8 software (Wellcome Department of Imaging Neuroscience, London, England) in MATLAB. Prior to preprocessing in SPM all fMRI data where manually reoriented to the AC-PC transverse oblique plane, as determined by the midsagittal section and then skull stripped using the brain extraction tool (BET) in FSL (FMRIB, Oxford, UK). The images were slice time acquisition corrected to the slice obtained at 50% of the TR as to better account for the timing differences during acquisition (Sladky et al., 2011). All images were motion corrected, realigned to the mean, normalized to the standard Montreal Neurological Institute (MNI) template brain implemented in SPM8 (ICBM152) at a voxel size of 3mm3 for functional images and 1mm3 for structural images. Data were spatially smoothed with a 6mm full width at half maximum kernel and were high-pass filtered with a cutoff of 128 s to remove low frequency fluctuation in the BOLD signal.
Motion parameters were included as covariates of no interest. Any participant that showed excessive head movement (>2 mm) was excluded from that analysis. One participants’ fMRI data were not analyzed because they showed excessive head movement during 3 of the 4 runs of the paradigm. Two other participants had one run excluded, but data from their runs that met motion criteria were analyzed.
Statistical analyses
Condition-specific effects at each voxel were estimated using general linear models. Vectors of the onsets for each event of interest were compiled and entered into the design matrix so that event-related responses could be modeled by the canonical hemodynamic response function (HRF), consisting of a mixture of two gamma functions that emulate the early peak at 5 s and the subsequent undershoot. Temporal derivatives of the HRF were also included to obtain a better model of the data (Henson et al., 2002).
Data were extracted from individual-level contrasts (cue predicting milkshake receipt > cue predicting tasteless solution receipt) to reflect response to an arbitrary cue predicting milkshake receipt and (milkshake receipt > tasteless solution receipt) to reflect response to milkshake receipt. A minimum of four data points is necessary to determine whether a linear term adequately captures general increases or decreases over time or whether it is necessary to fit higher order terms (Singer & Willett, 2003), thus we statistically smoothed the data to four segments across the paradigm. Specifically, BOLD response based on the above contrasts were averaged from the 1st- 4th events, 5th- 8th events, 9th-12th events and 13th-16th events, resulting in data from four separate learning segments during the paradigm. Averaging across every four events of the scan allowed us to assess change over repeated exposures while maintaining some aggregate BOLD signal at each point thereby minimizing effects of possible signal spikes to an individual stimulus. Parameter estimates from the four learning segments (e.g., 1-4th events, 5th-8th events, etc…) were individually extracted from the anatomical regions of interest (ROIs) including the caudate, putamen, and ventral pallidum using the masks from the WFUPickAtlas (Maldjian et al., 2003) for both contrasts of interests [(cue predicting milkshake receipt > cue predicting tasteless solution receipt) and (milkshake receipt > tasteless solution receipt)]. This resulted in the average activity from each of the ROIs at four learning segments for both response to the cue and response to receipt. These ROIs were selected based on previous animal and human data indicating that they are central in encoding reward and show pronounced neuroadpatatiion during reward-based conditioning processes, in theory contributing to the sensitization to cues (e.g, Balleine et al., 2008; Day et al., 2007; Flagel et al., 2010; Schultz et al., 1997; Smith et al., 2009; Tindell et al., 2004; Robinson & Berridge 1993).
Model Building
Extracted fMRI data from each of the ROIs was used in random intercept, mixed effects growth analyses (SAS Inc. ver. 9.3, Cary, NC; Singer 1998) to model group-level cue-reward learning and receipt habituation over the scan session. These models offer a flexible and powerful technique for modeling change in continuous variables and use maximum likelihood estimation to accommodate missing data (Singer 1998). In all mixed effects growth models intercepts were treated as random and slopes were treated as fixed. Typically there is reduced sensitivity if all effects are modeled as random. Accordingly, we modeled slopes as fixed effects due to the relatively small sample. Following (Singer & Willet 2003), we: a) examined empirical growth plots; b) fit an unconditional means model; c) fit an unconditional linear growth model; and d) fit unconditional non-linear models. We then compared the latter two models for model quality using Akaike Information Criterion (AIC) to determine whether linear or higher-order polynomial models fit the data better. AIC is a measure of goodness of fit relative to model complexity (Burnham & Anderson, 2002). Relative to higher-level polynomial models, linear growth models consistently showed a lower AIC (indicating better model quality) or the AIC change was less than 2 (indicating not a significant change in model quality; Burnham & Anderson, 2002), suggesting that linear terms optimally captured change in BOLD response during conditioning. Therefore, we presented results using linear growth models. The same process was used to build and test growth models predicting future weight change. Individual slopes were calculated that reflected BOLD response to cues and BOLD response to receipt over the repeated events. These slopes were then used to predict BMI change over 2-year follow-up in mixed effects growth models, controlling for baseline BMI, to assess whether propensity for cue-reward learning and food reward habituation predicted weight gain. Again, slopes were treated as fixed and intercepts were treated as random. Using the aforementioned model building techniques, again, a linear term provided the optimal fit to the BMI change data.
Data is presented in mean ± standard deviation unless otherwise noted and a two-sided P < .05 was considered significant. Skewness and kurtosis of data were assessed to insure normality, and potentially overly influential data points were checked to insure effects remained significant if those points were removed (e.g., Fig 3A,3B). Subsequent results remain significant when statistically controlling for hours eaten prior to the scan and when excluding those individuals with a BMI > 25. The number of hours since eaten and baseline BMI did not significantly correlate with cue-reward learning and food reward habituation. Collectively this suggests that time since last eaten and/or overweight status during the scan assessment at baseline are not significantly driving the observed effects.
Figure 3.

Mean BOLD response to A) cues that signal impending palatable food receipt and B) palatable food receipt over repeated exposures in one fMRI session. As shown with changes in BOLD response over 4 learning periods (16 total events) in specified region of interest. The color bar represents the T-value of activity over the scan showing: A) increases in caudate responsivity to cue predicting milkshake receipt > cue predicting tasteless solution receipt, and B) decreases in putamen (middle row) and ventral pallidum (bottom row) responsivity to milkshake receipt > tasteless solution receipt.
3. RESULTS
3.1 Cue-reward learning and food reward habituation
We observed a positive relation between the number of exposures and caudate response to the cue predicting milkshake receipt > cue predicting tasteless solution receipt (r = 0.42; F(1,101)=6.2; P = 0.014; Fig. 2A,3A) suggesting cue-reward learning in this region across the sample. Similar activity in the ventral pallidum was also observed, but was only a trend (r = 0.27; F(1,101)=2.6; P = 0.10; Fig. 1C). There was no significant effect in the putamen (r = 0.08; P = 0.64; Fig. 2B).
Figure 2.

Changes in responsivity to cues that signal impending palatable food receipt and palatable food receipt over repeated exposure in one fMRI session. A) Positive relation between number of exposures and caudate response to the cue predicting milkshake receipt > cue predicting tasteless solution receipt (grey curve, solid line; P = 0.014). B) Inverse relation between number of exposures and putamen response to milkshake receipt > tasteless solution receipt (black curve, dashed line; P = 0.04) and C) Inverse relation between number of exposures and ventral pallidum response to milkshake receipt > tasteless solution receipt (black curve, dashed line; P = 0.009).
When testing for a relation between the number of exposures and response to milkshake receipt > tasteless solution receipt, we found significant inverse relations in the putamen (r = −0.33; F(1,101)= 3.9; P = 0.04; Fig. 2B,3B), and ventral pallidum (r = −0.45; F(1,101)= 7.1; P = 0.009; Fig. 2C,3B), suggesting food reward habituation in these regions. There was no significant effect in the caudate (r = 0.26; P = 0.13; Fig. 2A).
3.2 Propensity for neuroadaptation as a risk factor for weight gain
Using individual slopes of cue-reward learning to predict BMI change we found that propensity for cue-reward learning, (i.e., greater positive slope during cue exposure) in the ventral pallidum predicted greater increases in BMI over 2-year follow-up (r = 0.39; F(1,88)= 5.3; P = 0.02; Fig. 4A). However, no significant relation was observed between weight gain and cue-reward learning in the caudate (r = 0.08; P = 0.64) or putamen (r = 0.08; P = 0.64), though these effects were in the same direction. We also observed that greater food reward habituation (i.e., greater negative slope during receipt) in the caudate predicted greater future increases in BMI (r = −0.69; F(1,88)= 16.7; P < 0.001; Fig. 4B). Although the relation between weight gain and habituation in the putamen (r = −0.22; P = 0.20), and the ventral palldium (r = −0.08; P = 0.62) were in the same direction, neither were statistically significant.
Figure 4.

(A) Greater cue-reward learning in the ventral pallidum predicted increases in BMI over 2-year follow-up (P = 0.02). (B) Greater food reward habituation in the caudate predicted increases in BMI over 2-year follow-up (P < 0.001).
3.3 Relation between cue-reward learning and receipt habituation
Propensity for cue-reward learning did not significantly correlate with food reward habituation in the three brain regions assessed (caudate: r = −0.05; P = 0.79; putamen: r = 0.02; P = 0.91; ventral pallidum: r = 0.09; P = 0.57). Further, we examined specifically the two regions that predicted weight gain; cue response in the ventral palldium and receipt response in the caudate were not significantly correlated (r = 0.15; P = 0.38). Collectively, this provides evidence of the orthogonality of the observed findings, suggesting these are individual difference factors.
4. DISCUSSION
Results indicated that during exposure to repeated pairings of palatable food receipt and cues that predict impending receipt of the food, caudate response to cues increased, while putamen and ventral pallidum response to food receipt decreased. The adaptive response to cues seen here, extend findings from animal experiments that indicate phasic DA release shows a similar dynamic pattern through the course of Pavlovian conditioning. Specifically, animal models indicate that DA signaling in response to neutral stimuli that predict rewards is shown to increase over repeated exposure, in theory becoming attractive and desirable incentive stimuli, while DA signaling in response to reward receipt concurrently declines (Day et al., 2007; Schultz et al., 1997; Tindell et al., 2004). Further, the present findings extend results from computational models, i.e., temporal difference or prediction error models, which reveal similar adaptive responses in the striatum over the course of repeated exposures within the context of Pavlovian conditioning (McClure et al 2003; O’Doherty et al., 2006; Suri & Schultz 2001). Results showing decreased putamen and ventral pallidum response to food receipt over repeated exposures also converge with findings from animal experiments that demonstrated that intragastric infusions of fat resulted in decreased DA signaling over a 60 min period (Ferreira et al., 2012). The present study enhances this knowledge base by directly examining adaptive BOLD response to food intake and associated predictive cues and tests whether individual differences in these responses predicts behavioral data over long-term follow-up.
We found that propensity for cue-reward learning in the ventral pallidum predicted future weight gain. The ventral pallidum has been implicated in conveying distinct signaling for ‘wanting’ (incentive-salience) and ‘liking’ (hedonic pleasure) of stimuli to downstream brain regions, and is thought to influence decision-making responses to rewarding stimuli (Smith et al., 2004). Converging with the present data, animal models demonstrate that an individual propensity for the attribution of incentive salience to reward cues increases the motivational properties of the cues and thus influences behavior (Flagel et al., 2010; Robinson & Flagel 2009). This increased incentive salience of cues is thought to induce cravings and create impulse control deficits during cue exposure (Flagel et al. 2010). Therefore, we suggest that individuals with a propensity for adaption in ventral pallidum during cue-reward learning may attribute greater incentive salience to food reward-related cues, placing them at risk for the observed weight gain as they may be more susceptible to environmental food stimuli. This work elucidates the adaptive processes that may give rise to the consistent hyper-responsivity to food cues seen in overweight and hyperphagic individuals (Burger & Stice 2013; Martin et al 2010; Rothemund et al., 2007; Stoeckel et al. 2008).
We also found that greater food reward habituation in the caudate predicted future weight gain. There are several potential interpretations of this finding. First, the data could indicate that an initial heightened reward response to palatable food receipt may trigger opponent-process mechanisms that attenuate subsequent responses resulting in the rapid decline in activity over the repeated exposures (Solomon & Corbit 1974). In support, heightened caudate responsivity to the initial tastes of milkshake accounted for a substantial proportion of the variance in future weight gain (r = 0.30) in the present data, suggesting the initial elevated response may contribute to greater caloric intake. In theory, repeated challenges to the reward system (i.e., overeating palatable energy dense foods) may breach the ability of the subsequent neuroadaptive processes, resulting in a chronic downregulation of reward circuitry (Koob & Le Moal, 2005). Thus, future research should attempt to determine whether the increased weight gain is a function of a greater initial response to receipt or the rapid decline in response over repeated exposure or a combination of the two patterns. Second, the rapid habituation in the caudate may prompt overeating in an effort to achieve the degree of hedonic pleasure previously experienced (Volkow et al., 2008), as dorsal striatum response has been shown to be positively related to hedonic ratings of food stimuli (Small et al., 2003). Although, the relation between a reduced striatal response and obesity may also be related to the thesis that overeating may produces an insensitivity to negative outcomes resulting in compulsive-like eating (Johnson & Kenny, 2010).
The observed relations between future weight gain and both cue-reward learning and habituation propensity were strong (r’s 0.30-0.69). These effects are larger than the predictive relations for other established risk factors for future weight gain, such as parental obesity (r’s 0.18-0.21; Salbe et al., 2002; Whitaker et al., 1997). It should also be noted that individual differences in the average BOLD response to milkshake cue > tasteless solution cue and to milkshake receipt > tasteless solution receipt across all 16 events in these ROIs did not show significant relations to future increases in BMI in this sample. This illustrates the utility of capturing individual differences in adaptive processes of reward-cue learning and food reward habituation.
Thirty percent of Americans have a healthy weight (Flegal et al., 2012), yet nearly all have consumed highly palatable, energy-dense foods at least an intermittent basis. Therefore gaining a better understanding of individual difference factors provide insight as to why most humans have consumed energy-dense foods, but only some initiate habitual intake of these foods and gain excess weight. In the present study, we observed no relation between individuals showing the greatest cue-reward learning and those showing the greatest receipt habituation, indicating those individuals that show the greatest cue-reward learning where not the same individuals that show the greatest habituation. The orthogonality of the data suggests two qualitatively distinct vulnerability pathways to weight gain and do not support the notion that a within-subject discrepancy between anticipated and experienced reward increases risk for weight gain. In theory, these independent processes may maintain overeating, yet both learning processes are evident during initial exposures to energy-dense foods.
In sum, these data are the first to directly demonstrate individual differences in cue-reward learning and food reward habituation, and that a propensity for these two processes predicts future increases in BMI. These data provide insight into documenting mechanisms that may give rise to the elevated incentive sensitization and reduced striatal responsivity that putatively promote habitual overeating. Future studies should consider applying these techniques to better understand the role of additional brain regions that may encode habituation and novelty (e.g., Yamaguchi et al., 2004), as well as explore the relation to additional behavioral, and self-report measures (e.g., subjective hunger, disinhibitied eating). The present results provide evidence of possible underlying mechanisms by which aberrant reward responses referenced in prominent obesity theories may be initially established. Individual differences in these adaptive processes may explain why some humans are able to maintain a healthy weight despite consuming some energy-dense foods and living in a food promoting environment, whereas other individual’s initial consumption of these foods may contribute to habitual overeating and excess weight gain.
Research Highlights.
Differences in cue-reward learning and habituation may relate to food intake
Individual differences in these phenomena haven’t been studied in vivo in humans
Propensity for cue-reward learning in the pallidum predicted future weight gain
Propensity for food reward habituation in the caudate predicted future weight gain
These processes appeared to be orthogonal, suggesting independent risk factors
Acknowledgments
Support for this work was provided by National Institute of Health Research Grant R1MH64560. We thank Lewis Center for Neuroimaging at the University of Oregon for their assistance in data collection this investigation.
Footnotes
The authors report no conflict of interest with respect to the content of this paper
Publisher's Disclaimer: This is a PDF file of an unedited manuscript that has been accepted for publication. As a service to our customers we are providing this early version of the manuscript. The manuscript will undergo copyediting, typesetting, and review of the resulting proof before it is published in its final citable form. Please note that during the production process errors may be discovered which could affect the content, and all legal disclaimers that apply to the journal pertain.
References
- Abler B, Walter H, Erk S, Kammerer H, Spitzer M. Prediction error as a linear function of reward probability is coded in human nucleus accumbens. Neuroimage. 2006;31(2):790–795. doi: 10.1016/j.neuroimage.2006.01.001. [DOI] [PubMed] [Google Scholar]
- Anselme P, Robinson MJ, Berridge KC. Reward uncertainty enhances incentive salience attribution as sign-tracking. Behav. Brain Res. 2012;238:53–61. doi: 10.1016/j.bbr.2012.10.006. [DOI] [PMC free article] [PubMed] [Google Scholar]
- Babbs RK, et al. Decreased caudate response to milkshake is associated with higher body mass index and greater impulsivity. Phys. & Behav. 2013;121:103–111. doi: 10.1016/j.physbeh.2013.03.025. [DOI] [PMC free article] [PubMed] [Google Scholar]
- Beaver JD, Lawrence AD, Van Ditzhuijzen J, Davis MH, Woods A, Calder AJ. Individual differences in reward drive predict neural responses to images of food. Journal of Neuroscience. 2006;26:5160–6. doi: 10.1523/JNEUROSCI.0350-06.2006. [DOI] [PMC free article] [PubMed] [Google Scholar]
- Burger KS, Stice E. Frequent ice cream consumption is associated with reduced striatal response to receipt of an ice cream–based milkshake. Am. J. of Clin. Nutr. 2012;95:810–817. doi: 10.3945/ajcn.111.027003. [DOI] [PMC free article] [PubMed] [Google Scholar]
- Burger KS, Stice E. Elevated energy intake is correlated with hyperresponsivity in attentional, gustatory, and reward brain regions while anticipating palatable food receipt. Am. J. Clin. Nutr. 2013;97:1188–1194. doi: 10.3945/ajcn.112.055285. [DOI] [PMC free article] [PubMed] [Google Scholar]
- Burnham KP, Anderson DR. Model selection and multi-model inference: a practical information-theoretic approach. Springer; 2002. [Google Scholar]
- Bruce A, Holsen L, Chambers R, Martin L, Brooks W, Zarcone J, et al. Obese children show hyperactivation to food pictures in brain networks linked to motivation, reward and cognitive control. International Journal of Obesity. 2010;34:1494–500. doi: 10.1038/ijo.2010.84. [DOI] [PMC free article] [PubMed] [Google Scholar]
- Chouinard-Decorte F, Felsted J, Small DM. Increased amygdala response and decreased influence of internal state on amygdala response to food in overweight compared to healthy weight individuals. Appetite. 2010;54:639. [Google Scholar]
- Clarke HF, Dalley JW, Crofts HS, Robbins TW, Roberts AC. Cognitive inflexibility after prefrontal serotonin depletion. Science. 2004;304:878–880. doi: 10.1126/science.1094987. [DOI] [PubMed] [Google Scholar]
- Day JJ, Roitman MF, Wightman RM, Carelli RM. Associative learning mediates dynamic shifts in dopamine signaling in the nucleus accumbens. Nature Neurosci. 2007;8:1020–1028. doi: 10.1038/nn1923. [DOI] [PubMed] [Google Scholar]
- Delgado MR, Miller MM, Inati S, Phelps EA. An fMRI study of reward-related probability learning. Neuroimage. 2005;24(3):862–873. doi: 10.1016/j.neuroimage.2004.10.002. [DOI] [PubMed] [Google Scholar]
- Demos KE, Heatherton TF, Kelley WM. Individual differences in nucleus accumbens activity to food and sexual images predict weight gain and sexual behavior. J Neurosci. 2012;32(16):5549–5552. doi: 10.1523/JNEUROSCI.5958-11.2012. [DOI] [PMC free article] [PubMed] [Google Scholar]
- deWeijer B, et al. Lower striatal dopamine D2/3 receptor availability in obese compared to non-obese subjects. EJNMMI. Res. 2011;37:1–5. doi: 10.1186/2191-219X-1-37. [DOI] [PMC free article] [PubMed] [Google Scholar]
- Diagnostic and statistical manual of mental disorders. 4th ed American Psychiatric Assn.; Arlington, VA: 1994. [Google Scholar]
- Epstein LH, Temple JL, Roemmich JN, Bouton ME. Habituation as a determinant of human food intake. Psychological Review. 2009;116(2):384. doi: 10.1037/a0015074. [DOI] [PMC free article] [PubMed] [Google Scholar]
- Everitt BJ, Robbins TW. Neural systems of reinforcement for drug addiction: from actions to habits to compulsion. Nature Neuro. 2005;8:1481–1489. doi: 10.1038/nn1579. [DOI] [PubMed] [Google Scholar]
- Ferreira JG, Tellez LA, Ren X, Yeckel CW, de Araujo IE. Regulation of fat intake in the absence of flavour signalling. The Journal of physiology. 2012;590(4):953–972. doi: 10.1113/jphysiol.2011.218289. [DOI] [PMC free article] [PubMed] [Google Scholar]
- Flagel SB, et al. A selective role for dopamine in stimulus-reward learning. Nature. 2010;469:53–57. doi: 10.1038/nature09588. [DOI] [PMC free article] [PubMed] [Google Scholar]
- Flagel SB, et al. An animal model of genetic vulnerability to behavioral disinhibition and responsiveness to reward-related cues: implications for addiction. Neuropsychopharmacology. 2010;35:388–400. doi: 10.1038/npp.2009.142. [DOI] [PMC free article] [PubMed] [Google Scholar]
- Flegal KM, Carroll MD, Kit BK, Ogden CL. Prevalence of Obesity and Trends in the Distribution of Body Mass Index Among US Adults 1999-2010. J. of Am. Med. Assoc. 2012;307:491–497. doi: 10.1001/jama.2012.39. [DOI] [PubMed] [Google Scholar]
- Geiger BM, Haburcak M, Avena NM, Moyer MC, Hoebel BG, Pothos EN. Deficits of mesolimbic dopamine neurotransmission in rat dietary obesity. Neuroscience. 2009;159(4):1193–1199. doi: 10.1016/j.neuroscience.2009.02.007. [DOI] [PMC free article] [PubMed] [Google Scholar]
- Green E, Jacobson A, Haase L, Murphy C. Reduced nucleus accumbens and caudate nucleus activation to a pleasant taste is associated with obesity in older adults. Brain Res. 2011;1386:109–117. doi: 10.1016/j.brainres.2011.02.071. [DOI] [PMC free article] [PubMed] [Google Scholar]
- Green E, Murphy C. Altered processing of sweet taste in the brain of diet soda drinkers. Phys. & Behav. 2012;4:560–567. doi: 10.1016/j.physbeh.2012.05.006. [DOI] [PMC free article] [PubMed] [Google Scholar]
- Henson RN, Price CJ, Rugg MD, Turner R, Friston KJ. Detecting latency differences in event-related BOLD responses: Application to words versus nonwords and initial versus repeated face presentations. NeuroImage. 2002;15:83–97. doi: 10.1006/nimg.2001.0940. [DOI] [PubMed] [Google Scholar]
- Johnson PM, Kenny PJ. Dopamine D2 receptors in addiction-like reward dysfunction and compulsive eating in obese rats. Nature Neurosci. 2010;13:635–641. doi: 10.1038/nn.2519. [DOI] [PMC free article] [PubMed] [Google Scholar]
- Koob GF, Le Moal M. Plasticity of reward neurocircuitry and the ‘dark side’ of drug addiction. Nature Neurosci. 2005;8:1442–1444. doi: 10.1038/nn1105-1442. [DOI] [PubMed] [Google Scholar]
- McClure SM, Berns GS, Montague PR. Temporal prediction errors in a passive learning task activate human striatum. Neuron. 2003;38(2):339–346. doi: 10.1016/s0896-6273(03)00154-5. [DOI] [PubMed] [Google Scholar]
- Martin LE, et al. Neural Mechanisms Associated With Food Motivation in Obese and Healthy Weight Adults. Obesity. 2010;18:254–260. doi: 10.1038/oby.2009.220. [DOI] [PubMed] [Google Scholar]
- Maldjian JA, Laurienti PJ, Kraft RA, Burdette JH. An automated method for neuroanatomic and cytoarchitectonic atlas-based interrogation of fMRI data sets. NeuroImage. 2003;19:1233–1239. doi: 10.1016/s1053-8119(03)00169-1. [DOI] [PubMed] [Google Scholar]
- Nummenmaa L, Hirvonen J, Hannukainen JC, Immonen H, Lindroos MM, Salminen P, et al. Dorsal Striatum and Its Limbic Connectivity Mediate Abnormal Anticipatory Reward Processing in Obesity. Plos One. 2012;7 doi: 10.1371/journal.pone.0031089. [DOI] [PMC free article] [PubMed] [Google Scholar]
- O’Doherty JP, Buchanan TW, Seymour B, Dolan RJ. Predictive neural coding of reward preference involves dissociable responses in human ventral midbrain and ventral striatum. Neuron. 2006;49(1):157–166. doi: 10.1016/j.neuron.2005.11.014. [DOI] [PubMed] [Google Scholar]
- Raynor HA, Epstein LH. Dietary variety, energy regulation, and obesity. Psychological bulletin. 2001;127(3):325. doi: 10.1037/0033-2909.127.3.325. [DOI] [PubMed] [Google Scholar]
- Robinson TE, Berridge KC. The neural basis of drug craving: an incentive-sensitization theory of addiction. Brain research reviews. 1993;18(3):247–291. doi: 10.1016/0165-0173(93)90013-p. [DOI] [PubMed] [Google Scholar]
- Robinson TE, Flagel SB. Dissociating the predictive and incentive motivational properties of reward-related cues through the study of individual differences. Bio. Psych. 2009;65:869–873. doi: 10.1016/j.biopsych.2008.09.006. [DOI] [PMC free article] [PubMed] [Google Scholar]
- Rothemund Y, et al. Differential activation of the dorsal striatum by high-calorie visual food stimuli in obese individuals. NeuroImage. 2007;37:410–421. doi: 10.1016/j.neuroimage.2007.05.008. [DOI] [PubMed] [Google Scholar]
- Rudenga KJ, Small DM. Amygdala response to sucrose consumption is inversely related to artificial sweetener use. Appetite. 2012;58(2):504–507. doi: 10.1016/j.appet.2011.12.001. [DOI] [PMC free article] [PubMed] [Google Scholar]
- Salbe A, Weyer C, Lindsay R, Ravussin E, Tataranni A. Assessing risk factors for obesity between childhood and adolescence: I. Birth weight, childhood adiposity, parental obesity, insulin, and leptin. Pediatrics. 2002;110:299–306. doi: 10.1542/peds.110.2.299. [DOI] [PubMed] [Google Scholar]
- Schultz W, Dayan P, Montague PR. A neural substrate of prediction and reward. Science. 1997;275:1593–1599. doi: 10.1126/science.275.5306.1593. [DOI] [PubMed] [Google Scholar]
- Singer JD. Using SAS PROC MIXED to fit multilevel models, hierarchical models, and individual growth models. J. of Ed. & Behav. Stat. 1998;23:323–355. [Google Scholar]
- Singer J,D, Willett J. Applied Longitudinal Data Analysis: Modeling Change and Event Occurrence. Oxford University Press; New York: 2003. [Google Scholar]
- Sladky R, et al. Slice-timing effects and their correction in functional MRI. NeuroImage. 2011;58:588–594. doi: 10.1016/j.neuroimage.2011.06.078. [DOI] [PMC free article] [PubMed] [Google Scholar]
- Small DM, Jones-Gotman M, Dagher A. Feeding-induced dopamine release in dorsal striatum correlates with meal pleasantness ratings in healthy human volunteers. Neuroimage. 2003;19:1709–1715. doi: 10.1016/s1053-8119(03)00253-2. [DOI] [PubMed] [Google Scholar]
- Small DM, Zatorre RJ, Dagher A, Evans AC, Jones-Gotman M. Changes in brain activity related to eating chocolate from pleasure to aversion. Brain. 2001;124(9):1720–1733. doi: 10.1093/brain/124.9.1720. [DOI] [PubMed] [Google Scholar]
- Smith KS, Tindell AJ, Aldridge JW, Berridge KC. Ventral pallidum roles in reward and motivation. Behav. Brain Res. 2009;196:155–167. doi: 10.1016/j.bbr.2008.09.038. [DOI] [PMC free article] [PubMed] [Google Scholar]
- Solomon RL, Corbit JD. An opponent-process theory of motivation: I. Temporal dynamics of affect. Psych. Rev. 1974;81:119–145. doi: 10.1037/h0036128. [DOI] [PubMed] [Google Scholar]
- Stice E, Spoor S, Bohon C, Small DM. Relation between obesity and blunted striatal response to food is moderated by TaqIA A1 allele. Science. 2008a;322(5900):449–452. doi: 10.1126/science.1161550. [DOI] [PMC free article] [PubMed] [Google Scholar]
- Stice E, Spoor S, Bohon C, Veldhuizen MG, Small DM. Relation of reward from food intake and anticipated food intake to obesity: a functional magnetic resonance imaging study. J Abnorm Psychol. 2008b;117:924–935. doi: 10.1037/a0013600. [DOI] [PMC free article] [PubMed] [Google Scholar]
- Stice E, Yokum S, Blum K, Bohon C. Weight gain is associated with reduced striatal response to palatable food. J. Neuro. 2010;30:13105–13109. doi: 10.1523/JNEUROSCI.2105-10.2010. [DOI] [PMC free article] [PubMed] [Google Scholar]
- Stoeckel LE, et al. Widespread reward-system activation in obese women in response to pictures of high-calorie foods. NeuroImage. 2008;41:636–647. doi: 10.1016/j.neuroimage.2008.02.031. [DOI] [PubMed] [Google Scholar]
- Suri RE, Schultz W. Temporal difference model reproduces anticipatory neural activity. Neural Computation. 2001;13:841–862. doi: 10.1162/089976601300014376. [DOI] [PubMed] [Google Scholar]
- Tindell AJ, Berridge KC, Aldridge JW. Ventral pallidal representation of pavlovian cues and reward: population and rate codes. J. Neuro. 2004;24:1058–1069. doi: 10.1523/JNEUROSCI.1437-03.2004. [DOI] [PMC free article] [PubMed] [Google Scholar]
- Volkow ND, et al. Low dopamine striatal D2 receptors are associated with prefrontal metabolism in obese subjects: possible contributing factors. NeuroImage. 2008;42:1537–1543. doi: 10.1016/j.neuroimage.2008.06.002. [DOI] [PMC free article] [PubMed] [Google Scholar]
- Yamaguchi S, Hale LA, D’Esposito M, Knight RT. Rapid prefrontalhippocampal habituation to novel events. The Journal of Neuroscience. 2004;24(23):5356–5363. doi: 10.1523/JNEUROSCI.4587-03.2004. [DOI] [PMC free article] [PubMed] [Google Scholar]
- Yokum S, Ng J, Stice E. Attentional bias to food images associated with elevated weight and future weight gain: an fMRI study. Obesity (Silver Spring) 2011;19(9):1775–1783. doi: 10.1038/oby.2011.168. [DOI] [PMC free article] [PubMed] [Google Scholar]
- Whitaker RC, et al. Predicting obesity in young adulthood from childhood and parental obesity. N. Engl. J. of Med. 1997;337:869–873. doi: 10.1056/NEJM199709253371301. [DOI] [PubMed] [Google Scholar]