Abstract
We use the AMSA, associative mean spherical theory of associative fluids, to study ion–ion interactions in explicit water. We model water molecules as hard spheres with four off-center square-well sites and ions as charged hard spheres with sticky sites that bind to water molecules or other ions. We consider alkali halide salts. The choice of model parameters is based on two premises: (i) The strength of the interaction between a monovalent ion and a water molecule is inversely proportional to the ionic (crystal) diameter σi. Smaller ions bind to water more strongly than larger ions do, taking into account the asymmetry of the cation–water and anion–water interactions. (ii) The number of contacts an ion can make is proportional to . In short, small ions bind waters strongly, but only a few of them. Large ions bind waters weakly, but many of them. When both a monovalent cation and anion are large, it yields a small osmotic coefficient of the salt, since the water molecules avoid the space in between large ions. On the other hand, salts formed from one small and one large ion remain hydrated and their osmotic coefficient is high. The osmotic coefficients, calculated using this model in combination with the integral equation theory developed for associative fluids, follow the experimental trends, including the unusual behavior of caesium salts.
I. Introduction
When two salt ions come together in water, it leads to complex water structuring and energetics.1–9 This situation is important throughout electrochemistry, analytical chemistry and in biology (see, for example, ref. 10–14), where it is common to find stable structures of proteins or nucleic acids in which two ions are held together by bridging water molecules. We are interested here in the energies and structures of alkali halides in water. This and similar problems have recently been studied in molecular dynamics (MD) simulations in detailed force-field modeling.15–25 However, despite the insights that such MD simulations give, they do not readily predict thermodynamic properties such as the osmotic coefficient or the enthalpy of dilution. For those purposes, we need computationally less demanding approaches. In this paper, we describe an integral-equation treatment of the ion–ion interaction in explicit water. We focus on the simplest electrolytes, salts of alkali halides in water that form charge symmetric +1 and −1 electrolytes.
Thermodynamic properties of aqueous solutions result from a competition of solute–solute, solute–water and water–water interactions. This competition is reflected in the degree of hydration of the solute particles and consequently in the activity of water and its practical osmotic coefficient ϕ defined as:26
| (1) |
where ∏ is the measured and ∏ideal ideal osmotic pressure. The relation between the osmotic coefficient and activity of solvent a1 is:
| (2) |
Here n1 and n2 are the numbers of moles of solvent (subscript 1) and solute (subscript 2), respectively. Further, a1 is written (neglecting small differences between the vapor pressures and fugacities) as
| (3) |
where is the vapor pressure of pure water and P1 its vapor pressure in mixture with solute. Putting into water a solute that tightly binds to water reduces water’s activity, reduces the vapor pressure of water P1, increasing the osmotic coefficient of solution. Adding a solute that weakly binds to water increases the solvent vapor pressure (increases activity) and reduces the osmotic coefficient. We are interested in how the vapor pressure of water depends on the presence of different electrolytes. We find here, in agreement with previous observations summarized by Collins,10 that for electrolyte solutions the osmotic pressure depends on the difference in hydration of cations and anions.
For aqueous solutions of the alkali halides27 having a given cation, the osmotic coefficient increases with the anion size (the crystal radius28). For example, the osmotic coefficient increases in the order LiCl < LiBr < LiI. The differences in osmotic coefficients of the various salts become smaller with an increase of the cation size and vanish for the Rb+ ion. For the even larger caesium ion, the ordering is reversed: CsI has the smallest osmotic coefficient; the osmotic coefficient increases in the order CsI < CsBr < CsCl. On the other hand, ϕ decreases with the cation size, that is from Li+ to Cs+ for salts having a common anion and different cations. The same ordering applies for the activity coefficients of these solutions.29 Fluoride salts are an exception.
The behavior described above (and later shown in Fig. 2–5) cannot be satisfactorily explained on the McMillan–Mayer level of the modeling and one has resort to the models which treat water explicitly. In the present study we combine an integral equation theory and the explicit water model of electrolyte solution to calculate osmotic properties of such systems. We consider fifteen aqueous alkali halide solutions combining five cations and three anions, including physiologically important salts such as NaCl and KCl. In fair agreement with experimental data, we explain rich osmotic coefficient behavior of alkali halides in water as a consequence of the differences in crystal sizes of interacting ions. The ideas utilized here can be generalized to other systems in order to provide better understanding of aqueous electrolyte and polyelectrolyte solutions.
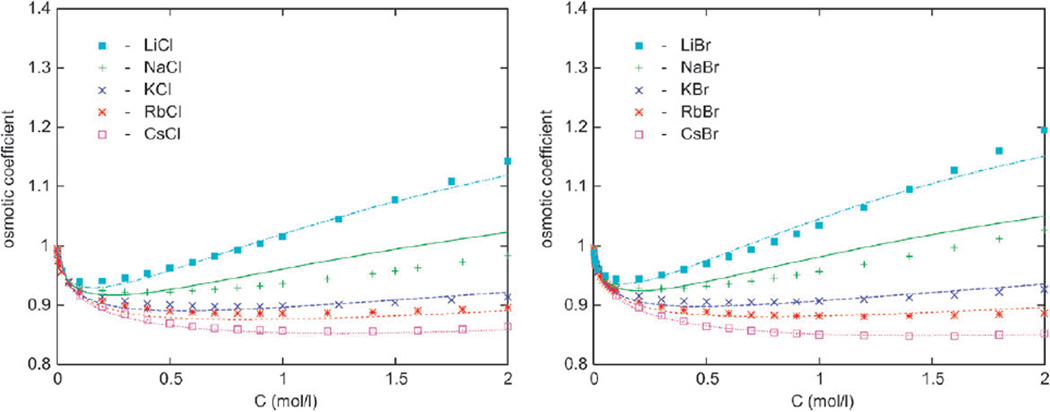
Figure 2.
The osmotic coefficient results for alkali chlorides (left) and bromides (right). Our calculations are presented by lines and experimental data by symbols. From top to bottom: Li, Na, K, Rb, and Cs salts.
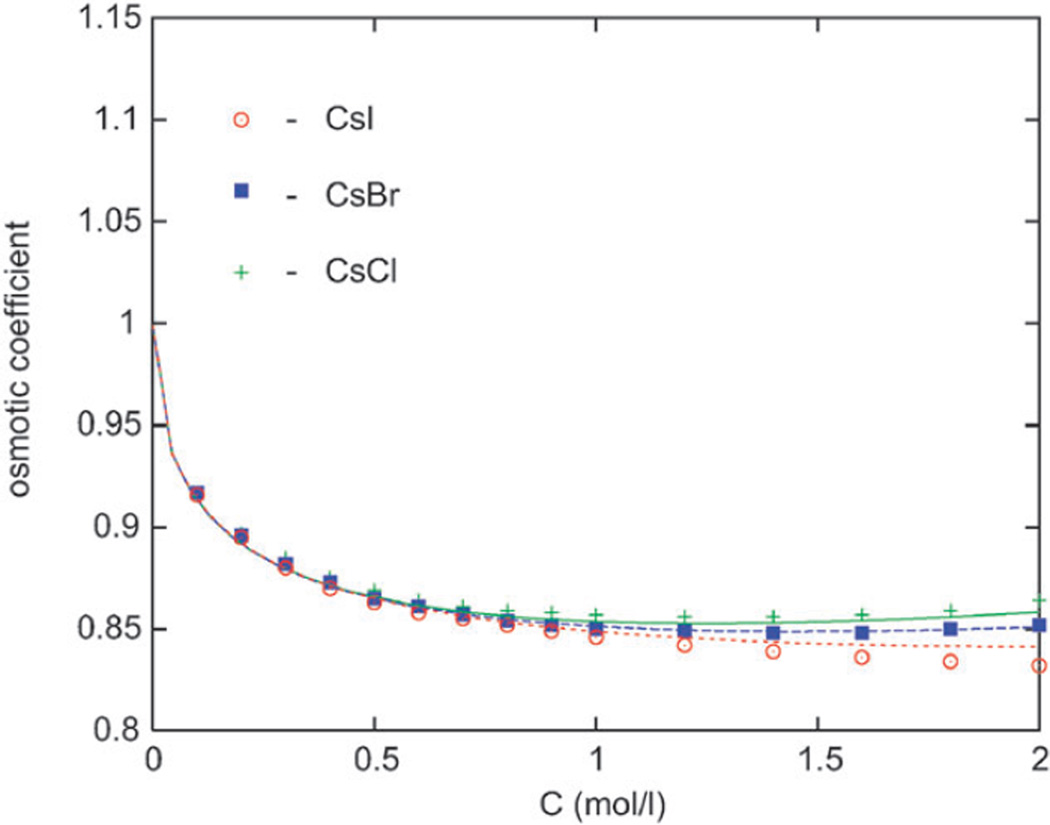
Figure 5.
The osmotic coefficient results for Cs halides. Our calculations are presented by lines and experimental data by symbols. From top to bottom: Cl, Br, and I salt.
II. Modeling aqueous electrolyte solution
Various experiments measure the number of water molecules that solvate an ion.9 Here, we describe a simple solvation model that accounts for the main physics.30 Water molecules are modeled as hard spheres with four off-center square-well sites,31,32 randomly placed at a distance dw from the hard-sphere center.33 As in ref. 30 we model the ions as charged hard spheres of sizes σ+ (cation) and σ− (anion). The numbers of the off-center square-well sites located on the surfaces of the different ions are n+ and n−, respectively. These sites are randomly located at distances d+ and d− from the corresponding hard-sphere center. They account for the ion–water and possible ion–ion association effects. We otherwise treat electrostatic interactions as an effective dielectric constant, ε of the medium, rather than in our water molecules explicitly. By treating waters and ions in this way, we can develop a solvable integral equation treatment of ions in explicit water.
Our pair potential Uab(12) is a sum of the hard-sphere term , Coulomb term and term describing association :
| (4) |
where a and b denote the species of the particles and take the values w for water, + for cations and − for anions; M and L denote the type of the square-well sites and take the values A and B. Labels 1 and 2 denote positions and orientations of the two particles. In summary, while the ions interact in between via the Coulomb and short-range (square-well) potential, the ion–water and water–water interaction is represented by the short-range interaction only.
A Ion–ion interaction
The ion–ion interaction in eqn (4) contains two terms. One is the Coulomb interaction:
| (5) |
Here β = 1/kBT; kB is the Boltzmann constant, T absolute temperature, LB = βe02/4πε0ε, zae0 and zbe0 are the ionic charges (e0 is the elementary charge), and ε0 is the permittivity of vacuum. Our ion–ion interaction also contains a small short-range term valid for oppositely charged ions. This accounts for the polarization of water between oppositely charged ions and is contained in the association term, , of eqn (4). The depth of the anion–cation site–site interaction ε+− is assumed to be inversely proportional to the sum of the ionic diameters
| (6) |
B Solvation model
Here we describe the water–water and water–ion interactions. Our model involves square-well sites on both the water molecules and the ions. We assume the square-well sites are of two types, denoted by A and B. One type of site, say A, represents a positive charge and the other represents a negative charge. Each water molecule has two positive charges due to the hydrogens and two negative charges due to the lone-pair electrons. Thus, each of our water molecules has two A-type and two B-type sites.
Each cation has n+ A-type sites and each anion has n− B-type square-well sites. These represent average numbers of sites, so they need not be integers. Next, we have
| (7) |
where x is the distance between the square-well sites and εab and wab are the square-well depth and width, respectively. In addition, we allow only interactions between different types of sites, which is enforced by the function ΔaLbM,
| (8) |
We now make two simplifications. First, we assume the depths of the site–site square-well potentials for the cation–water, εw+, and anion–water, εw−, interaction are inversely proportional to the sizes of the corresponding ions
| (9) |
where δab is the Kroneker delta and a represents either a cation (+) or anion (−). Here, kw+ and kw− are both negative and their values are chosen to take into account the asymmetry of cation–water and anion–water interactions. The approximation, given by eqn (9), is consistent with the results of the classical Born model (see, for example, ref. 34), and also with the most recent calculations of the solvation free energy.35
Second, we assume the number of binding sites on an ion is related to its surface area: the numbers of square-well sites n+ and n− are proportional to the square of the ionic diameter (a = + or −)
| (10) |
Next we fix the water–water square-well interaction. For the pair of water sites εww = −1625 K.30 According to the prescription above, water interacts with other waters or with ions only through short-ranged interactions. Only the ion–ion interactions are long–ranged.
The solvation model proposed here depends on the radius of an ion in two opposing ways. For small ions, the strength of interaction, measured by the depth of the potential well εwa, is large. On the other hand, for large ions, the numbers of bound waters is larger (eqn (10)). The parameters εwa and na are defined by the individual ions when alone in solution. At finite concentrations, however, the ions interact via Coulombic (eqn (5)) and short-range interaction (eqn (6)) which can cause the desolvation of ions and accounts for the wealth of results shown in Fig. 2–5.
III. The associative mean spherical theory
The thermodynamic properties for the model solution described in the previous section were determined by using the associative mean spherical (AMSA) theory.36–39 We have used the same AMSA theory we used before;30 only small modifications were needed. Taking into account the symmetry of the multidensity Ornstein–Zernike (OZ) equation, which arises as a consequence of the equivalence of the square-well sites belonging to either anion or cation, we obtain33,40
| (11) |
where αa is the matrix with the elements
ρa is the number density of the particles of species a, ĥab (k) and ĉab (k) are the matrices with the elements ĥaαbβ (k) and ĉaαbβ (k) (α, β = 0, A, B), i.e.
where L and M assume the values A or B, depending on which type of the site is assigned to cation (or to anion). These elements are Fourier transforms of the partial correlation functions haαbβ (r) and caαbβ (r), describing correlation between the particles in different bonding states. Here α = 0 denotes the nonbonded state, and α = M the state with the site M bonded. The AMSA closure relation is:
| (12) |
where [Eab]α,β =Eaαbβ =δa0 δβ0, σa is the diameter of species a,
| (13) |
ga0b0 is the contact value of the partial distribution function ga0b0 (r) = ha0b0 (r) + 1,and
| (14) |
Notice that ΔaLbM is defined by eqn (8). In addition, is the Mayer function for the square-well potential (eqn (7)),〈…〉Ω1Ω2 denotes averaging with respect to the orientations Ω1 and Ω2 of the particles 1 and 2, Vab is the volume available for bonding, and XaM the fraction of the particles not bonded to the site M. The latter quantity follows from the relation33
| (15) |
The strength of the associative interaction is given by the constant, K(as), defined by eqn (14). Since the attractive sites can be located at a certain distance from the center, constant K(as) depends also on the geometry of interaction. The quantity εab in eqn (14) can be factored out of the integral, and what is left is merely an integration volume, Vab (bonding volume), within which the interaction is nonzero.
The OZ equations eqn (11), the AMSA closure conditions eqn (12), and the density relation eqn (15) provide a closed set of equations. Details of the solution to these equations are given in ref. 30. The Helmholtz free energy, pressure and chemical potentials were calculated numerically using the coupling-constant integration, with the subsequent differentiation of the resulting free energy with respect to the volume and to the number of particles of each species. Resulting thermodynamic properties are given in excess to the reference values. The reference system is represented by the ions stripped of their charges, i.e. for za =0 and its properties evaluated by the thermodynamic perturbation theory.33,41,42
We calculated the osmotic coefficient ϕ (eqn (1)) considering equilibrium distribution of water molecules between an aqueous electrolyte solution and pure water phase. As in the actual experiment, the two subsystems were assumed to be separated by a membrane permeable for water but not for ions. The chemical potential of water must be the same on both sides of the membrane at equilibrium. Under this condition, the pressure difference measured between the two compartments is equal to the osmotic pressure ∏. We note that the AMSA theory used here correctly reproduces the Debye–Hückel limiting slope26 for the osmotic coefficient.
A Model parameters reflect ionic sizes
The square-well site–site potential, depth εww, width www, and the site displacement dw for the water molecules were chosen to be the same as in our earlier study,30 i.e. εww = −1625 K, www = 0.679σw and dw = 0.279σw with σw = 3.099 Å. For the ion–water and ion–ion associative interaction it makes sense to use Vab as an input parameter (cf. eqn (14)), instead of the square-well width and displacement, dw, separately. For simplicity, the bonding volume is chosen to be the same for all interacting species Vab = Vww, with Vww obtained from eqn (14) (see also ref. 33). In addition, our model contains four parameters kw+, kw−, ki, and si to be obtained from fitting the experimental data.
In order to determine these four parameters we assume that the number of the sticky sites, na, for the smallest Li+ ion is unity, which gives the initial value for si equal 0.692. We have chosen the smallest possible number since, according to the relation eqn (10), for large ions (such as I−) the number of the sticky sites might be otherwise too big, which could affect the applicability of this simple theory. With this choice of si, the values of kw+, kw− and ki were obtained using the values of the ion–water and ion–ion site–site potential square-well depth, εab, giving good agreement between theoretical and experimental results for the set of alkali halide solutions studied here. As a result of a minimal level of optimization, we obtain si = 0.6921/Å2, kw+ = −5050 K Å, kw− = −3200 K Å and ki = −675 K Å. In Table 1 we present diameters of ions, σa, used in this study.
Table 1.
Crystal sizes (diameters, σa) of ions28 used in this study
| Ion | σa/Å |
| Li+ | 1.20 |
| Na+ | 1.90 |
| K+ | 2.66 |
| Rb+ | 2.96 |
| Cs+ | 3.38 |
| Cl− | 3.62 |
| Br− | 3.90 |
| I− | 4.32 |
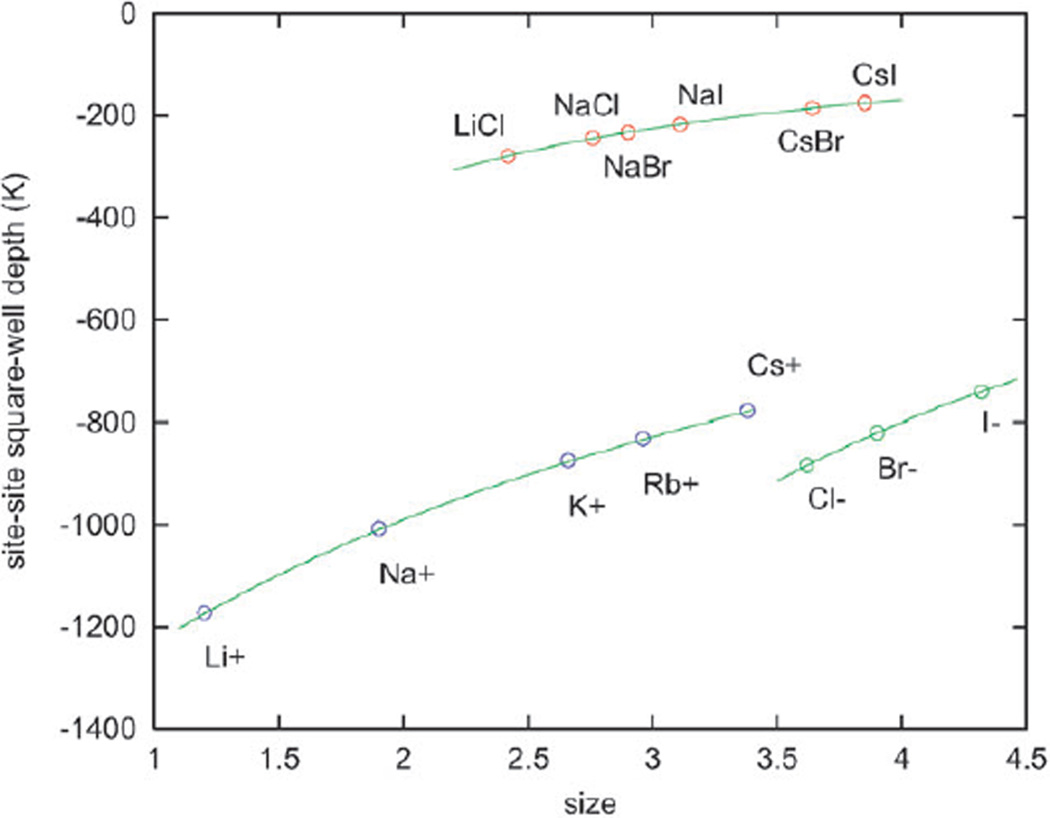
Values of the site–site square-well depth for the ion–ion and water–ion interaction (εab in Kelvin; K) as a function of the ion crystal diameter are presented in Fig. 1.
Figure 1.
Site–site square-well depth for the ion–ion (top curve) and water–ion (lower curves) interaction, εab (in Kelvin), as a function of the ionic diameter (size in Å).
IV. Osmotic coefficient: comparison with experimental data
We consider different aqueous alkali halide solutions in the concentration range up to 2 mol dm−3 of five different cations (Li+, Na+, K+, Rb+, Cs+) and three different anions (Cl−, Br−, I−), all at 298 K. We compare below our calculated osmotic coefficients (lines) to the experimental values (symbols). To orient the reader, we note that lower values of the osmotic coefficient mean that water has a higher escaping tendency. In contrast to this, high values of ϕ indicate that the vapour pressure of the solvent is small (cf. eqn (2) and (3)).
A Osmotic coefficients of alkali halides with a common anion decrease with an increasing size of the cation
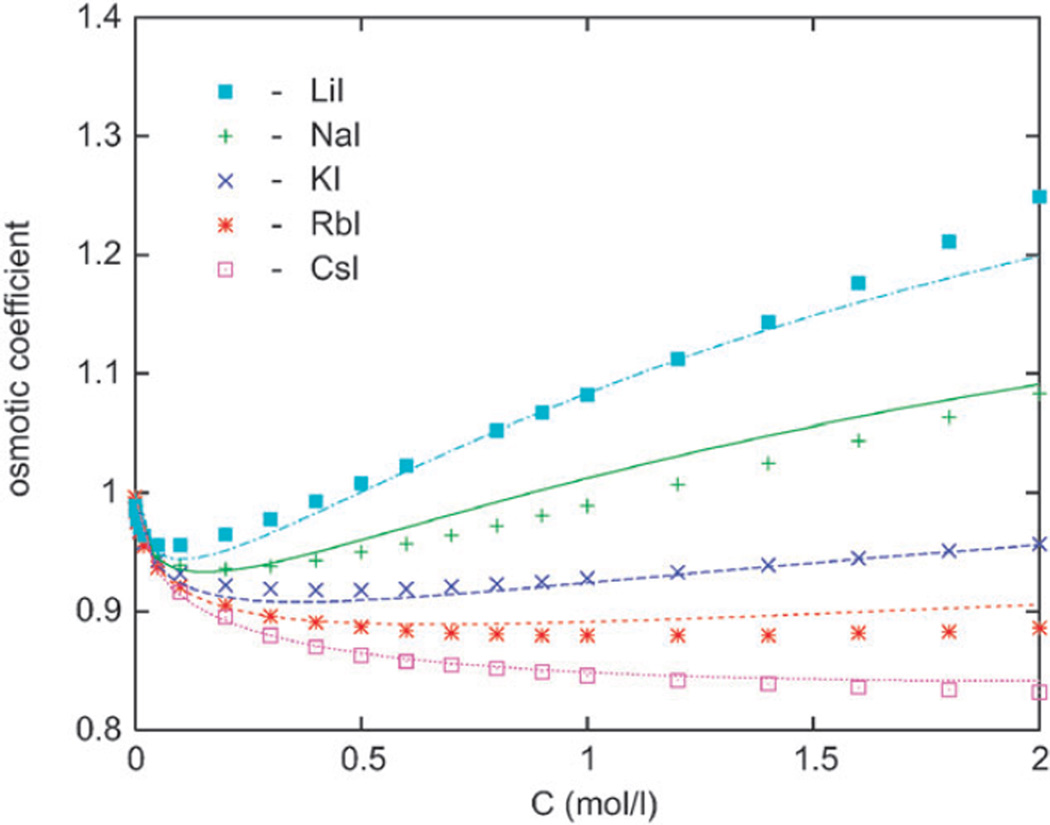
In this section we present the osmotic coefficient results for halide anions with Li+, Na+, K+, Rb+, and Cs+ counterions as a function of the electrolyte concentration in moles per litre. The experimental data are shown by symbols.27 In the left panel of Fig. 2 we show the results for various chlorides in water at 298 K. The osmotic coefficient increases in order from the largest (Cs+) to the smallest (Li+) cation, which means that water is held increasingly tightly in the series from Cs+ to Li+. In our calculations, this is a consequence of eqn (9). The results also indicate strong solvation of Li+ ion, known to be a “kosmotrope”. Increased solvation decreases the vapor pressure and activity of water in solution, and accordingly increases the osmotic coefficient of the salt. Less “strongly” solvated cations (such as Rb+ and Cs+) yield considerably lower osmotic coefficients in combination with halide ions (cf. also Fig. 3). The calculations follow experimental data for chlorides reasonably well, except for the sodium chloride where the theory overestimates the actual hydration. Next, we inspect the results for alkali bromides displayed in the right panel of Fig. 2. The conclusion is the same as for chloride solutions, the modeling is generally satisfactory, except for the NaBr solution. In Fig. 3, the data for alkaline salts with iodine are shown. Here the agreement with experimental data is slightly worse; more concretely, the model overpredicts the solvation of NaI and RbI salts in water.
Figure 3.
The osmotic coefficient results for alkali iodides. Notation as for the previous figure.
B Osmotic coefficients of alkali halides having a common cation increase with the size of the anion
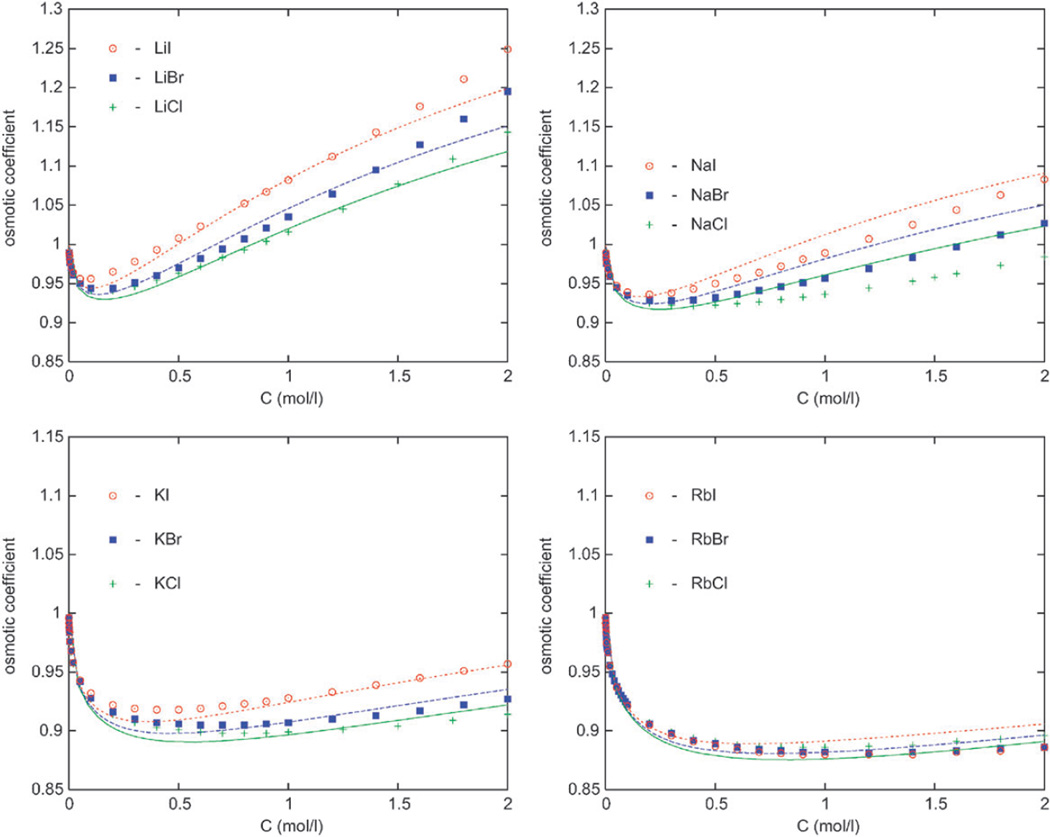
Next we discuss the alkali halide salts with a common cation. Interestingly, these salts exhibit an opposite behavior to that shown in Fig. 2 and 3. In Fig. 4 (top left panel) we present the results for osmotic coefficients of lithium salts. Again the experimental data are presented by symbols. The osmotic coefficient increases in the order LiCl < LiBr < LiI; in other terms, the larger the crystal size of the anion, the more hydrated is the salt and the lower the vapour pressure of solvent. This is readily explained by our model; eqn (10) indicates that larger ions influence more neighboring waters. With an increasing size of the cation the differences in ϕ between different salts become smaller. Finally, for rubidium salts the anion-specific effects are very small, in our estimate, more or less within the experimental error. The theory reproduces these experimental trends very well.
Figure 4.
The osmotic coefficient results for Li (left top panel), Na (right top panel), K (left bottom panel), and Rb (right bottom panel) halides. Our calculations are presented by lines and experimental data by symbols. From top to bottom: I, Br, and Cl salts.
C For Cs+ salts, the trend is reversed
Finally for the caesium halide salts, the ordering with respect to the anion size is reversed. Here the hydration (osmotic coefficient) increases in order CsI < CsBr < CsCl, that is oppositely to the increase of the crystal diameter, similarly as we found before for alkali halides with a common anion (cf. Fig. 2 and 3). The ordering is now proportional to the size of “solvated” ions again. In the literature, this is called “water structure enforced ion pairing”.43 Our model correctly captures this subtle effect.
Ordering of the osmotic coefficient values as seen in Fig. 4 is a consequence of the fact that the cations of these salts have larger affinity for water than the partner anions (cf. Fig. 1). The trend is reversed for caesium salts (Fig. 5), because in this case the anions (chloride, bromide and iodide) have higher (or approximately equal) affinity for water than caesium ion. It is not clear that continuum solvent models could predict the complete set of osmotic data for the alkaline halides.
D The law of matching water affinities
Our results described above are consistent with Collins’ principle of “matching water affinities”.10,12 The principle has its origin in an experimental observation of a “volcano relationship” when standard free energy of solution is plotted as a function of the difference between the free energies of hydration of the corresponding ions (see also ref. 44 and the references therein). In short, the cation and anion having equal hydration free energies are having high free energy of solution, which means that such a salt is not very soluble. In contrast to this, the pair of oppositely charged ions with largely different solvation free energies is highly soluble.
In our treatment, a combination of a large anion (such as iodine, a chaotrope) and a small cation (lithium, a kosmotrope) gives low vapour pressure (high osmotic coefficient) since one of the ions is strongly hydrated. On the other hand, the osmotic coefficient of CsI, where both ions are large, is the lowest among all the salts shown in the figures above. This salt is weakly hydrated and such a solution has a high water vapour pressure. Our simple model correctly accounts for these effects.
V. Conclusions
We propose a Hamiltonian approach to analyze the osmotic properties of alkaline halides in water. The modeling of our electrolyte solution is rather simple, but in distinction with many other studies, the water is treated on equal footing with ions. The water molecule is modeled as a hard sphere with four off-center square-well sites. These sites serve to bind either another water molecule or to coordinate (solvate) to an ion. The ions are represented as charged hard spheres with their crystal size diameters, but with an ability to bind water through discrete attractive sites. We proceed by postulating two basic assumptions: (i) the strength of the ion site–water attraction depends on the size of the ion, and (ii) the number of available attractive sites on an ion is proportional to its surface area. These assumptions, with small additional correction to account for the dielectric saturation of waters between the ions, form the model of electrolyte solution studied here.
To test an appealing idea that the thermodynamic behavior of aqueous alkali halide solutions is approximately governed by the crystal size of interacting ions, we utilized the previously developed associative mean spherical integral equation approach. The theory is able to reproduce correctly the non-trivial ionic size dependence of the osmotic coefficient. We show that ionic sizes (crystal diameters) are responsible for the main features of the thermodynamic behavior of alkali halides in water. The ions we found difficult to model accurately are Na+ and F−, the latter of which is a strong kosmotrope. F− ion (not included in the analysis shown here) seems to interact with water more strongly than proposed by our simple model. Our model correctly predicts that salts containing one small and one large ion are highly hydrated (high osmotic coefficient). One such example is LiI in Fig. 4. On the other hand, two large ions (see CsI in Fig. 5) form a salt which is only weakly hydrated and yields low osmotic coefficient.Water molecules avoid the spaces between large ions, giving a higher water vapour pressure.
In short, we find the aqueous solvation of electrolytes to exhibit rich physical behavior. We believe this may be important in biology and for improving the solvation models in computer simulations.
Acknowledgements
The study was supported by Slovenian Research Agency fund (Programm 0103–0201), by the NIH research Grant (GM063592) and by the Ukraine–Slovenia bilateral research Grant. V. V. is Adjunct Professor at University of California Department of Pharmaceutical Chemistry.
References
- 1.Harned SH, Owen BB. The Physical Chemistry of Electrolyte Solutions. New York: Reinhold; 1958. [Google Scholar]
- 2.Conway BE. Ionic Hydration in Chemistry and Biophysics. Amsterdam: Elsevier; 1981. [Google Scholar]
- 3.Robinson RA, Stokes RH. Electrolyte Solutions. 2nd edn. New York: Mineola, Dover Publications; 2002. [Google Scholar]
- 4.Pitzer KS. J. Phys. Chem. 1973;77:268. [Google Scholar]
- 5.Pitzer KS, Mayorga G. J. Phys. Chem. 1973;77:2300. [Google Scholar]
- 6.Loehe JR, Donohue MD. AIChE J. 1997;43:180. [Google Scholar]
- 7.Barthel JMG, Krienke H, Kunz W. Physical Chemistry of Electrolyte Solutions. Modern Aspects. In: Baumgärtel H, Franck EU, Grünbein W, editors. Topics in Physical Chemistry. Vol. 5. New York: Springer; 1998. [Google Scholar]
- 8.Marcus Y, Hefter G. Chem. Rev. 2006;106:4585. doi: 10.1021/cr040087x. [DOI] [PubMed] [Google Scholar]
- 9.Marcus Y. Chem. Rev. 2009;109:1346. doi: 10.1021/cr8003828. [DOI] [PubMed] [Google Scholar]
- 10.Collins KD. Biophys. J. 1997;72:65. doi: 10.1016/S0006-3495(97)78647-8. [DOI] [PMC free article] [PubMed] [Google Scholar]
- 11.Lyklema J. Adv. Colloid Interface Sci. 2003;100–102:1. [Google Scholar]
- 12.Collins KD, Neilson GW, Enderby JE. Biophys. Chem. 2007;128:95. doi: 10.1016/j.bpc.2007.03.009. [DOI] [PubMed] [Google Scholar]
- 13.Kunz W. Curr. Opin. Colloid Interface Sci. 2010;15:34. doi: 10.1016/j.cocis.2009.06.002. [DOI] [PMC free article] [PubMed] [Google Scholar]
- 14.Kunz W, editor. Specific Ion Effects. Singapore: World Scientific Publishing; 2010. pp. 9–11. [Google Scholar]
- 15.Gavryushov S, Linse P. J. Phys. Chem. B. 2006;110:10878. doi: 10.1021/jp056871i. [DOI] [PubMed] [Google Scholar]
- 16.Gavryushov S. J. Phys. Chem. B. 2006;110:10888. doi: 10.1021/jp056872a. [DOI] [PubMed] [Google Scholar]
- 17.Hess B, Holm C, van der Vegt N. J. Chem. Phys. 2006;124:164509. doi: 10.1063/1.2185105. [DOI] [PubMed] [Google Scholar]
- 18.Lenart PJ, Jusufi A, Panagiotopoulos AZ. J. Chem. Phys. 2007;126:044509. doi: 10.1063/1.2431169. [DOI] [PubMed] [Google Scholar]
- 19.Abbas Z, Ahlberg E, Nordholm S. Fluid Phase Equilib. 2007;260:233. [Google Scholar]
- 20.Abbas Z, Ahlberg E, Nordholm S. J. Phys. Chem. B. 2009;113:5905. doi: 10.1021/jp808427f. [DOI] [PubMed] [Google Scholar]
- 21.Kalcher I, Dzubiella J. J. Chem. Phys. 2009;130:134507. doi: 10.1063/1.3097530. [DOI] [PubMed] [Google Scholar]
- 22.Krienke H, Vlachy V, Ahn-Erchan G, Bako I. J. Phys. Chem. B. 2009;113:4360. doi: 10.1021/jp8079588. [DOI] [PubMed] [Google Scholar]
- 23.Fennell CJ, Bizjak A, Vlachy V, Dill KA. J. Phys. Chem. B. 2009;113:6782. doi: 10.1021/jp809782z. [DOI] [PMC free article] [PubMed] [Google Scholar]
- 24.Fennell CJ, Bizjak A, Vlachy V, Dill KA, Sarupria S, Rajamani S, Garde S. J. Phys. Chem. B. 2009;113:14837. [Google Scholar]
- 25.Vrbka L, Lund M, Kalcher I, Dzubiella J, Netz RR, Kunz W. J. Chem. Phys. 2009;131:154109. doi: 10.1063/1.3248218. [DOI] [PubMed] [Google Scholar]
- 26.Lewis GN, Randall M. In: Thermodynamics. 2nd edn. Pitzer KS, Brewer L, editors. N.Y.: McGraw Hill; 1961. p. 321. [Google Scholar]
- 27.Lobo VMM. Handbook of Electrolyte Solutions (Part A and B) Amsterdam: Elsevier; 1989. [Google Scholar]
- 28.Pauling L. The Nature of Chemical Bond. Ithaca, New York: Cornell Univ. Press; 1960. [Google Scholar]
- 29.Robinson RA, Harned HS. Chem. Rev. 1941;28:419. [Google Scholar]
- 30.Kalyuzhnyi Yu. V, Vlachy V, Cummings PT. Chem. Phys. Lett. 2007;438:238. [Google Scholar]
- 31.Kolafa J, Nezbeda I. Mol. Phys. 1987;61:161. [Google Scholar]
- 32.Nezbeda I, Kolafa J, Kalyuzhnyi Yu. V. Mol. Phys. 1989;68:143. [Google Scholar]
- 33.Kalyuzhnyi Yu. V, Cummings PT. J. Chem. Phys. 2003;118:6437. [Google Scholar]
- 34.Bockris JO’M, Reddy AKN. Modern Electrochemistry. Vol. 1. New York: Plenum; 1970. p. 48. [Google Scholar]
- 35.Lamoureux G, Roux B. J. Phys. Chem. B. 2006;110:3308. doi: 10.1021/jp056043p. [DOI] [PubMed] [Google Scholar]
- 36.Holovko MF, Kalyuzhnyi Yu. V. Mol. Phys. 1991;73:1145. [Google Scholar]
- 37.Kalyuzhnyi Yu. V, Stell G. Chem. Phys. Lett. 1995;240:157. [Google Scholar]
- 38.Protsykevytch IA, Kalyuzhnyi Yu. V, Holovko MF, Blum L. J. Mol. Liq. 1997;73–74:1. [Google Scholar]
- 39.Kalyuzhnyi Yu. V, Cummings PT. J. Chem. Phys. 2001;115:540. [Google Scholar]
- 40.Hlushak SP, Kalyuzhnyi Yu. V. J. Phys. Studies. 2007;11:165. [Google Scholar]
- 41.Wertheim MS. J. Stat. Phys. 1986;42:459. [Google Scholar]
- 42.Jackson G, Chapman WG, Gubbins KE. Mol. Phys. 1988;65:1. [Google Scholar]
- 43.Diamond RM. J. Phys. Chem. 1963;67:2513. [Google Scholar]
- 44.Conway BE. J. Solution Chem. 1977;6:23. [Google Scholar]


