Abstract
The glass transition temperature Tg of biopreservative formulations is important for predicting the longterm storage of biological specimens. As a complementary tool to thermal analysis techniques, which are the mainstay for determining Tg, molecular dynamics simulations have been successfully applied to predict the Tg of several protectants and their mixtures with water. These molecular analyses, however, rarely focused on the glass transition behavior of aqueous trehalose solutions, a subject that has attracted wide scientific attention via experimental approaches. Important behavior, such as hydrogen-bonding dynamics and self-aggregation has yet to be explored in detail, particularly below, or in the vicinity of, Tg. Using molecular dynamics simulations of several dynamic and thermodynamic properties, this study reproduced the supplemented phase diagram of trehalose-water mixtures (i.e., Tg as a function of the solution composition) based on experimental data. The structure and dynamics of the hydrogen-bonding network in the trehalose-water systems were also analyzed. The hydrogen-bonding lifetime was determined to be an order of magnitude higher in the glassy state than in the liquid state, while the constitution of the hydrogen-bonding network exhibited no noticeable change through the glass transition. It was also found that trehalose molecules preferred to form small, scattered clusters above Tg, but self-aggregation was substantially increased below Tg. The average cluster size in the glassy state was observed to be dependent on the trehalose concentration. Our findings provided insights into the glass transition characteristics of aqueous trehalose solutions as they relate to biopreservation.
Introduction
Vitrification is a frequently-used approach to realize the goals of long-term preservation of living cells and tissues at either cryogenic or room temperatures (i.e., cryopreservation and dry preservation). The vitrified or glassy state is a metastable supercooled or supersaturated state characterized by very low molecular mobility.1 In most cases, additives such as sugars and biocompatible polymers (e.g., hydroxyethyl starch)are added into the protective media to increase the glass transition temperature (Tg) of the final composition and reduce the plasticizing effect of water.2-4 Among these additives, trehalose is recognized as one of the most versatile glass formers for biopreservation purposes.3, 5-7 Trehalose can associate with and stabilize proteins and lipid membranes according to the “water replacement” hypothesis,6, 8 thus providing it an extra advantage over polymers that have a higher Tg.
The successful practice of vitrification for preservation purposes requires a careful selection of glass formers and cooling rates, and the composition Tg is one of the most important elements needed to guide this selection.9 Currently the most feasible method for determining Tg is to use experimental techniques, especially differential scanning calorimetry (DSC).1, 3, 4, 10-13 The experimental approach, however, has drawbacks. As seen in the literature review by Chen et al.,7 there is a paucity of Tg data reported for dilute aqueous trehalose solutions, and the values can range considerably depending on sample processing conditions. As the main Tg data source for trehalose, the DSC study by Miller et al3 was restricted to trehalose concentrations above 60 wt%. This was mainly because progressively higher cooling rates are required to vitrify samples as the water content increases, thus straining the limits of conventional thermal analysis equipment. Most importantly, thermal analysis, as a macroscopic technique, provides limited insight into the underlying dynamic and thermodynamic characteristics associated with the glass transition.
Molecular dynamics (MD) simulation have proven to be capable of predicting the Tg of solutions of various concentrations, while enabling the molecular characteristics to be probed in the vicinity of this transition. However, it should be noted that the accuracy of Tg-prediction by MD simulation varies with the simulation method and the dynamic and thermodynamic properties being analyzed. Caffarena and Grigera14 computed the Tg of pure glucose from its density profile with T and obtained Tg =301 K, which was in good agreement with the experimental values (304-312 K). They were also able to obtain a Tg value of 331 K from the hydrogen-bonding (H-bonding) characteristics. Further, Caffarena and Grigera15 extended their prior methodology to aqueous solutions of glucose covering a wide concentration range. They reproduced the plot of Tg versus the solution composition based on the self-diffusion coefficient of water molecules (Dw), yielding a maximum error of 30 K compared to the experimental values. Molecular investigation was also conducted to examine the Tg of freeze-dried formulations containing polymer excipients, even though a relatively large overestimate was observed because of the very fast cooling rates in the simulation.16 A comparative study between DSC and MD simulation was undertaken to estimate Tg of pure glucose, sucrose and trehalose based on the change of the specific volume (v) with T. As expected, the MD simulation results were 12-34 K higher than the experimental ones.17 Specific volume was also employed to reasonably identify Tg of myo- and neo-inositol and amorphous polymers such as polyisobutylene.18, 19
Although prior studies have predicted the Tg of pure trehalose via MD simulations,17, 20 few have probed the dynamic and thermodynamic properties associated with the glass transition of amorphous trehalose-water mixtures, which has much more relevance for biopreservation purposes. Information about the diffusivity, specific heat capacity (CP), H-bonding dynamics in trehalose-water mixtures at sub-Tg temperatures are largely still unavailable in the literature. The utility of multiple properties (other than Dw and v) to characterize Tg, with a potentially higher accuracy, has not been examined thus far. In addition, although the heterogeneity of sugar solutions of certain concentrations have been examined at room temperature,21, 22 their self-association characteristics in the non-equilibrium state (i.e., glassy state) is still unknown.
In this study MD simulations were conducted on aqueous trehalose solutions covering the entire composition range (0~100 wt%). We identified the Tg of pure water, pure trehalose and their mixtures based on various indicators including Dw, the self-diffusion coefficient of trehalose molecules (Dtre) and CP. The supplemented phase diagram Tg as a function of xtre (the mass fraction of trehalose) was reproduced, which fell within the range of experimental results in the literature. Next, the percentages of different types of H-bonds and their lifetime profiles at sub-and super-Tg temperatures were statistically calculated. Finally, the self-aggregation of trehalose molecules was analyzed at temperatures below, in the vicinity of, and above Tg.
Computational methods
Simulation details
All simulations in this study were conducted by using the MD simulation package NAMD.23 The all-atom CHARMM36 force field for α-α trehalose24 and the modified TIP3P water model25 were employed. The compositions of the trehalose-water systems that were simulated are shown in Table 1. The MD simulations were divided into three consecutive parts. In the minimization part, each simulation system was minimized for 50 ps and then run for an additional 50 ps with a NVT ensemble where temperature T (i.e., 370 K for aqueous solutions and pure water and 530 K for melted pure trehalose), volume V, and the number of molecules N were fixed. Prior experiments indicated that trehalose was soluble in water up to 76.9 wt% at 353 K.3 Therefore, the concentration range in this study is speculated to be under the solubility limit at 370 K. In the equilibration portion of the simulation, each system was run for 5 ns to reach a fully solvated or melted state with a NPT ensemble where T (same as above), pressure P and N were fixed. Finally, in the production run (also with a NPT ensemble), each system was quenched to 70 K (for aqueous solutions and pure water) or 230 K (for pure trehalose) after a 600 ps equilibration run at 370 or 530 K. Afterwards, the simulation system was annealed to 370 or 530 K in a stepwise way (a 20 K increase each step and an equilibration run of 600 ps at each step). As a whole, the MD production run mimicked a DSC protocol for measuring Tg except that the cooling and heating rates in the simulation were many orders of magnitude higher than those that can be achieved experimentally. In order to allow direct comparisons, our simulations employed a cooling rate qc of 1.5 × 10¹⁷ K/s and a heating rate qh of 3.125 × 10¹⁰ K/s consistent with rates used in other modeling efforts in the literature.16, 26, 27 Other parameters related to the simulation procedures are the same as those reported in the previous study.28
Table 1.
The compositions of the trehalose-water systems in the MD simulations
| Ntre | Nw | m (mol/kg) | xtre (wt%) |
|---|---|---|---|
| 0 | 1698 | 0 | 0 |
| 32 | 2642 | 0.67 | 18.7 |
| 32 | 1437 | 1.24 | 29.7 |
| 75 | 1698 | 2.45 | 45.6 |
| 75 | 1211 | 3.44 | 54.1 |
| 108 | 1211 | 4.95 | 62.9 |
| 108 | 826 | 7.26 | 71.3 |
| 108 | 673 | 8.91 | 75.3 |
| 108 | 526 | 11.39 | 79.6 |
| 125 | 0 | N/A | 100 |
Specific heat capacity
The specific heat capacity at constant pressure CP(T, P) can be calculated with the following equation (Ref. 29 as cited in Ref. 30).
| (1) |
where 〈h〉 denotes the average value of the molar enthalpy h over the trajectories.
One can obtain the enthalpy H by Eq. (2),29
| (2) |
where Eint includes all intramolecular bonded terms (i.e., bond stretching, angle bending, dihedral torsion and improper dihedral torsion),31 Enb are all intermolecular and intramolecular non-bonded terms (i.e., Lennard-Jones and Coulombic potentials), and Ekinetic is the kinetic energy.30 Each of these energy terms can be statistically calculated from the MD simulation results.
As explained by Cadena et al.,30 H can be split into an ideal gas component, Hid , and a residual component, Hres. The authors indicated that it was more common for the residual contribution, Hres, to be calculated from a classical simulation while the ideal gas contribution, Hid, to be obtained from experiment. Since experimental ideal gas heat capacities for trehalose-water mixtures are not available, we used MD simulation results to calculate Hid and they still produced good estimates for CP as discussed later. The mean value of CP was obtained based on 10 different selections at each temperature, each of which lasted 300 ps from the trajectory of the simulation.
Self-diffusion coefficient
The self-diffusion coefficients of water and trehalose molecules in the mixtures at various temperatures can be calculated from the long-time limit of the mean-square displacement (MSD) by Eq. (3).32
| (3) |
where r(t) is the position of the oxygen atom (O) of the water molecule or the O atom in the glycoside bond of the trehalose molecule at time t.
Hydrogen-bonding
The H-bonds in the trehalose-water mixtures were identified via the geometric criteria. It should be noted that only strong H-bonds between O atoms were considered in this study. A certain aggregate between two O atoms can be regarded as an H-bond only if the distance between them does not exceed 3.4 Å and the angle ∠O-H⋯O is greater than 120°.20
The dynamics of the H-bonding network in the mixture was studied by examining the lifetime of H-bonds. The H-bond time correlation function CHB(t) for the pairs i and j is defined as:
| (4) |
where hij(t) equals to 1 if the O atom i is hydrogen bonded with O atom j at 0 and t and the bond has not been broken in the meantime for a period longer than t*.33 Thus, two extreme cases from this definition give the continuous H-bond time correlation function CHBC (t) (when t*=0) and the intermittent H-bond time correlation function CHBI (t) (when t *=∞). Theoretically, CHBC (t) (when t*=0) requires a time step of 0 fs/step which is impossible in the practice of MD simulation. The trajectory was recorded every 0.2 ps in our simulation so that we calculated an approximate CHBC (t) based on t*=0.2 ps.
The H-bond lifetime τHBC(I) is obtained from the following equation:33
| (5) |
Results and discussion
Determining Tg from CP(T)
The glass transition is a second-order thermodynamic transition in which a discontinuity of the second-order properties exists, such as the step change of the thermal expansion or heat capacity.34 The rationale for determining Tg via DSC experiments is to identify the step change of CP with increasing T and define the midpoint temperature of the step change as Tg. One of the purposes of this study is to clarify the possibility and accuracy of predicting Tg from CP(T) by MD simulations, which has not yet been elucidated thus far.
The CP values of trehalose-water mixtures at different concentrations and temperatures have been statistically calculated by using Eqs. (1) and (2). Figure 1 displays the step changes of CP for mixtures of 0, 18.7, 45.6 and 62.9 wt% trehalose. One can observe that there are three distinctive stages. As seen in Figure 1(b), for example, the trehalose-water mixture maintains a glassy state until 141.1 K, which is called the pre-transition stage. As the temperature continues to rise, the glass melts into a “liquid-like” rubbery state which characterizes the glass transition region. In this stage, the CP value exhibits a steep increase. When T rises above 181.3 K, the mixture reaches its post-transition stage where it exists in a liquid state. The trends of CP(T) in Figure 1 are consistent with the typical DSC endothermic event characterizing the glass transition.35, 36 We drew three straight lines to best-fit the data points in these three stages, respectively. In detail, we first drew a best-fit line through the step change of CP (typically, using 3-5 data points within the steep increase). Then, we selected several data points not in the vicinity of the steep change from the two extremes and obtained the other two best-fit lines. The intersections of these best-fit lines enable us to define Tg as the temperature corresponding to the midpoint of the CP step change, in the same manner in which DSC data is interpreted. Following this principle, the Tg of the trehalose-water mixture of 18.7 wt%, for example, is 161.2 K, only a 8.3% difference with the estimated value of the Gordon-Taylor fit in the review by Chen et al.7 Because the temperature range of the glass transition region was shifted towards the high end with increasing concentration, there were not enough data points to enable reasonable best-fits to be established in the post-transition stage for mixtures over 70 wt%. However, the data remained consistent with the trend of increasing Tg with concentration, and the higher concentration values (Tg=~228-241 K for 71-80 wt%) appeared to be close to the expected range (~215-239 K).7 These ambiguous Tg values can be determined by extending the temperature range in future work.
Figure 1.
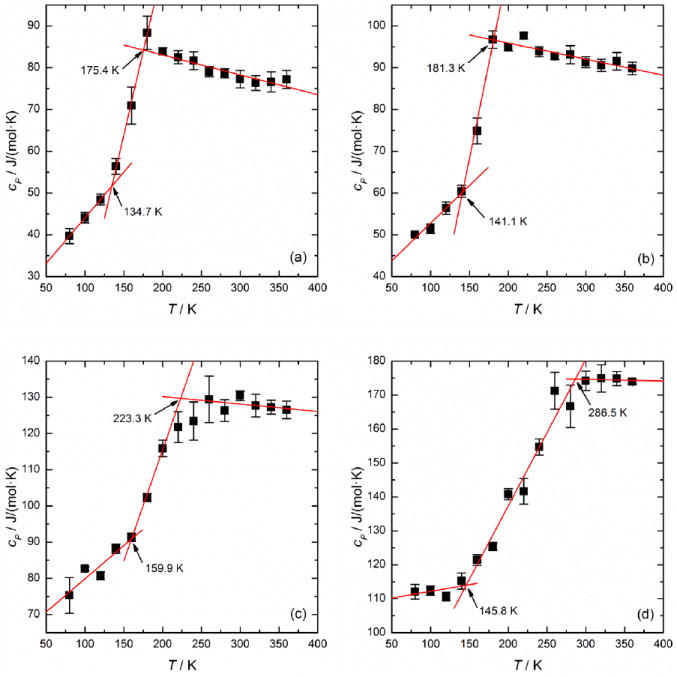
The step changes of Cp with increasing T during the glass transition of amorphous trehalose-water mixtures of (a) 0 wt%, (b) 18.7 wt%, (c) 45.6 wt% and (d) 62.9 wt% trehalose
The heat capacity and temperature variations through the glass transition region, ΔCp and ΔT, respectively, were determined and listed in Table 2. It can be observed that as the solution becomes more concentrated (from 0 to 62.9 wt%) the step change ΔCp increases from 32.77 to 60.80 J/(mol·K) and the corresponding temperature range is broadened from 40.7 to 140.7 K. It was found that ΔCp and ΔT were linearly correlated (R2=0.9675). This effect is likely related to the strength of the interparticle interactions, but it is still unclear as to why some glass-formers tend to have a sharp glass transition while others have a broad transition range.37 Angell37 proposed that this phenomenon was largely related to the fragility of the glass-formers but could also be affected by other relaxation characteristics. It was observed that the Cp values in the supercooled liquid state (above Tg) yielded an ‘overshoot’ region and then leveled off (e.g., after 300 K in Figure 1(a) and after ~275 K in Figure 1(b)). The overshoot of Cp around Tg is found to be composition-dependent rather than scanning rate-controlled since the overshoot diminishes as the concentration increases (e.g., Figures 1(c) and (d)) within the same cooling/heating protocol. The overshoot of Cp at Tg, has also been observed for supercooled pure water. For example, Rice et al.38 reported that the Cp of supercooled water increased as the T dropped up to 233 K. The same phenomenon was also observed in the simulation work by Giovambattista et al.27 The equilibrium relaxation time of the pure water system at T >240 K was found to be less than 20 ps and to be smaller than the characteristic scan time 1 K/ qh (=32 ps) in our study. As a result, the Cp of melted amorphous water after Tg can reach the equilibrium value of supercooled water and follow the shape of Cp(T) of supercooled water, thereby decreasing with a rising T after Tg. But, as the trehalose concentration increases, the partial Cp attributed to water decreases and the overshoot of Cp around Tg is less noticeable. The same trend was also observed for aqueous Mg(OAc)2 solutions.39
Table 2.
The heat capacity and temperature variations ΔCp and ΔT through the glass transition region of trehalose/water mixtures (0-62.9 wt% trehalose)
| xtre (wt%) | ΔCp (J/(mol·K)) | ΔT (K) |
|---|---|---|
| 0 | 32.77 | 40.7 |
| 18.7 | 36.47 | 40.2 |
| 29.7 | 37.97 | 55.9 |
| 45.6 | 39.48 | 63.4 |
| 54.1 | 55.09 | 134.8 |
| 62.9 | 60.80 | 140.7 |
Unlike Dw and Dtre, which will be discussed later, the statistical calculation of CP yields relatively large error bars at several temperatures. This is mainly because the ideal gas component, Hid, calculated from classical simulations is less accurate than that obtained from experiments, as mentioned earlier. However, the statistical calculation of CP in our study should still be reasonably accurate due to a large sampling practice and a relatively long period of equilibration. The CP of pure water at 300 K is estimated to be 77.2 J/(mol·K) here, only a 2.5% difference from the reference value of 75.3 J/(mol·K) at 298 K.40
Figure 2 illustrates the changes of energetic derivatives with T for the mixture of 18.7 wt% trehalose, a breakdown of the contributions of various energetic derivatives to the CP step change. ∂ekinetic/∂T showed no noticeable change during the glass transition and the Van der Waals interactions ∂eVdW/∂T exhibited a slight step decrease through the glass transition. It is evident that the major contributor to the step change of CP is ∂eelect/∂T as it follows a similar trend as CP(T).
Figure 2.
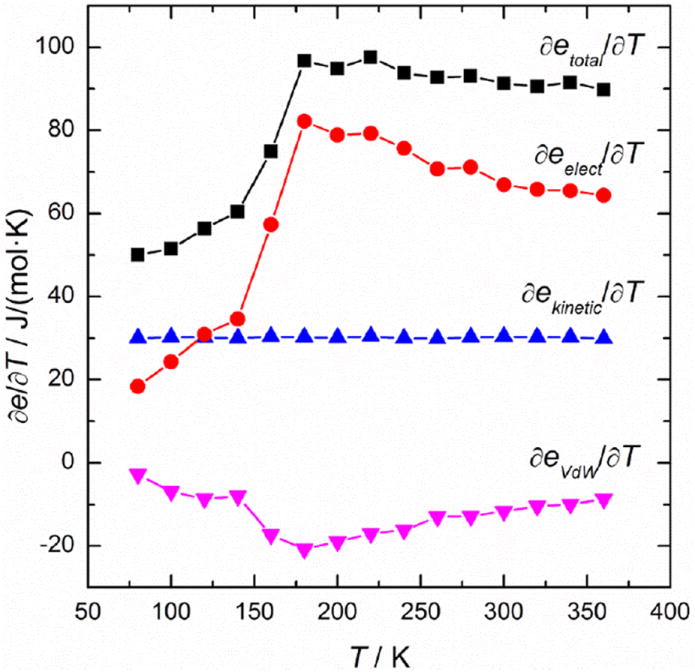
Energy derivatives ∂e/∂T for the enthalpy etotal, Coulombic potential eselect, Van der Waals potential eVdW and kinetic energy ekinetic, respectively, as a function of T through the glass transition of the amorphous 18.7 wt% trehalose-water mixture.
Determining Tg from Dw(T) and Dtre(T)
Molecular mobility is a key indicator of the glassy state. Thus, Dw is often examined to determine the Tg of aqueous solutions in MD simulations with varying degrees of accuracy, even though it is known that the water mobility can decouple from the sugar mobility above Tg (i.e., water molecules begin to penetrate the matrix that is formed by the low-mobility molecules).15, 16, 26 Figure 3(a) displays the change of Dw as a function of T for mixtures of 0, 29.7, 54.1, and 79.6 wt% trehalose. As expected, at a given temperature, dilute trehalose solution will have a higher Dw than a more concentrated composition. This is mainly due to the increased restriction of water molecules by trehalose molecules in the more concentrated solution, which will be further discussed in the H-bonding characteristics section.
Figure 3.
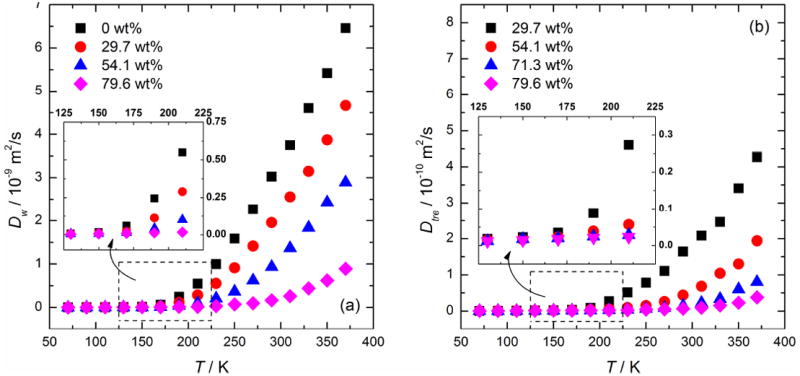
(a) The self-diffusion coefficient of water molecules Dw as a function of T in the trehalose-water mixtures. (b) The self-diffusion coefficient of trehalose molecules Dtre as a function of T in these mixtures. Enlarged scales of 125-225 K are shown in the inset graphs.
The Dw profile is presented in a logarithmic form as shown in Figure 4 by assuming that the self-diffusion coefficient D in the liquid and glassy states follows the Arrhenius equation given by Eq. (6).
| (6) |
where A is the pre-exponential factor, Ea is the activation energy and R is the universal gas constant. It is recognized that D might follow a non-Arrhenius behavior (e.g., the Vogel-Fulcher-Tammann function) through the glass transition. The Arrhenius equation was used here for simplicity as the difference of Tg-prediction between Arrhenius and VFT fits was found to be minimal. Two best-fit lines were drawn from the two extremes (i.e., the first 5 data points and the last 3 points as 1/T rises) by avoiding the ambiguous transition region and Tg was defined as the temperature corresponding to the intersection point of these two lines.
Figure 4.
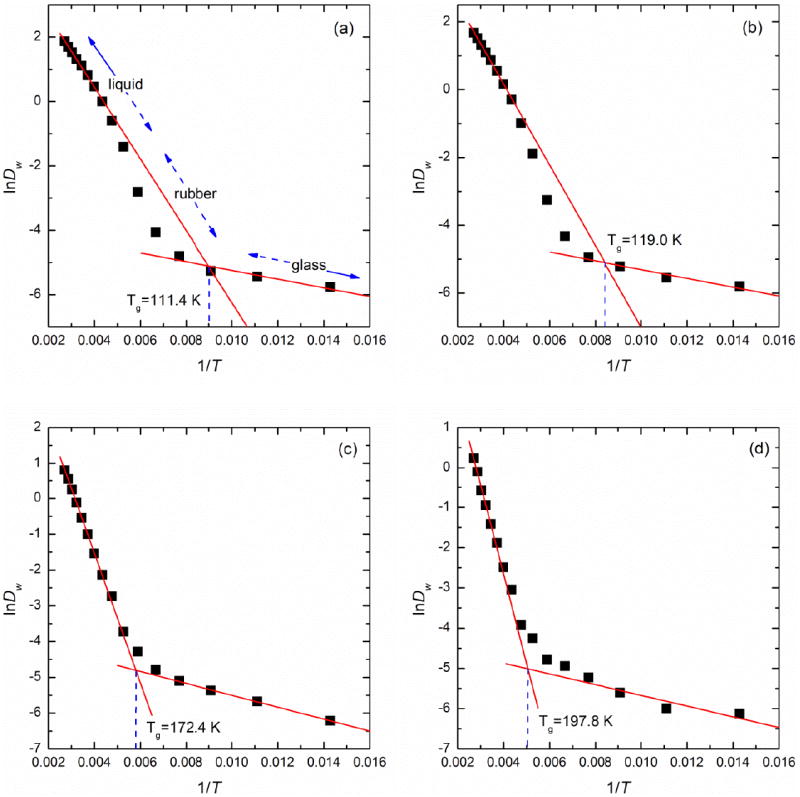
Plots of InDw versus 1/T through the glass transition of amorphous trehalose-water mixtures of (a) 0 wt%, (b) 18.7 wt%, (c) 62.9 wt% and (d) 75.3 wt% trehalose
We also determined the glass transition temperature from the diffusion characteristics of trehalose. Figure 3(b) displays the change of Dtre as a function of T during the annealing MD simulation. As the mixture became more concentrated, the mobility of trehalose molecules decreased sharply as was also observed in the case of water diffusivity. For example, a highly concentrated solution of 79.6 wt% produces a Dtre of 0.067×10⁻¹⁰ m2/s at 290 K while a relatively dilute solution of 29.7 wt% gives a Dtre of 1.645×10⁻¹⁰ m2/s at the same temperature, nearly a 25-fold increase. According to Eq. (6), we plotted InDtre versus 1/T in Figure 5. The best-fit lines were drawn from the two extremes as previously described for InDw as a function of 1/T data. The corresponding Tg determined on the basis of this data are shown in Figure 5 and included in Figure 6 as well.
Figure 5.
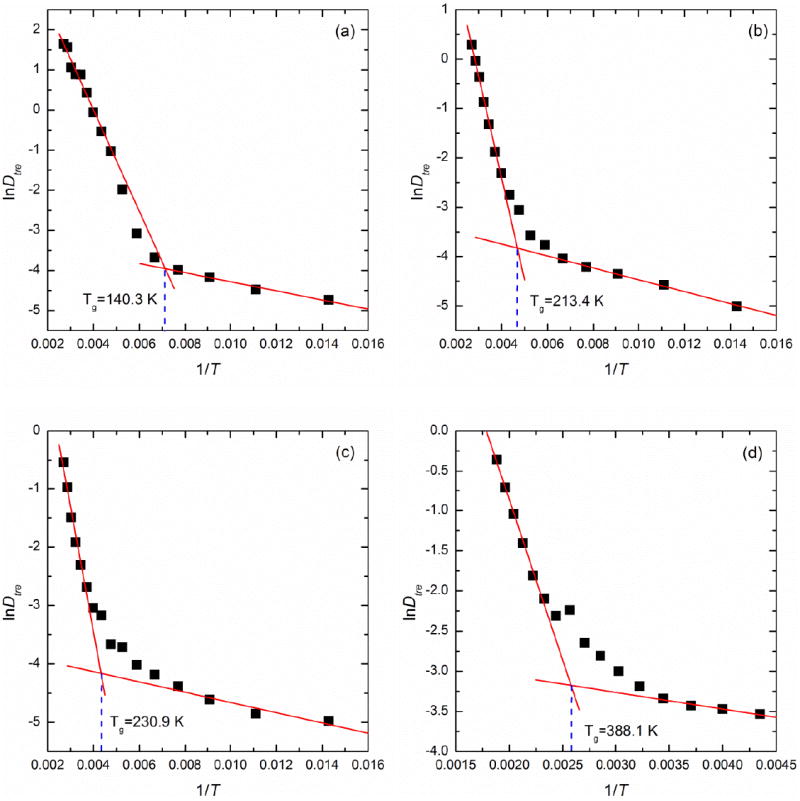
Plots of InDtre versus 1/T through the glass transition of amorphous trehalose-water mixtures of (a) 18.7 wt%, (b) 62.9 wt%, (c) 75.3 wt% and (d) 100 wt% trehalose
Figure 6.
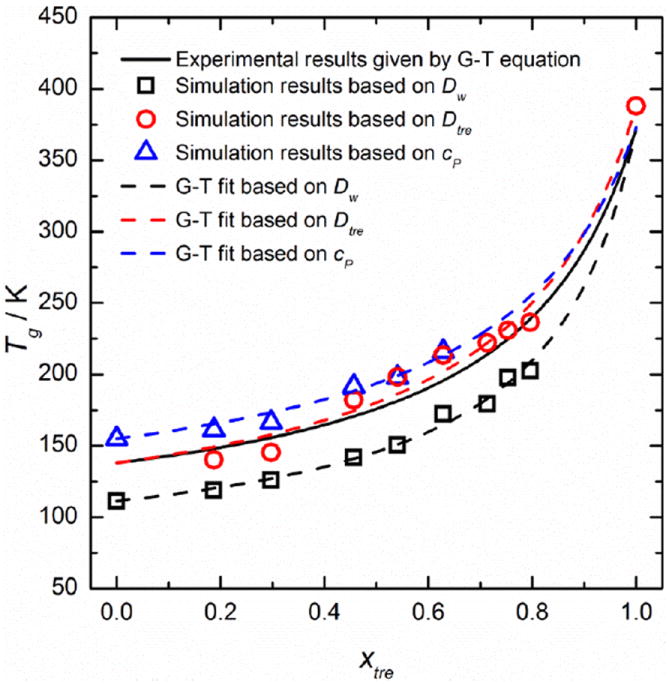
The supplemented phase diagram Tg (xtre) of trehalose-water mixtures
In the intermediate region, as seen in Figures 4 and 5, the material can be described as being in a rubbery state.41 Depending on the concentration, InD in the rubbery state has the possibility to negatively depart from the curve fit for the liquidus state which, more specifically, corresponds to the extended supercooled liquidus state. In dilute solutions, the molecular mobility in the rubbery state begins to be substantially suppressed compared to that in the liquidus state. Therefore, one can observe in Figures 4 (a) and (b) and Figure 5(a) the value of InD is smaller than the corresponding value on the extended supercooled liquidus curve. However, as the solution becomes more concentrated and undoubtedly more viscous, the difference of Dw or Dtre between the rubbery and supercooled liquidus states is reduced, yielding no negative departure from the extended supercooled liquidus curve as seen in Figures 4(c) and (d) and Figures 5(b)-(d).
One can notice that Dtre is generally an order of magnitude smaller than Dw at a given temperature and concentration, which is consistent with experimental results based on NMR.42, 43 Even though there are no experimental data for exactly the same compositions as this study, an approximate comparison reveals the accuracy of our simulation results for Dtre and Dw. The simulation results of Dtre for the 45.6 wt% solution in our study is 1.17×10⁻¹⁰ m2/s at 310 K which is within the range of 0.708×10⁻¹⁰ m2/s at 303 K and 1.51×10⁻¹⁰ m2/s at 323 K based on the experimental results of a 44 wt% trehalose solution.38 Moreover, in the 29.7 wt% solution of this study, Dtre=1.65×10⁻¹⁰ m2/s at 290 K and 2.46×10⁻¹⁰ m2/s at 330 K, reasonably close to the experimental values of 30 wt%: 1.41×10⁻¹⁰ m2/s at 298 K and 3.04×10⁻¹⁰ m2/s at 323 K, respectively.43 With regard to water diffusivity, Dw of pure water has been experimentally determined to be 6.46×10⁻⁹ m2/s at 358 K and the simulation result yielded a value of 5.42×10⁻⁹ m2/s at 350 K. In the 29.7 wt% solution, Dw=3.14×10⁻⁹ m2/s at 330 K and 3.87×10⁻⁹ m2/s at 350 K, close to the experimental values of 30 wt%: 3.24×10⁻⁹ m2/s at 323 K and 4.23×10⁻⁹ m2/s at 353 K, respectively.43
It is worth mentioning that as widespread self-aggregation of trehalose molecules appears below Tg (as discussed later) the diffusion of water molecules would be confined to cavities formed by the trehalose clusters. In this inhomogeneous system, water molecules will stay in a given cavity only for a finite time and then will explore other ones. Since the diffusion coefficient will be different for different cavities, the time dependence of the mean-square displacement will only become linear at times long enough for the molecules to sample all cavities, and then its slope will give the diffusion coefficient averaged over all regions, rather than a regional or local value.44
Supplemented phase diagram of the trehalose-water binary mixtures
Figure 6 gives the final supplemented phase diagram of the trehalose-water mixtures Tg (xtre) based on different Tg identification approaches. This figure illustrates that the simulation results given by Dtre are consistent with the experimental values described by the Gordon-Taylor (G-T) equation (i.e., Eq. (7)).
| (7) |
where is the glass transition temperature of pure trehalose (373 K), is that of pure water (138 K) and k=5.2 is the fitting parameter.7 These values are consistent with the calorimetric results reported by Bellavia, et al.45 (k=4.9 with and ).
The maximum difference between experimental and simulation (based on Dtre) values is only 18 K, which is a significant improvement compared to other simulation work on aqueous solutions. Furthermore, MD simulation results based on Cp are reasonably consistent with the experimental values, yielding a maximum overestimate about 21 K. The MD simulation results of Tg based on Dw produce deviations of up to 30 K from a G-T fit to experimental data partly due to the decoupling of water mobility from the main matrix molecules (trehalose).We used Eq. (7) to fit the simulation results based on Dw, Dtre and Cp, respectively. or that was not given by the simulation results took the corresponding experimental value. The values of k obtained based on Dw, Dtre or CP are 6.6, 4.9 and 4.7, respectively, which are in reasonable agreement with the reference value of 5.2.
H-bonding characteristics
It was found in this study that the percentages of various types of H-bonds did not change noticeably as T – Tg increased (data not shown). In other words, the constitutions of the H-bonding networks in the liquidus, rubbery and glassy states are relatively the same for a given concentration. Figure 7 displays the constitutions of the H-bonding networks in the glassy states of 29.7, 62.9 and 79.6 wt% mixtures, respectively. It is evident that the concentration significantly affects the constitution of the H-bonding network.
Figure 7.
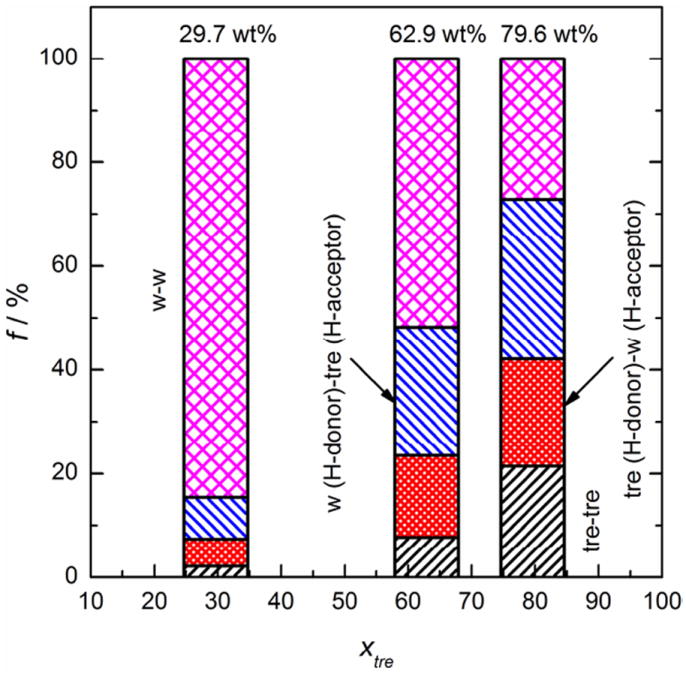
The constitutions of the H-bonding networks in amorphous trehalose-water mixtures of (a) 29.7 wt%, (b) 62.9 wt% and (c) 79.6 wt% trehalose at T=~0.45 Tg
As seen in Figure 7, the majority of H-bonds are formed between water molecules in solutions of 29.7 and 62.9 wt% trehalose. In the 29.7 wt% solution, w-w H-bonds account for over 80% of all H-bonds and the percentage is above 50% in the 62.9 wt% solution. As the concentration of trehalose increases, the predominance of w-w H-bonds decreases with a percentage of less than 30% in the most concentrated solution (79.6 wt%). The water molecules are more likely to be associated with trehalose via tre-w or w-tre H-bonds as the solution becomes more concentrated, resulting in a decrease in the percentage of w-w H-bonds. The percentage of H-bonds between trehalose molecules rises from nearly 2% (29.7 wt% solution) to around 8% (62.9 wt%) and ultimately over 20% (79.6 wt%) in the glassy state. In addition, it is observed that the percentage of H-bonds between trehalose (as H-donor) and water (as H-acceptor) molecules is slightly less than that of w-tre H-bonds. The w-tre H-bonds represent an average of 30% of all H-bonds in the amorphous 79.6 wt% mixture, even slightly higher than the percentage of w-w H-bonds.
Even though the H-bond percentages are nearly independent of T, Table 3 shows that the hydration number (i.e., the number of tre-w and w-tre H-bonds divided by the number of trehalose molecules) in the glassy state (90 K) is always higher than that in the liquid state (310 K). This is because the mobility of water and trehalose molecules is greatly restricted at sub- Tg temperatures but much less constrained at super-Tg temperatures. Similarly, the value of HBw–w/Nw (i.e., the number of w-w H-bonds divided by the number of water molecules) and HBtre–tre/Ntre (i.e., the number of tre-tre H-bonds divided by the number of trehalose molecules) at 90 K are also higher than those at 310 K. Lerbret et al.21 reported that hydration numbers of 33 wt% and 66 wt% trehalose solutions at 273 K were 13.0 and 8.1, respectively. With reasonable agreement, the results of 29.7 wt% and 62.9 wt% solutions at 270 K in this study are 13.24 and 10.78, respectively. In addition, the MD simulation by Lerbret et al.21 obtained HBtre–tre/Ntre =2.689 for 66 wt% trehalose at 293 K which well falls into the range of 2.09 (62.9 wt% at 310 K)-3.07 (79.6 wt% at 310 K) as shown in Table 3.
Table 3.
The characteristic numbers of H-bonds in pure water, pure trehalose and their mixtures of 62.9 and 79.6 wt% trehalose at cryogenic and room temperatures
| H-bonding characteristics | 0 wt% | 62.9 wt% | 79.6 wt% | 100 wt% | ||||
|---|---|---|---|---|---|---|---|---|
|
| ||||||||
| 90 K | 310 K | 90 K | 310 K | 90 K | 310 K | 250 K | 470 K | |
| HBw–w/Nw | 1.83 | 1.76 | 1.26 | 1.23 | 0.85 | 0.82 | N/A | N/A |
| Hydration # | N/A | N/A | 11.01 | 10.04 | 7.52 | 7.20 | N/A | N/A |
| HBtre–tre/Ntre | N/A | N/A | 2.10 | 2.09 | 3.16 | 3.07 | 5.32 | 4.68 |
We also statistically calculated the H-bond lifetimes as a measure of the dynamics of H-bonding at various temperatures and concentrations. Table 4 shows the continuous and intermittent H-bond lifetimes τHBC and τHBI of the 62.9 wt% trehalose solution at cryogenic and room temperatures. It is note worthy that the lifetime, either τHBC or τHBI, is dramatically shortened as the mixture goes from a glassy state to a liquidus one. Even in the glassy state, τHBC or τHBI in most cases tends to be smaller at a higher T. For example, τHBC is 26.08 ps at 70 K and 25.02 ps, slightly diminished, at 90 K. But the value dips to 4.31 ps at 290 K and 3.42 ps at 310 K, only 1/6 of the low-temperature values. τHBI of w-tre H-bonds is 27.72 ps at 70 K and 27.04 ps at 90 K, but decreases to 8.93 ps at 290 K and 6.69 ps at 310 K, about 1/3-1/4 of the low-temperature values. It is expected that the H-bonds between trehalose molecules have a longer lifetime than other types of H-bonds, especially w-w ones, partly due to the prevalence of –OH groups in the trehalose molecule. A longer lifetime of H-bonds in the glassy state should indicate a more stable H-bonding network and presumably a more stable amorphous matrix. The breaking and reconstructing of H-bonds above Tg can be attributed to the translational, cooperative movement of the entire water or trehalose molecule, which is also responsible for the primary or α-relaxation associated with the glass-to-liquid transition. But in the glassy state these bond changes are largely related to the local rearrangement or reorientation of the –OH groups in the trehalose molecule since the global motions of molecules are substantially restrained in a glass. It is known that the secondary or β-relaxation dynamics are largely due to intramolecular motions below Tg, such as the rotation or vibration of side chains in a polymer or the reorientation of a small group of atoms on a macromolecule.46 Given similar mechanisms, it is proposed that the extended H-bond lifetime in a glass could reflect the slower secondary relaxation dynamics.
Table 4.
The continuous and intermittent H-bond lifetimes τHBC and τHBI in the 62.9 wt% trehalose-water mixture at cryogenic and room temperatures
| H-bond (donor-acceptor) | τHBC (ps) | τHBI (ps) | ||||||
|---|---|---|---|---|---|---|---|---|
|
| ||||||||
| 70 K | 90 K | 290 K | 310 K | 70 K | 90 K | 290 K | 310 K | |
| tre-tre | 22.63 | 23.53 | 6.50 | 4.44 | 27.86 | 27.49 | 20.76 | 18.16 |
| tre-w | 26.08 | 25.02 | 4.31 | 3.42 | 28.68 | 28.40 | 14.70 | 11.59 |
| w-tre | 22.73 | 21.50 | 2.01 | 1.46 | 27.72 | 27.04 | 8.93 | 6.69 |
| w-w | 26.01 | 25.40 | 2.01 | 1.55 | 28.66 | 28.29 | 5.97 | 4.37 |
Self-aggregation of trehalose molecules
Many of the important questions in the physics of glassy materials have to do with spatial heterogeneities,47 and the spatial heterogeneity can, in part, be attributed to the self-aggregation behavior of molecules. The current MD simulation results suggest that the trehalose-water solution is highly heterogenous in the glassy state, with trehalose forming large clusters that exclude water. Figure 8 displays the probability (f) distributions of a trehalose molecule forming a n-body aggregation with other trehalose molecules in aqueous solutions of 45.6 and 54.1wt%trehalose at T below Tg (90 K), in the vicinity of Tg (190 K) and above Tg (310 K), respectively. A n-body self-aggregation refers to the cluster of n trehalose molecules in which any trehalose molecule can be connected with any others in the cluster through intermolecular H-bonds. The 0-body aggregation refers to a single trehalose molecule with no intra- or intermolecular H-bonds.
Figure 8.
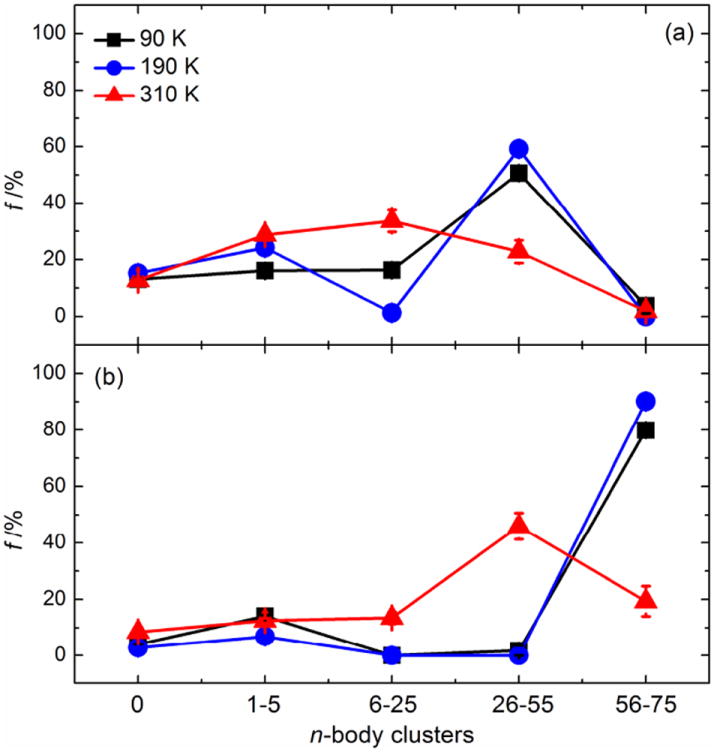
The probability f distributions of trehalose molecules to form a n-body self-aggregate at 90 K (black), 190 K (blue), and 310 K (red) in trehalose-water mixtures of (a) 45.6 wt% and (b) 54.1 wt% trehalose. Error bars represent Standard Error of the Mean (n=100).
It was determined that both the temperature and the concentration affected the self-aggregation characteristics of trehalose molecules. The data points in Figure 8 can be generally divided into two groups: 1) 90 and 190 K corresponding to the glassy and rubbery states and 2) 310 K corresponding to the liquid state. One can observe in Figure 8(a) that the biggest difference between the glassy/rubbery state and the liquid state for 45.6 wt% trehalose appeared at n=26-55. In the glassy/rubbery state, over 50% of the total 75 trehalose molecules preferred to form clusters with n=26-55 compared to 22.8% in the liquid state. Trehalose molecules in the liquid state were relatively evenly distributed through n=0-75, as is expected for a system with high molecular mobility. When the physical state of the mixture approaches that of a liquid (above Tg), the molecular mobility of trehalose will no longer be suppressed. As a result trehalose molecules will begin to interact with others more easily, as evidenced by an increase in Dtre above Tg (see Figure 3(b)) and an increase in the breaking and reconstruction of tre-tre H-bonds, shown by the significant decrease in τHBC and τHBI (see Table 4) in the supra- Tg region. When the concentration is increased to 54.1 wt% trehalose (See Figure 8(b), bigger clusters (n=56-75) were observed most frequently in the glassy and rubbery states, with f being over 80%.
These new insights into the self-aggregation behavior at sub- Tg temperatures indicate that large clusters of trehalose molecules may constitute the main structure of the amorphous concentrated trehalose-water matrix. Moreover, glasses created by quenching samples of different starting concentrations resulted in different trehalose cluster sizes. Such clustering can result in molecular scale environments that are intermittently trehalose- and water-rich throughout a bulk sample. Depending on the size of the preserved sample, for a sample contained within such a glass, this heterogeneity could have a beneficial or detrimental effect, depending on whether or not molecular flexibility is considered desirable (Ex. providing resistance to shear stresses that can cause sample cracking) or undesirable (Ex. inducing degradative reaction kinetics in water pockets). These results suggest that the composition used to achieve a glassy state might have a significant effect on the nanoscale heterogeneity of glassy samples and thus overall functional outcome. Further experiments would be necessary to validate this hypothesis.
Conclusions
Our findings provide in-depth insights into the dynamic and thermodynamic characteristics associated with the glass transition of trehalose-water mixtures, especially at sub- Tg temperatures. This study also illustrates the utility of MD simulation as a complementary technique for probing vitrification phenomena such as the Tg-determination. By mimicking the quenching and annealing protocols used in a typical DSC approach to determine Tg, molecular dynamics simulations were conducted on aqueous trehalose solutions covering the entire concentration range (0-100 wt%). The supplemented phase diagram (Tg as a function of the solution composition) was reproduced based on properties including CP and Dtre, yielding good agreement with the experimental results. It was found that the prediction based on Dtre produced the best agreement with the experimental values in the literature. The prediction based on Dw was offset from the experimental data but still followed the same trend as the G-T description. The analysis of the structure and dynamics of the H-bonding network demonstrated that there are significant differences between the glassy and liquid states in terms of H-bond lifetime, but not H-bond constitution. It was speculated that the extended H-bond lifetime in the glassy state could reflect the slower secondary relaxation dynamics, both of which are primarily related to the local reorientation of –OH groups in the trehalose molecule. Finally, it was determined that both the temperature and the concentration affected the self-aggregation characteristics of trehalose molecules. Aggregation of trehalose was prevalent in the glassy state and as the temperature increased above Tg, aggregation diminished considerably at all studied concentrations. As the concentration of trehalose was increased, the average size of the clusters observed in the glassy state increased, ultimately approaching a cluster size that contained almost all of the molecules in the simulation box. These results suggest that the starting trehalose composition used to achieve a glassy state might have a significant influence on the nanoscale heterogeneity of glassy samples. This could influence the functionality of the glass as preservation vehicle. Theoretically, if the majority of preserved material remained within large clusters of low-mobility sugar glass, this nanoscale heterogeneity could serve to protect the materials from the influence of mobile water molecules that can percolate through the more constrained sugar matrix. If the preserved sample is larger than the projected trehalose cluster size, the potential for exposure to water-rich pockets exists.
Acknowledgments
The authors thank Dr. Donald Jacobs of the Department of Physics and Optical Science at UNC Charlotte for helpful discussions at the onset of this work. This study was supported by grant #5RO1GM101796 from the National Institutes of Health.
References
- 1.Aksan A, Toner M. Langmuir. 2004;20:5521–5529. doi: 10.1021/la0355186. [DOI] [PubMed] [Google Scholar]
- 2.Hancock BC, Zografi G. Pharm Res. 1994;11:471–477. doi: 10.1023/a:1018941810744. [DOI] [PubMed] [Google Scholar]
- 3.Miller DP, de Pablo JJ, Corti HR. Pharm Res. 1997;14:578–590. doi: 10.1023/a:1012192725996. [DOI] [PubMed] [Google Scholar]
- 4.Chen T, Bhowmick S, Sputtek A, Fowler A, Toner M. Cryobiology. 2002;44:301–306. doi: 10.1016/s0011-2240(02)00025-1. [DOI] [PubMed] [Google Scholar]
- 5.Crowe LM, Reid DS, Crowe JH. Biophys J. 1996;71:2087–2093. doi: 10.1016/S0006-3495(96)79407-9. [DOI] [PMC free article] [PubMed] [Google Scholar]
- 6.Crowe JH, Crowe LM, Oliver AE, Tsvetkova N, Wolkers W, Tablin F. Cryobiology. 2001;43:89–105. doi: 10.1006/cryo.2001.2353. [DOI] [PubMed] [Google Scholar]
- 7.Chen T, Fowler A, Toner M. Cryobiology. 2000;40:277–282. doi: 10.1006/cryo.2000.2244. [DOI] [PubMed] [Google Scholar]
- 8.Crowe LM, Crowe JH. Biochim Biophys Acta Biomembr. 1991;1064:267–274. doi: 10.1016/0005-2736(91)90311-u. [DOI] [PubMed] [Google Scholar]
- 9.Abazari A, Jomha NM, Elliott JA, McGann LE. Cryobiology. 2013;66:201–209. doi: 10.1016/j.cryobiol.2013.03.001. [DOI] [PubMed] [Google Scholar]
- 10.Ablett S, Izzard MJ, Lillford PJ. J Chem Soc Faraday Trans. 1992;88:789–794. [Google Scholar]
- 11.Roos Y. Carbohydr Res. 1993;238:39–48. [Google Scholar]
- 12.Miller DP, de Pablo JJ, Corti HR. J Phys Chem B. 1999;103:10243–10249. [Google Scholar]
- 13.Reis J, Sitaula R, Bhowmick S. J Biomed Sci Eng. 2009;2:594–605. [Google Scholar]
- 14.Caffarena E, Raul Grigera J. J Chem Soc Faraday Trans. 1996;92:2285–2289. [Google Scholar]
- 15.Caffarena ER, Grigera JR. Carbohydr Res. 1997;300:51–57. [Google Scholar]
- 16.Yoshioka S, Aso Y, Kojima S. Pharm Res. 2003;20:873–878. doi: 10.1023/a:1023831102203. [DOI] [PubMed] [Google Scholar]
- 17.Simperler A, Kornherr A, Chopra R, Bonnet PA, Jones W, Motherwell WS, Zifferer G. J Phys Chem B. 2006;110:19678–19684. doi: 10.1021/jp063134t. [DOI] [PubMed] [Google Scholar]
- 18.Watt SW, Chisholm JA, Jones W, Motherwell S. J Chem Phys. 2004;121:9565. doi: 10.1063/1.1806792. [DOI] [PubMed] [Google Scholar]
- 19.Han J, Gee RH, Boyd RH. Macromolecules. 1994;27:7781–7784. [Google Scholar]
- 20.Conrad PB, de Pablo JJ. J Phys Chem A. 1999;103:4049–4055. [Google Scholar]
- 21.Lerbret A, Bordat P, Affouard F, Descamps M, Migliardo F. J Phys Chem B. 2005;109:11046–11057. doi: 10.1021/jp0468657. [DOI] [PubMed] [Google Scholar]
- 22.Sapir L, Harries D. J Phys Chem B. 2011;115:624–634. doi: 10.1021/jp109780n. [DOI] [PubMed] [Google Scholar]
- 23.Phillips JC, Braun R, Wang W, Gumbart J, Tajkhorshid E, Villa E, Chipot C, Skeel RD, Kale L, Schulten K. J Comput Chem. 2005;26:1781–1802. doi: 10.1002/jcc.20289. [DOI] [PMC free article] [PubMed] [Google Scholar]
- 24.Guvench O, Hatcher E, Venable RM, Pastor RW, MacKerell AD., Jr J Chem Theory Comput. 2009;5:2353–2370. doi: 10.1021/ct900242e. [DOI] [PMC free article] [PubMed] [Google Scholar]
- 25.Neria E, Fischer S, Karplus M. J Chem Phys. 1996;105:1902. [Google Scholar]
- 26.Caffarena ER, Grigera JR. Carbohydr Res. 1999;315:63–69. [Google Scholar]
- 27.Giovambattista N, Angell CA, Sciortino F, Stanley HE. Phys Rev Lett. 2004;93:047801. doi: 10.1103/PhysRevLett.93.047801. [DOI] [PubMed] [Google Scholar]
- 28.Weng L, Chen C, Zuo J, Li W. J Phys Chem A. 2011;115:4729–4737. doi: 10.1021/jp111162w. [DOI] [PubMed] [Google Scholar]
- 29.Lagache M, Ungerer P, Boutin A, Fuchs A. Phys Chem Chem Phys. 2001;3:4333–4339. [Google Scholar]
- 30.Cadena C, Zhao Q, Snurr RQ, Maginn EJ. J Phys Chem B. 2006;110:2821–2832. doi: 10.1021/jp056235k. [DOI] [PubMed] [Google Scholar]
- 31.Liu H, Maginn E, Visser AE, Bridges NJ, Fox EB. Ind Eng Chem Res. 2012;51:7242–7254. [Google Scholar]
- 32.Chandra A, Ichiye T. J Chem Phys. 1999;111:2701. [Google Scholar]
- 33.Skarmoutsos I, Guardia E, Samios J. J Chem Phys. 2010;133:014504. doi: 10.1063/1.3449142. [DOI] [PubMed] [Google Scholar]
- 34.Kaplan DS. J Appl Polym Sci. 1976;20:2615–2629. [Google Scholar]
- 35.Claudy P, Jabrane S, Letoffe J. Thermochim Acta. 1997;293:1–11. [Google Scholar]
- 36.Biroli G, Garrahan JP. J Chem Phys. 2013;138:12A301. doi: 10.1063/1.4795539. [DOI] [PubMed] [Google Scholar]
- 37.Angell C. Chem Rev. 2002;102:2627–2650. doi: 10.1021/cr000689q. [DOI] [PubMed] [Google Scholar]
- 38.Rice SA, Bergren MS, Swingle L. Chem Phys Lett. 1978;59:14–16. [Google Scholar]
- 39.Angell C, Tucker J. J Phys Chem. 1980;84:268–272. [Google Scholar]
- 40.Haynes WM, Lide DR, Bruno TJ. CRC Handbook of Chemistry and Physics 2012-2013. 93. CRC press; 2012. [Google Scholar]
- 41.ROOS Y, KAREL M. J Food Sci. 1991;56:38–43. [Google Scholar]
- 42.Ekdawi-Sever N, de Pablo JJ, Feick E, von Meerwall E. J Phys Chem A. 2003;107:936–943. [Google Scholar]
- 43.Rampp M, Buttersack C, Lüdemann HD. Carbohydr Res. 2000;328:561–572. doi: 10.1016/s0008-6215(00)00141-5. [DOI] [PubMed] [Google Scholar]
- 44.Liu P, Harder E, Berne B. J Phys Chem B. 2004;108:6595–6602. [Google Scholar]
- 45.Bellavia G, Cottone G, Giuffrida S, Cupane A, Cordone L. J Phys Chem B. 2009;113:11543–11549. doi: 10.1021/jp9041342. [DOI] [PubMed] [Google Scholar]
- 46.Chan R, Pathmanathan K, Johari G. J Phys Chem. 1986;90:6358–6362. [Google Scholar]
- 47.Langer J. Phys Rev E. 2008;78:051115. doi: 10.1103/PhysRevE.78.051115. [DOI] [PubMed] [Google Scholar]


