
Figure 1.
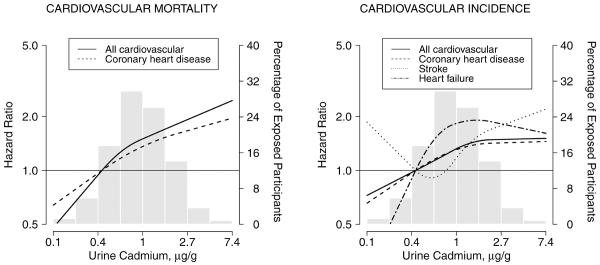
Hazard ratios for cardiovascular mortality and incidence by urine cadmium concentrations (n=3,348). Lines represent adjusted hazard ratios based on restricted quadratic splines for log-transformed cadmium concentrations with knots at the 10th, 50th and 90th percentiles, which correspond to 0.40, 0.92 and 2.14 μg/g creatinine, respectively. The reference was set at the 10th percentile of cadmium distribution. Vertical bars represent the histogram of urine cadmium distribution in the study population. The models were adjusted for sex, post-menopausal status for women (yes, no), education (< high school, ≥ high school), body mass index (kg/m2), total cholesterol (mg/dL), estimated LDL- cholesterol (mg/dL), hypertension (yes, no), diabetes (yes, no), estimated glomerular filtration rate (ml/min/1.73m2), smoking status (never, former, current) and cumulative smoking dose (pack-years modeled as restricted cubic splines with knots at 10, 20 and 30 pack-years). Cardiovascular incidence included fatal and non-fatal events.