

Summary
G proteins and their associated receptors process information from a variety of environmental stimuli to induce appropriate cellular responses. Generally speaking, each cell in a population responds within defined limits despite large variation in the expression of protein signaling components. Therefore we postulated that noise suppression is encoded within the signaling system. Using the yeast mating pathway as a model we evaluated the ability of a regulator of G protein signaling (RGS) protein to suppress noise. We found that the RGS protein Sst2 limits variability in transcription and morphogenesis in response to pheromone stimulation. While signal suppression is a result of both the GAP (GTPase accelerating) and receptor binding functions of Sst2, noise suppression requires only the GAP activity. Taken together our findings reveal a hitherto overlooked role of RGS proteins as noise suppressors, and demonstrate an ability to uncouple signal and noise in a prototypical stimulus-response pathway.
Introduction
All eukaryotic cells have the ability to detect external signals and generate an appropriate response. Many of these signals, including most hormones and neurotransmitters, as well as environmental stimuli such as odors, tastes and light, are detected by cell surface receptors coupled to G proteins. Upon activation these receptors promote binding of GTP to the G protein α subunit (Gα) and dissociation of Gα from the G protein βγ subunits. Regulators of G protein signaling (RGS proteins) promote the hydrolysis of GTP to GDP, thereby terminating the signal (Neves et al., 2002). Thus receptors and RGS proteins act in opposition to one another to control signal output.
G protein signaling systems are conserved across the animal, plant and fungal kingdoms. Among the best characterized is the pheromone response pathway in the yeast Saccharomyces cerevisiae. In this example, a G protein-coupled receptor binds to peptide pheromones, which initiates events that prepare haploid cells for mating. As shown in Figure 1 A, there are two effector systems downstream of the G protein: one that activates a prototypical MAP kinase cascade and the transcription of genes necessary for cell fusion and growth arrest, and a second that triggers Cdc42-dependent morphological changes resulting in either cell expansion towards the source of pheromone (gradient tracking) or formation of a mating projection (shmoo) (Dohlman and Thorner, 2001).
Figure 1.
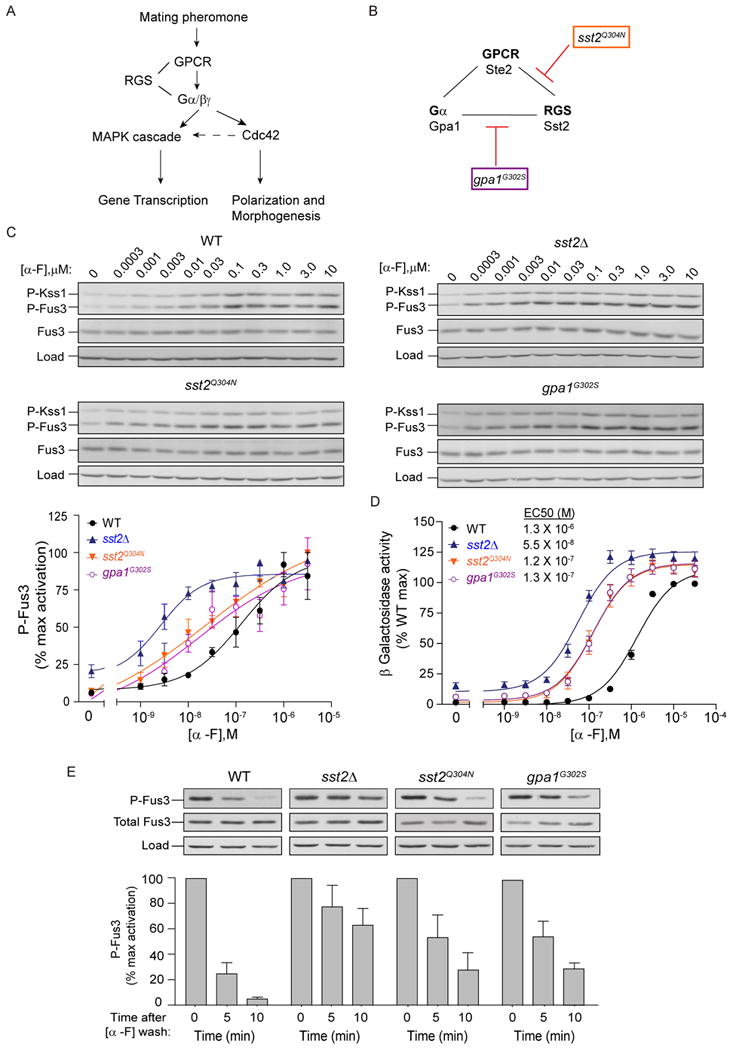
Binding of the RGS protein to the receptor and G protein contribute equally to signal suppression.
(A) Schematic of the pheromone response pathway. Upon mating pheromone stimulation, the G protein coupled receptor (GPCR) initiates activation of the G protein heterotrimer, which promotes mating gene transcription (via a MAPK cascade) and cell polarization and morphogenesis (via the small G protein Cdc42). Activated Cdc42 further promotes MAPK signaling while the RGS protein dampens the signal.
(B) Receptor (Ste2), Gα protein (Gpa1) and RGS protein (Sst2) assemble through direct and indirect interactions. The point mutant sst2Q304N disrupts interaction with Ste2 whereas the point mutant gpa1G302S disrupts interaction with Sst2.
(C) Top, dose dependence of MAPK activation: Wild type, sst2Δ, gpa1G302S or sst2Q304N cells were treated with the indicated concentration (μM) of α factor (α-F), collected at 5 min, and probed by immunoblotting with p44/42 (P-Fus3, P-Kss1), Fus3 and G6PDH (load control) antibodies. Bottom, Densitometry of P-Fus3 bands normalized to maximum Fus3 activation. (See Figure S1).
(D) Transcriptional activation (β-Galactosidase activity) was measured spectrofluorometrically in all strains as in (C). Cells expressing FUS1-lacZ were exposed to the indicated concentrations of α factor for 90 min. Shown in inset are the calculated EC50 values for each strain. (See Figure S1).
(E) Time course of MAPK inactivation. Cells were treated with 3 μM α factor for 30 min, harvested by centrifugation, washed once, resuspended in pheromone-free medium and samples collected at the indicated times. Graphs shown below depict densitometry of P-Fus3 bands. All data are mean ± SEM for three independent experiments.
As in most signaling systems, G protein activity is influenced by the strength and duration of the stimulus as well as feedback loops that promote or inhibit signaling over time (Purvis and Lahav, 2013). The dominant source of negative feedback in the pheromone pathway is the RGS protein Sst2, which is strongly induced in response to prolonged pheromone stimulation (Dohlman et al., 1996). Less appreciated are the effects of cell-to-cell differences arising from stochasticity in biochemical reactions, differences in the expression or activity of internal signaling components, as well as heterogeneity in cell states (i.e. cell cycle, cell age and metabolic state) (Becskei et al., 2005; Colman-Lerner et al., 2005; Elowitz et al., 2002; Fraser et al., 2004; Maheshri and O'Shea, 2007; McAdams and Arkin, 1999; Ricicova et al., 2013; Volfson et al., 2006). Such differences greatly increase the number of possible outcomes during signaling. For that reason we asked whether there are systems within signaling pathways to regulate the output and limit the cell-to-cell variability or ‘noise’ in the system (Fraser et al., 2004; Maheshri and O'Shea, 2007). Yeast is especially well suited for investigating noise because it is a unicellular eukaryote (every cell in a population is genetically identical). Therefore each member of the population can be grown under identical environmental conditions and this enables direct correlation between genotype and phenotype at the whole organism level. Furthermore the mating pheromone pathway is among the simplest and most thoroughly understood of any GPCR system (Dohlman and Thorner, 2001)
Here we consider noise suppression by the yeast RGS protein Sst2. Sst2 is the first, and arguably the best-characterized, member of the RGS protein family (Dohlman et al., 1996). Like other RGS proteins, Sst2 has an RGS-core domain that accelerates G protein GTPase (GAP) activity (Apanovitch et al., 1998). Additionally, Sst2 is one of a subset of RGS proteins containing an N-terminal DEP (Dishevelled, Egl-10, Pleckstrin) domain, which binds to the receptor (Ballon et al., 2006). Both domains are needed for cells to efficiently dampen responses to a pheromone signal. Using single cell analysis we show that Sst2 can suppress noise, that Sst2 acts in a stimulus- and time-dependent manner, and that it acts in both the transcription and morphogenesis branches of the pathway. While signal suppression is mediated equally by the receptor- and G protein-binding functions of Sst2, noise suppression relies exclusively on proper G protein GTPase activity. Taken together these findings reveal that the RGS protein functions as a noise filter. More broadly, these findings reveal that noise suppression and signal suppression are not linked in an obligatory manner, and that signal responses and noise can be regulated independently.
Results
Sst2 receptor binding and GTPase- accelerating activities promote desensitization
Sst2 is well known to diminish pheromone signaling over time. Moreover, Sst2 acts in two ways, by binding to the receptor as well as by promoting G protein GTPase activity (Ballon et al., 2006). Here we examine how these activities affect the signal and the noise, over time, and in space in response to a gradient stimulus. Accordingly, we began by comparing signal suppression in mutants deficient in Sst2-receptor binding (sst2Q304N ) (Ballon et al., 2006), GTPase-accelerating activity (gpa1G302S) (DiBello et al., 1998), or both (sst2Δ) (Figure 1B). We monitored pheromone responses at the level of MAPK (mitogen activated protein kinase) activation (immunoblotting), transcriptional induction (β-galactosidase assay) and growth inhibition (halo assay). To measure MAPK activity we used an antibody that recognizes the phosphorylated and fully activated form of Fus3. Kinase activation was greatest in sst2Δ cells, followed by the point mutants (sst2Q304N and gpa1G302S), and then wild type cells (Figure 1C and Figure S1A). Likewise in the transcription reporter assay, sst2Δ cells were ∼100 fold more sensitive than wild type cells to pheromone, while the two point mutants (sst2Q304N and gpa1G302S) were each 10 fold more sensitive (Figure 1D, compare EC50 values). We observed the same rank order of sensitivity in the growth arrest assays (Figure S1B).
In addition to the standard assays described above, we employed a new approach to quantify pheromone pathway deactivation. In this method, we stimulated cells with pheromone for 30 min, then washed with pheromone-free medium and monitored MAPK phosphorylation as cells recovered over time. Normally in wild type cells, phospho-MAPK levels drop rapidly and reach pre-stimulation levels after 10 min (Figure 1E). Cells lacking Sst2 exhibited sustained MAPK phosphorylation, long after pheromone withdrawal (over 60 min post wash), as expected for a defect in desensitization. The two point mutants (sst2Q304N and gpa1G302S) also exhibited prolonged MAPK phosphorylation. As seen for assays of pathway activation, pathway deactivation was identical in each of the two point mutants and intermediate to that observed in the presence and absence of Sst2. Thus by four different measures we find that mutants deficient in receptor binding (sst2Q304N) or GTPase-accelerating activity (gpa1G302S) are equally sensitive to pheromone. The ability to separate the two known functions of Sst2 allows us to assess the contributions of each to noise suppression, without the confounding effects of differences in overall signaling.
Sst2 suppresses noise in gene transcription
Upon activation, the G protein feeds into two branches of the mating pathway, one that promotes new gene transcription and a second that promotes polarized expansion towards the source of pheromone (gradient tracking). Since gene expression is by far the best studied and most established measure of noise (Elowitz et al., 2002; Raser and O'Shea, 2005) we first focused our efforts on measuring transcription in the presence and absence of Sst2. For these experiments we employed a microfluidic chamber where cells are maintained in a uniform environment to minimize fluctuations in pheromone concentration (Hao et al., 2008). As shown in Figure 2A, the pheromone is delivered by passive diffusion from feeder channels perpendicular to the direction of flow on either side of the growth chamber. This minimizes flow across the cells so that they remain stationary during the course of the experiment. To monitor transcription we selected two native gene promoters each fused to a fluorescent reporter: GFP driven by the FUS1 promoter and mCherry driven by the ADH1 promoter (Figure 2B). Whereas FUS1-GFP reports on pheromone-driven transcription, ADH1-mCherry is constitutively produced and therefore reports on the overall expression capacity of the cell (Colman-Lerner et al., 2005). As expected, GFP expression increased in response to pheromone while mCherry was essentially unchanged (Figure 2C, left). We then quantified GFP and mCherry expression in individual cells, normalized GFP relative to mCherry in each cell and calculated the coefficient of variation (CV) for the population at discrete time points. Normalizing pathway response (GFP) with a reference reporter (mCherry) accounts for any cell-to-cell differences in protein expression capacity and corrects for instrument fluctuations, non-uniform field illumination and differences in cell size and the focal plane being imaged. This experimental platform allows us to measure pathway specific noise (Colman-Lerner et al., 2005) and also differentiate biochemical noise within a single cell (intrinsic noise) from variability within the population (extrinsic noise).
Figure 2.
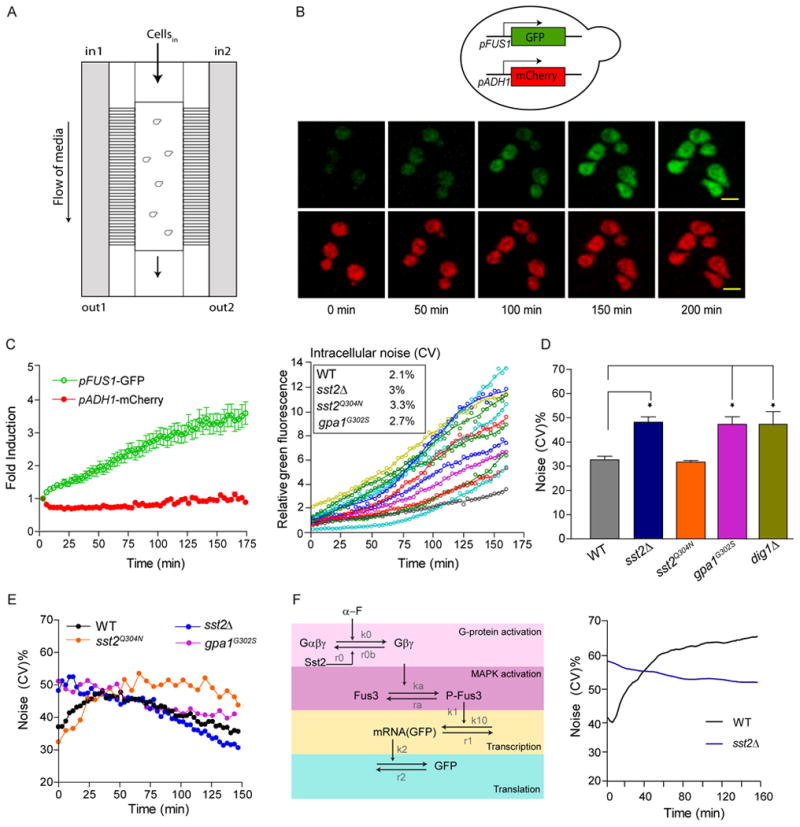
RGS-GAP activity suppresses noise in gene expression.
(A) Schematic of the microfluidic chamber.
(B) Top, Transcriptional reporter assay: pheromone pathway specific reporter FUS1-GFP was integrated at the FUS1 promoter; reference reporter ADH1-mCherry was integrated at the ADH1 promoter. Bottom, Activation of pheromone-dependent gene expression: Wild type cells were treated with 150 nM α factor. GFP and mCherry fluorescence was visualized by confocal microscopy at the indicated times. Scale bar, 5 μm.
(C) Left, Quantification of fold induction of GFP and mCherry in wild type cells in response to pheromone treatment. Data show mean +/- SD for at least 50 individual cells. Right, Representative single cell traces of relative GFP (GFP fluorescence/mCherry fluorescence) for individual wild type cells over time, showing minimal intrinsic fluctuations within single cells. Inset, measurements for average intracellular variability over time (see Supplemental Experimental Procedures) for cells treated with 150 nM α factor. (See Figure S2)
(D) Bar graphs showing the CV of basal (relative) GFP expression in wild type, sst2Δ, gpa1G302S sst2Q304N and dig1Δ cells in the absence of pheromone. Student's t-test was used to calculate P values (* P<0.05). CV calculated from three independent experiments with at least 100 individual cells per experiment.
(E) Dynamic change in CV over time following treatment with 150 nM α factor. Fluorescence and CV measurements were made every 3 min for wild type cells and every 6 min for mutant strains (see Figure S2).
(F) Left, Model of the pheromone pathway featuring core components with key reactions and rates highlighted. Model assumes cell-to-cell variability in the abundance or activity of pathway components at the level of the MAPK and above. Parameters derived from the literature were optimized to those that best matched the data in (E). See Experimental Procedures for details of parameter optimization. The reactions, as well as final parameter values, used for the model for calculating CV are provided in Table S4 of Supplemental Information. Right, Stochastic simulations were run using BioNets as described in the experimental procedures to calculate CV over time for wild type and sst2Δ cells under pheromone stimulation. (See Figure S3)
We began by measuring total noise in the absence of stimulus. As compared to wild type, the sst2Δ mutant exhibited a significant 50% increase in cell-to-cell variability (Figure 2D). Using the same assay we saw an identical increase in the “benchmark” dig1Δ strain, reported previously to elevate CV in the absence of pheromone (Figure 2D) (McCullagh et al., 2010). An equivalent increase in baseline variability was seen in the absence of GAP activity (gpa1G302S) but not in the absence of receptor binding (sst2Q304N) (Figure 2D). The increase in CV was not due to a global increase in gene expression noise as determined by comparing the normalized mean GFP and mCherry intensities in wild type and sst2Δ cells (Figure S2A). Moreover, the CV remained relatively constant over time (Figure S2B), demonstrating that basal noise is unaffected by progression through the cell cycle. We conclude that GAP activity, but not receptor binding, acts to suppress cell-to-cell variability in the absence of stimulus. In a previous study it was concluded that loss of Sst2 results in receptor independent G protein activation in a subset of the population (Siekhaus and Drubin, 2003). While indicative of noise, their measurements relied on plasmid-borne transcription reporters, which are inherently noisy (Lobner-Olesen, 1999), and were made only in the absence of stimulus.
Given that Sst2 can alter signal dynamics (Figure 1E), we next considered how Sst2 affects the dynamics of noise. Accordingly, we monitored reporter activity in cells treated with pheromone. Shown in Figure 2C (right) are representative traces for relative GFP intensities in single cells over time. Visual inspection clearly showed that cell-to-cell variability, but not fluctuations within each cell, was the dominant source of noise. To further quantify intracellular variability (intrinsic fluctuations and experimental noise), we fit a smooth curve to each trace and calculated the deviation of the data for each trajectory (Figures 2C and S2C; see Supplemental Experimental Procedures for details). By this measure we confirmed that there was little difference in intracellular variability between any of the four strains. Additionally, in each strain intracellular variability had a very low contribution to total noise, indicating that the majority of noise stems from cell-to-cell variability in the population.
We then turned to measures of total noise. Following treatment with pheromone, noise in wild type cells increased initially but then declined after approximately 40 min (Figure 2E and S2D). In contrast, sst2Δ cells exhibited high basal noise that declined immediately after the addition of pheromone. A similar change in CV was evident in the absence of GAP activity (gpa1G302S) but not in the absence of receptor binding (sst2Q304N) (Figure 2E and S2D). Thus, while receptor binding and GAP activity are both needed to suppress the pheromone signal, and they contribute equally to signal regulation, GAP activity alone suppresses transcriptional noise.
We then performed additional experiments using lower doses of pheromone that better matched the elevated sensitivity of the sst2Δ mutant. For wild type cells at saturating pheromone, the noise increased and then decreased, while at non-saturating pheromone the noise increased and remained elevated (Figure S2E). In sst2Δ cells the noise decreased over time, and this decrease was more pronounced at higher (saturating) pheromone concentrations (Figure S2F). There was no further decrease even at the highest concentrations of pheromone (compare sst2Δ in Figures 2E and S2F). These results show that noise is higher at the non-saturating concentrations of pheromone, and the same pattern holds for the sst2Δ mutant and wild type strains.
We postulated that the initial increase in CV after pheromone stimulation was due to variability in the abundance of early pathway components (Newman et al., 2006). In the absence of pheromone, expression and therefore cell-to-cell variability of the reporter is dependent on the basal activity of the transcriptional machinery but independent of other signaling components (basal MAPK activation is negligible). However, in the presence of pheromone, the MAPKs are activated and expression of the reporter is dependent on MAPK activation in individual cells, which is variable. Thus the dominant source of variability may shift, in a dynamic manner, from components downstream of the MAPK to variable components upstream of the kinase. This shift could lead to an initial increase in cell-to-cell variability following stimulation. This increase in CV is followed by a gradual decrease after 30-40 min of stimulation. Coincident with this transition is a pheromone-dependent redistribution of Sst2, wherein the protein moves from the cytoplasm to the plasma membrane and becomes concentrated at the mating projection where receptors and G proteins are located (Figure S2G). In contrast, Sst2Q304N remains cytoplasmic at all times (Ballon et al., 2006) possibly accounting for the sustained elevated noise exhibited by the mutant. In the absence of Sst2, basal signaling and MAPK activation is permanently elevated (Figure 1C & D) and, consequently, so is variability in protein expression. In this situation there is no transition between late and early sources of variability and the CV does not increase after pheromone addition.
To better understand noise dynamics we built several stochastic models based on the core signaling cascade shown in Figure 2F (left) and containing various control mechanisms that might regulate noise. These alternative models featured the core pathway components alone (model A) or the same components with pheromone induced stabilization/destabilization of the MAPK (model B), positive feedback at the level of the MAPK (model C) or negative feedback mediated by the MAPK (model D) (Figure S3). Details of the models can be found in the Supplemental Information and important modeling parameters are provided in Supplemental Table 4. All four models were evaluated for their ability to capture the changes in noise exhibited by wild type cells treated with pheromone (Figure 2F and Figure S3). All incorporate intrinsic fluctuations due to the random nature of biochemical reactions in the cell. However none of these models were able to capture the qualitative behavior of the CV for wild type cells, suggesting another source of variability is responsible for the noise properties of the pathway. To investigate this we used the used the core signaling cascade (Model A, Figure S3) and added cell-to-cell variability in upstream signaling components. In this case the abundance of the MAPK, Fus3, and the G protein were randomly chosen from normal distributions centering on average values derived from the literature (with a 30% variance). Stochastic simulations of the revised model (Figure 2F and S3A, right) were compatible with the experimental data provided in Figure 2E.
Our model generates results that are consistent with several important properties of the pathway. First, the model predicts that basal noise is increased by stochastic activation of the G protein and decreased by Sst2-mediated inactivation of the G protein. In support of this prediction, cells that lack Sst2 exhibit elevated basal G protein activity, elevated expression of upstream signaling components, and consequently increased variability in basal Fus3 activity, all contributing to the elevated initial CV. Second, in cells treated with pheromone, noise becomes elevated due to variable expression of the pathway components upstream of the transcriptional machinery. As shown in Figure 2F, our model captures (i) the qualitative difference in the starting CV in the presence and absence of Sst2, (ii) the pheromone-dependent increase in CV when Sst2 is present and, (iii) the immediate decrease in CV when Sst2 is absent. For the sake of simplicity we only considered Sst2 GAP activity and not receptor binding. We did not expect the model to capture changes in CV at later times, which are likely influenced by more complex events, such as the redistribution of Sst2 to the plasma membrane (Figure S2G) or feedback regulation.
Sst2 suppresses noise in morphogenesis
Having shown that Sst2 limits transcriptional noise, we next considered whether Sst2 also limits variability in morphogenesis. As noted above, the G protein initiates signaling through two pathways, one that is mediated by the MAPK Fus3, leading to new gene transcription, and a second that is mediated by the small G protein Cdc42. Cdc42 drives cell polarization during budding as well as in preparation for mating (Moskow et al., 2000; Pruyne and Bretscher, 2000). Thus the pheromone-dependent changes in cell morphology are an important indicator of the cellular decision-making process. Upon pheromone stimulation the population transitions from a one state system comprised of budding cells (vegetative growth) to a three state system comprised of budding cells, elongated cells and shmooing cells. In wild type cells, the two new states are temporally distinct, with the elongated growth stage emerging last (Figure S4, left). It has been shown previously that these elongated cells expand in the direction of a gradient stimulus, presumably in an effort to reach a distant mating partner (Erdman et al., 1998; Hao et al., 2008). In contrast, cells lacking Sst2 display a variety of morphologies (Figure S4, right) including circular, elliptical, peanut and irregular shapes. Given this heterogeneity in cell shape, we postulated that Sst2 suppresses variability in morphogenesis and that noise suppression enables effective decision making in response to a pheromone gradient.
Thus the results presented above reveal that Sst2 suppresses variability in cellular morphogenesis, particularly in the elongation phase where cells can expand towards a pheromone stimulus. It has been shown previously that Sst2 is required to properly track a pheromone gradient (Segall, 1993). We therefore hypothesized that gradient tracking relies on Sst2-mediated noise suppression during morphogenesis. To test our theory we quantified the behavior of our mutants in a microfluidics chamber capable of producing a linear pheromone gradient. For these experiments we used pheromone concentrations matched to the sensitivity of the individual strains; 0-150 nM for wild type, 0-50 nM for gpa1G302S and sst2Q304N, and a 0-7.5 nM for sst2Δ. To monitor directionality of growth we used a GFP-tagged version of the protein Bem1, which binds active Cdc42 and therefore localizes to the polar cap (Madden and Snyder, 1998). To assess gradient tracking we focused on cells residing in the region of the chamber with the largest linear difference in pheromone concentration, as evaluated by the intensity of a dye contained in pheromone solution (Figure 3A). Cell polarization was then monitored over 5 min intervals (Figure 3B) and quantified by measuring the final angle of polar cap orientation (represented as an angle distribution histogram, Figure 3C). As expected, wild type cells oriented properly, typically within -/+ 45° of the gradient, while cells lacking Sst2 oriented randomly. Of the two point mutants, only loss of Sst2 GAP activity (gpa1G302S) produced any defects in gradient tracking (Figure 3C). Thus the mutants that exhibit an increase in transcription noise also exhibit a defect in gradient tracking. If increased pheromone sensitivity alone conferred a defect in gradient tracking, the individual point mutants should have behaved similarly. Taken together our findings indicate that noise suppression, but not signal suppression, is associated with proper chemotropic growth.
Figure 3.
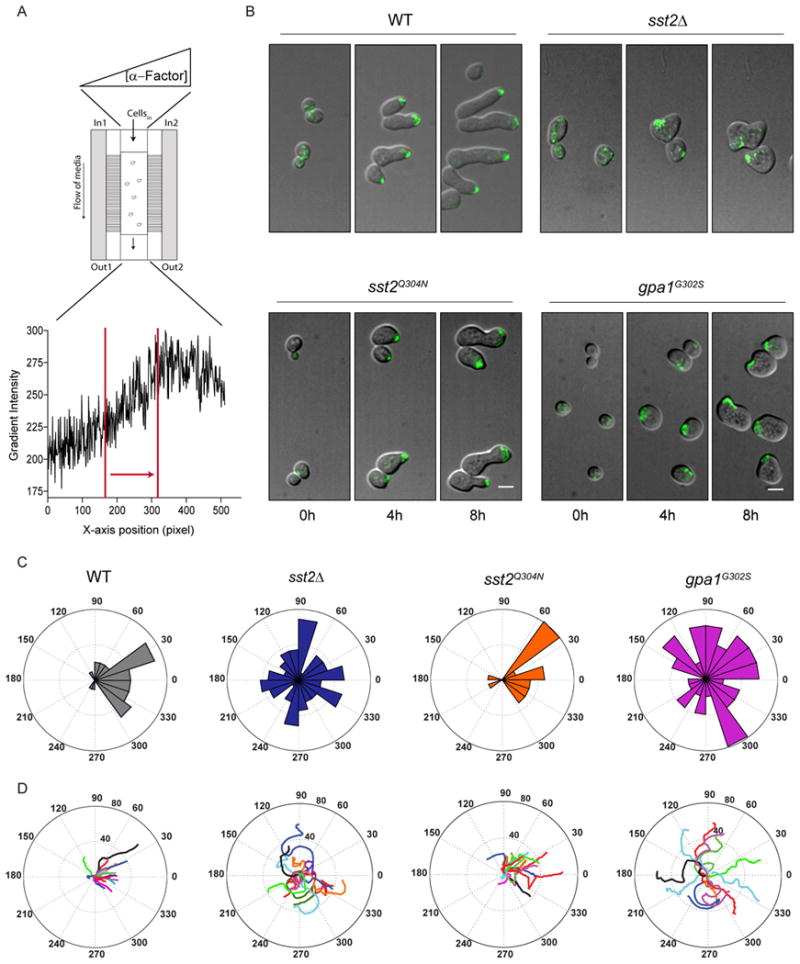
RGS-GAP activity promotes directed polarization and proper gradient tracking:
(A) Top, Schematic of gradient tracking. A gradient was created in the chamber by passive diffusion of pheromone-containing medium from the right channel (ln2) and pheromone-free medium in the left channel (ln1). Bottom, pheromone gradient profile in the microfluidic chamber visualized by the dye cascade blue. Cells were monitored in the region of steepest gradient (bounded by red lines). Arrow points in the direction of highest pheromone.
(B) Merged DIC and fluorescence (Bem1-GFP) images collected at 5 min intervals for 8 h, in the pheromone gradient described in (A). Cells were exposed to the following gradients to promote elongated growth: wild type (0-150 nM), sst2Δ (0-7.5 nM), gpa1G302S and sst2Q304N (0-50 nM). (See Figure S4). Scale Bar, 5 μm.
(C) Histograms for the frequency distribution of the final angle of cell polarization with respect to the pheromone gradient. Zero represents perfect alignment toward the gradient. Results show mean data for two independent experiments, n=50 approx.
(D) Polar plots of ten representative cells tracked over time. Center represents t=0.
We considered two potential mechanisms for a failure to track a gradient. In the first scenario, cells are unable to determine the source of the pheromone and elongate in random directions. In the second, cells are able to sense directional cues, but are unable to maintain polarization in the correct direction. To distinguish between these two possibilities, we monitored the time-dependent (dynamic) changes in cell morphology and polar cap movement. We began with the two mutants unable to track a gradient, sst2Δ and gpa1G302S. In both cases over 50% of cells were unable to elongate towards high pheromone as the polarity site frequently changed direction (Figures 3B and C). Furthermore the random changes in polar cap orientation were evident from the beginning of the stimulus. As before, the two GAP-deficient mutants (sst2Δ & gpa1G302S) also exhibited heterogeneous morphologies. In contrast, wild type cells and the receptor binding mutants (sst2Q304N) elongated properly towards the gradient and exhibited unaltered morphologies. The inability of sst2Δ and gpa1G302S cells to continuously move toward the gradient is documented in Figure 3D, which shows the time averaged path of the polar cap for a representative set of wild type and mutant cells. Finally we measured the persistence in Bem1 polarization over 8 h in a gradient. For this analysis we defined persistence as the ratio of final displacement to total distance traveled. In accordance with the data presented above, the polar cap was most persistent in wild type cells (0.42 ± 0.02) followed by the Sst2-receptor binding mutant (0.25 ±0.01), the Sst2-GAP activity mutant (0.18 ± 0.01) and finally the sst2Δ cells (0.13 ±0.01). We conclude that Sst2 GAP activity promotes directional persistence of the polar cap during gradient tracking, and does so by suppressing morphological variation.
Successful mating is contingent upon the ability to reliably sense the source of pheromone, to induce mating genes and to form a stable mating projection (or shmoo) for fusion with a mating partner. Since loss of GAP activity results in increased variability in transcription as well as in morphology, we sought to examine the consequences of these defects with regard to mating. Accordingly, we tested the ability of cells to maintain polarization in saturating pheromone (mimicking the presence of a nearby mate). As shown in Figure 4A and movie S1, wild type cells and mutants deficient in receptor binding (sst2Q304N) were able to form well-defined shmoos and the polar cap did not change orientation over time. These results imply that cells, once they are properly polarized, are able to maintain the orientation of the polar cap. In contrast, cells lacking Sst2 did not form well-defined shmoos and the polar cap randomly changed orientation, implying a defect in maintenance of polar cap orientation. Once again, mutants deficient in GAP function (gpa1G302S) showed a defect similar to that of sst2Δ cells.
Figure 4.
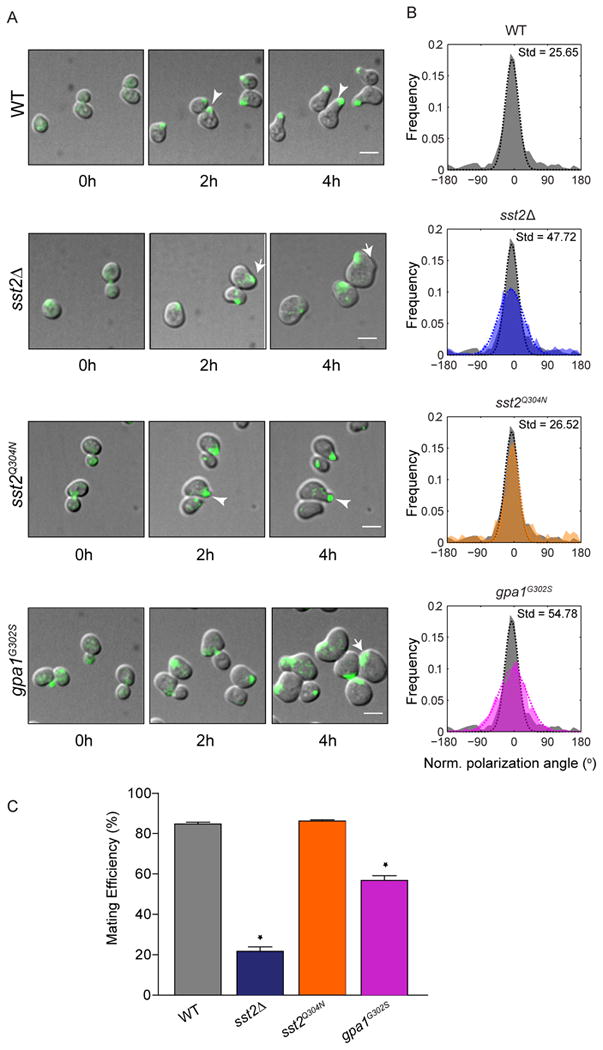
RGS-GAP activity promotes persistent polarization and proper mating efficiency:
(A) Merged DIC and fluorescence (Bem1-GFP) images of cells treated with saturating pheromone concentrations (300 nM) to promote shmoo formation, collected at 5 min intervals for 4 h. Arrows indicate the site of Bem1 polarization. (See Figure S4 and movie S1).
(B) Frequency distribution of the mean normalized angle of polarization during shmooing in individual cells measured over a 3 h period. The distribution for each mutant is laid over the distribution for wild type cells (in grey). The data for each strain were fit to a single Gaussian and standard deviation (Std) was calculated.
(C) Mating-efficiency assay. Data are mean ± SEM of three independent experiments. Student's t-test was used to calculate P values (* P<0.05).
We then measured the ability of cells to maintain polarization as a frequency distribution of the angle of orientation during shmooing in individual cells. While wild type and sst2Q304N cells exhibited low noise in orientation (measured as the standard deviation of the distribution), sst2Δ and gpa1G302S cells exhibited a high noise in orientation of polarization (Figure 4B). Consistent with a defect in locating a potential mating partner, loss of GAP activity resulted in a severe reduction in mating efficiency (Figure 4C). As in previous assays, the receptor binding mutant (sst2Q304N) showed no defects in orientation or mating ability despite its increased sensitivity to pheromone. Taken together, our data establish that Sst2, and in particular Sst2 GAP activity, is a suppressor of noise. Sst2 acts in both the absence and presence of a pheromone stimulus, regulates noise in a dynamic manner and suppresses noise in transcription as well as in morphogenesis. Based on these findings, we propose that noise suppression - but not signal suppression - is required for proper gradient detection and morphogenesis.
Discussion
It has long been recognized that cellular behavior is a consequence of genetically-encoded and environmental cues. However, advances in single cell analysis have revealed that even genetically identical cells, grown under identical conditions, can exhibit widely divergent behaviors. Furthermore, it is evident that much of the observed variability in eukaryotic cells is due to “extrinsic” sources of noise, as opposed to the “intrinsic” noise inherent in biochemical processes (Raser and O'Shea, 2004; Volfson et al., 2006). Consistent with these broader findings, it has been demonstrated previously that extrinsic noise is the dominant source of variation in the mating pheromone pathway, at least at the level of transcription (Colman-Lerner et al., 2005), and that the transcription regulator Dig1 is a major contributor to noise suppression (McCullagh et al., 2010). Here we show that the RGS protein Sst2 suppresses noise and, more specifically, does so by accelerating G protein inactivation. In our experimental system we found that Sst2 and Dig1 contribute similarly to limiting variability in transcription (Figure 2D). In addition we were able to show that Sst2 suppresses noise in the presence of pheromone and limits variability in cellular morphogenesis as well as in transcription.
We chose to focus on Sst2 for several reasons. First, deletion of Sst2 has the largest effect of any known gene on the pheromone signal, and it was therefore likely to be a major contributor to noise (Chasse et al., 2006). Second, Sst2 acts early in the pathway and any effects on noise were likely to be propagated (amplified) to downstream events, adding substantially to the variability of the final readout. Third, Sst2 expression is induced following pheromone stimulation and, consequently, signaling is attenuated over time. Theoretical analysis, based on stochastic models, had predicted that such feedback inhibition events would improve noise filtering (Becskei and Serrano, 2000; Dublanche et al., 2006; Thattai and van Oudenaarden, 2001). Thus, Sst2 represented an opportunity to test some longstanding theories about the origins of cell-to-cell variability. Fourth, Sst2 regulates both branches of the pheromone signaling pathway. While gene expression is the most common and convenient measure of cellular noise, it seemed likely that noise would impact other cellular responses such as chemotropism and morphogenesis. Finally, whereas transcriptional changes occur over minutes, changes in cell morphology can take much longer. A good understanding of the various time scales of pathway output is necessary to fully understand the causes and consequences of noise regulation (Purvis and Lahav, 2013).
One conclusion of our work is that noise is dynamically regulated. Whereas past studies have focused on noise under standard (unstimulated) growth conditions, we show that Sst2 regulates noise in both the presence and absence of a pheromone stimulus. This is important because noise levels may confer enhanced phenotypic diversity when cells are challenged by various environmental cues (Avery, 2006). Moreover we show that transcriptional noise increases and then decreases with prolonged pathway activation, and that these trends persist at various doses of pheromone. Our model predicts that prior to pheromone stimulation, noise is suppressed by Sst2 because the GAP activity of this protein ensures that basal MAPK activity is minimal. Therefore, variability due to fluctuations in upstream pathway components (both activity and abundance) is not propagated through the pathway. Treatment with pheromone “unmasks” these pathway specific fluctuations leading to an increase in cell to cell variability.
Another aspect of our work is the attention paid to cellular morphogenesis. Whereas previous investigations have focused on transcriptional noise, we also analyzed variations in cellular morphogenesis, through Cdc42 activation of projection formation in single cells. Indeed, our analysis of gradient tracking and of mating projection formation indicates that pheromone super-sensitivity, by itself, does not impede mating (Jackson and Hartwell, 1990). Rather, morphological variability, random changes in polarization, and an inability track a gradient can account for the overall deficiency in mating. Thus we consider noise suppression to be biologically significant in yeast. Given the broad conservation of G protein signaling, noise suppression by RGS proteins is likely to be biologically significant in plants and in animals including humans.
The third, and perhaps most important, advance is the realization that noise suppression and signal suppression are not linked in an obligate manner. By selectively uncoupling Sst2 from its two known binding partners, in each case by a single amino acid substitution, we identified conditions that produce equivalent signal outputs but widely different noise characteristics. To our knowledge there is no other example of a system that exhibits these characteristics. In this regard, it was surprising to us that cellular noise suppression mechanisms can be so easily subverted, and that there are so few redundancies to buffer such behaviors.
While it is clear that signal and noise suppression are mediated by Sst2-GAP activity, the mechanism by which Sst2-receptor interaction suppresses signaling remains to be addressed. Another question is how changes in noise, particularly transient increases or decreases in noise such as those reported here, might benefit the population. Theoretical work has suggested that phenotypic variation may be particularly useful in a rapidly changing environment (Kussell and Leibler, 2005; Thattai and van Oudenaarden, 2004). Accordingly, noise in the pheromone response might allow a portion of cells to delay responses to the mating signal and continue cell proliferation. These proliferating cells will not mate, but would be at a growth advantage if there were no suitable mating partner to be found. Thus extrinsic sources of noise may serve as both an impediment to predictable behavior as well as a means to promote survival in uncertain growth conditions.
Finally, the realization that an RGS protein can function as a noise suppressor is significant because it represents a new function for a well-established signaling protein. Insofar as these findings may represent a general activity of RGS proteins, they are potentially important in understanding human physiology and pharmacology. RGS4, the protein most closely related to Sst2, has been proposed as a drug target for the treatment of schizophrenia and Parkinson's disease among other disorders (Gu et al., 2007; Roman et al., 2007). Given that any drug should confer a predictable response, the potential of RGS proteins as drug targets should be carefully considered.
In conclusion, noise in biological systems has long been recognized, but it has been difficult to understand its causes and functional consequences. Investigating the sources of such behaviors is made especially difficult given the challenges of studying a phenomenon that is - by definition - unpredictable. Only by removing noise control mechanisms, as we have done here, can we begin to understand what happens if noise suppression fails and such variations occur unchecked. In this regard, our experimental platform will allow investigators to analyze the properties of a well-defined signaling pathway under high noise conditions, and to evaluate the performance and efficiency of cellular decision-making systems that rely on noisy chemical cues and imprecise information. A deeper understanding of the processes that suppress noise will allow us to eventually develop a theoretical framework for predicting their occurrence.
Experimental Procedures
Strains, Plasmids and Growth of Cultures
Standard procedures for the growth, maintenance and transformation of yeast and bacteria were used throughout. The yeast (Saccharomyces cerevisiae) strains used in this study were BY4742 (MATα leu2Δ lysΔ his3-1 ura3Δ), BY4741 (MATa leu2Δ met15Δ his3-1 ura3Δ) and its derivatives (Brachmann et al., 1998). A table of strains, plasmids, and primers as well as details of plasmid construction can be found in Supplemental Experimental Procedures. All cells were grown at 30°C in yeast extract peptone medium (YPD) or synthetic complete medium (SC) containing 2% (w/v) dextrose. Plasmid-transformed cells were grown in synthetic complete medium that lacked the appropriate nutrient.
Pheromone Sensitivity Assays
Pheromone sensitivity was measured as growth inhibition using an agar diffusion (halo) bioassay (Sprague, 1991) and by a transcriptional reporter assay (Hoffman et al., 2002) as described earlier. Briefly for the halo assay, filters were spotted with 0, 5, 15 or 50 μg α factor and laid onto cells mixed with soft agar. For the transcriptional reporter assay, cells transformed with pRS423FUS1-LacZ were stimulated with different doses of pheromone for 90 min and β-galactosidase activity was measured spectrofluorometrically.
Quantitative Mating Efficiency Assay
Mating efficiency assays were conducted as described earlier (Sprague, 1991). Briefly MATa (BY4741) and MATα (BY4742) cells were grown to mid log phase, counted and mixed in equal numbers, allowed to adhere to nitrocellulose discs (Millipore) and incubated on YPD plates for 4 h. Subsequently, cells were harvested and plated onto diploid selective (SCD-Met-Lys) and non-selective plates (SCD). Mating efficiency was calculated by dividing the number of diploid colonies from the total number of colonies.
Cell Extract Preparation and Immunoblotting
Briefly, cells either untreated or treated with α factor for different durations (2, 5, 15, 30, 60 and 90 min) were harvested in TCA (5% final concentration), washed with 10 mM NaN3, collected by centrifugation and the resulting pellets frozen at -80°C. For MAPK inactivation measurements, cells were treated with 3 μM α factor for 30 min, harvested by centrifugation, washed once, resuspended in pheromone-free medium and harvested at the times indicated. Cell extracts were prepared by glass bead lysis in TCA as described before (Hao et al., 2007). Protein concentration was determined by Dc protein assay (Bio-Rad). Proteins were resolved by 10% SDS-PAGE, transferred to nitrocellulose and detected by immunoblotting with p44/42 MAPK antibodies at 1:500 (9101L, Cell Signalling Technology), Fus3 antibodies at 1:500 (sc-6773, Santa Cruz Biotechnology, inc.) and anti-G6PDH at 1:50,000 (A9521, Sigma-Aldrich). Immunoreactive species were detected by chemiluminescence detection (Thermo Scientific Pierce ECL Plus) of horseradish peroxidase-conjugated antibodies (anti-rabbit, 170-5046 or anti-goat,sc-2768, Santa Cruz) at 1:10,000. Blots were scanned using Typhoon Trio+ (GE healthcare) and band intensity was quantified using Fiji (National Institute of Health).
Single Cell Transcription Reporter Assay in Microfluidics Chambers
A microfluidics device similar to the one described earlier was constructed (Hao et al., 2008). Cells containing the two reporters (pathway specific GFP and reference mCherry) were grown to A600nm ∼0.4 after maintaining them at exponential growth for at least 12-15 h. Cells were then loaded onto the microfluidics chamber ensuring a dispersed distribution of cells and stimulated with 150 nM pheromone (high dose for the chamber). The response was monitored by imaging DIC, GFP (488 laser) and mCherry (561 laser) every 6 min (unless otherwise noted) for 150 min. A 60X PlanApo objective under oil immersion was used and images were captured by an Olympus Spinning disc confocal microscope equipped with a motorized XYZ stage and EM CCD camera. MetaMorph software (Universal Imaging Corporation, Downington, PA) was used for image acquisition. Image quantification was done using SchnitzCell (Matlab) software (Elowitz et al., 2002), but with custom modifications made mainly to the segmentation code to allow detection of yeast that are of varied morphology compared to bacterial cells. Relative green fluorescence was calculated by dividing the GFP intensity by the mCherry intensity. Noise was calculated as the coefficient of variation (CV) of the relative fluorescence of the population. Note that we tracked individual cells over time and did not include new cells resulting from cell division. Thus the number of cells through the experiment remained constant.
Analysis of polarization during gradient tracking and shmooing
Early-mid log phase yeast cells containing the polarity marker Bem1-GFP were grown and loaded onto a microfluidics chamber as described above. A pheromone gradient was generated as described previously (Hao et al., 2008). The specific dose of pheromone used to generate the gradient varied depending upon the pheromone sensitivity of the strain. Uniform pheromone (300 nM) was used for analysis of polarization during shmooing. Details of the image analysis are provided in Supplemental Experimental Procedures.
Mathematical modeling
Stochastic simulations were run using BioNets to generate an executable file (Adalsteinsson et al., 2004). The executable, when called, runs the Gillespie algorithm for a particular set of reactions. A custom MATLAB (Mathworks) script was developed in order to quickly run an ensemble of simulations for a given parameter set(s) while easily keeping track of the results. The reactions, as well as parameter values, used for the model for calculating CV are provided in Table S4 of Supplemental Information. Parameters were derived from the literature whenever possible (Ghaemmaghami et al., 2003). Parameters were further optimized to find those that best matched the data. Parameters were optimized by random selection from a log10 normal distribution, where the mean was taken as the literature-derived values and the standard deviation was taken as 0.5. For each parameter set an ensemble of 50 simulations was run. For each of the 50 ensemble simulations, and to model cell-to-cell variability, the total levels for G protein and MAPKs were chosen randomly from a normal distribution where the average was taken from literature derived values and the standard deviation was set to 30%. To find the parameter sets that best agreed with the data, parameters were searched for those that gave the smallest RMS distance between the observed CV for both the wild type and sst2Δ cases. We also explored the potential of several other simple models that did not rely on cell-to-cell variability, to reproduce our observed CV. The details of these simulations can be found in Supplemental Experimental Procedures. These other simple models did not give the increase in CV over time under pheromone stimulation.
Supplementary Material
Figure S1: gpa1G302S and sst2Q304N are equally sensitive to pheromone
(A) Time course of phospho-MAPK activation: Wild type cells and mutant strains gpa1G302S or sst2Q304N were treated with 3 μM α factor and samples collected at the indicated times. MAPK activation was determined by immunoblotting with phospho-p44/42 (P-Fus3, P-Kss1), Fus3 C terminal (Fus3) and G6PDH (Load) antibodies (left). Densitometry of P-Fus3 bands normalized to the loading control (right). Results show the mean ± SEM for three individual experiments.
(B) Halo Assay to measure pheromone induced growth arrest. Disks were spotted with 0, 5, 15 and 50 μg α factor. (Related to Figure 1)
Figure S2: Noise analysis of pheromone pathway specific gene expression.
(A) Scatter plots demonstrating pheromone pathway specific (FUS1-GFP) and pathway independent (ADH1-mCherry) noise in wild type and sst2Δ cells. Each point represents the mean fluorescence intensities from one cell.
(B) Change in CV over time in the absence of pheromone in wild type and sst2Δ cells. Fluorescence and CV measurements were made every 3 min.
(C) Single cell traces of relative GFP (GFP fluorescence/mCherry fluorescence) for wild type, sst2Δ, sst2Q304N and gpa1G302S cells over time after treatment with 150 nM α factor. Data represent traces from one experiment with approximately 35-50 cells per condition. To plot the data for each strain on the same Y axis, raw values were normalized such that the mean relative fluorescence at the final time point was assigned a value of 10.
(D) Dynamic changes in CV over time following treatment with 150 nM α factor. Fluorescence and CV measurements were made either every 3 min or every 6 min. Three replicates are shown for wild type and sst2Δ cells and two replicates are shown for sst2Q304N and gpa1G302S cells.
(E) Increase in CV in wild type cells upon α factor treatment is sustained when cells are treated with a low dose of pheromone (left). Cells were stimulated with either 50 nM (low) or 150 nM (high) α factor and imaged every 3 min. CV was calculated as ‘standard deviation of mean GFP’ (mCherry normalized) (middle) divided by the ‘mean GFP’ (mCherry normalized) over time (right). Note that the mean (mCherry normalized) GFP is the same at low and high doses of pheromone. The GFP reporter is driven by the α factor-inducible FUS1 promoter, which is expected to be maximally induced at both high and low concentrations of stimulus.
(F) sst2Δ cells exhibit sustained high CV when treated with a low dose of pheromone (left). sst2Δ cells were stimulated with either 1 nM (low dose) or 10 nM (high dose) α factor and imaged every 6 min. CV was calculated as standard deviation of mean (mCherry normalized) GFP (middle) divided by the mean (mCherry normalized) GFP (right). Note that the initial mean fluorescence and standard deviation are different at the two doses owing to differences in the laser power outputs for the microscope on separate days.
(G) Sst2-receptor binding at the membrane is initiated 30 min post pheromone stimulation. Wild type cells expressing GFP-tagged Sst2 were either left untreated or treated with 10 μM (saturating dose) α factor in a shaking culture flask. Samples were collected and imaged on agar pads for Sst2-GFP at the indicated times. Representative GFP (inverted fluorescence) images are shown for each time with the percentage of cells demonstrating Sst2-membrane localization at the bottom of each image. Arrows point to membrane polarized Sst2-GFP. Scale bars, 5 μm. (Related to Figure 2)
Figure S3: Alternative models tested (left) and corresponding simulations (right) that were unable to capture the dynamic changes in CV of the GFP reporter in wild type cells *φ.
(A) Model of pathway activation that includes the core signaling cascade: G-αβγ, Fus3, Sst2, mRNA, and GFP (left). Simulations of dynamic changes in CV for wild type cells using the basic activation model (middle). Simulations of dynamic changes in CV for wild type cells using the basic activation model with variability in protein abundance (right). Single cell traces of relative (FUS1 promoter driven) GFP over time in wild type cells simulated by the basic activation model with variability in protein abundance. The initial trajectories generated by the model have shapes that are in agreement with the data shown in Figures 2C and S2C (bottom right).
(B) Model of pathway activation that includes pheromone mediated stabilization or destabilization of Fus3 in the core signaling cascade (left). Simulations of dynamic changes in CV for wild type cells with the stabilization/destabilization (of Fus3) model (right).
(C) Model of pathway activation that includes positive feedback where activated Fus3 leads to synthesis of more Fus3 in the core signaling cascade (left). Simulations of dynamic changes in CV for wild type cells using the positive feedback model (right).
(D) Model of pathway activation that includes negative feedback whereby Fus3 increases Sst2 levels, which in turn lowers G protein activity in the core signaling cascade (left). Simulations of dynamic changes in CV for wild type cells using the negative feedback model (right). (Related to Figure 2)
* All four models incorporate intrinsic fluctuations due to the random nature of biochemical reactions in the cell. Models B, C and D do not include any cell-to-cell variability in initial protein levels. None of the models include fluctuations that may be present on long time scales.
φ For each of these models 50 parameter sets were chosen from a normal distribution centering on average values derived from the literature. For each model the 50 simulations were grouped using the MATLAB kmeans clustering algorithm with the “distance” option set to “correlation”.
Figure S4: Sst2 limits heterogeneity in pheromone dependent cell fate (morphology).
Wild type (left) and sst2Δ cells (right) were treated with the indicated doses of pheromone in a microfluidic chamber and morphological fates of individual cells were tracked every hour up to 10 h. Cells were categorized as follows: (1) vegetative (G1/S/G2/M): budding or small rounded , (2) worm or peanut (elongating): arise from a slight constriction at the polar cap followed by an elongation in that direction over time , (3) shmoo-worm hybrid: arise when cells shmoo once and subsequently initiate elongation perpendicular to the shmoo, (4) enlarged (circular or ellipse): arise when cells grow in size without polarization, (5) shmoo: (one, two or three well defined constricted projections), and (6) irregular (undefined shapes): arise due to cell expansion and random changes in the direction of polarization over time. Key shows representative images for each morphological class. Each graph contains data from one experiment with at least 100 cells monitored over time. Scale bar, 5 μm. (Related to Figures 3 & 4).
Table S1: Table of strains used in this study
Table S2: Table of plasmids used in this study
Table S3: Table of oligonucleotide primer sequences
Table S4: Model parameter values and reactions
Supplemental Movie S1: Movie showing wild type, sst2Δ, sst2Q304N and gpa1G302S cells (merged DIC and Bem1-GFP) responding to saturating dose of α-factor (300 nM) in a microfluidic chamber. Cells were imaged at 5 min intervals for 4 h as described in the experimental procedures. (Related to Figure 4)
Highlights.
RGS-GAP activity suppresses variability in transcription and morphogenesis
RGS-GAP activity is required to maintain cell polarization and track a gradient
Noise in gene induction is dynamically regulated
Signal suppression and noise suppression can occur independently
Acknowledgments
We thank Laura Hall for her early contributions to this project. We thank Meng Jin for help with data analysis.
Funding: This work was supported by NIH grant GM080739 to H.G.D and GM079271 to T.C.E.
Footnotes
Author contributions: G.D., J.B.K., J.R.H., T.C.E., and H.G.D. designed research; G.D., J.B.K., and J.R.H. performed research; G.D., J.B.K., J.R.H., T.C.E., H.G.D. analyzed data; G.D. and H.G.D. wrote the manuscript.
Competing Interests: The authors declare no conflict of interest.
Publisher's Disclaimer: This is a PDF file of an unedited manuscript that has been accepted for publication. As a service to our customers we are providing this early version of the manuscript. The manuscript will undergo copyediting, typesetting, and review of the resulting proof before it is published in its final form. Please note that during the production process errors may be discovered which could affect the content, and all legal disclaimers that apply to the journal pertain.
References
- Adalsteinsson D, McMillen D, Elston TC. Biochemical Network Stochastic Simulator (BioNetS): software for stochastic modeling of biochemical networks. BMC Bioinformatics. 2004;5:24. doi: 10.1186/1471-2105-5-24. [DOI] [PMC free article] [PubMed] [Google Scholar]
- Apanovitch DM, Iiri T, Karasawa T, Bourne HR, Dohlman HG. Second site suppressor mutations of a GTPase-deficient G-protein alpha-subunit. Selective inhibition of Gbeta gamma-mediated signaling. The Journal of biological chemistry. 1998;273:28597–28602. doi: 10.1074/jbc.273.44.28597. [DOI] [PubMed] [Google Scholar]
- Avery SV. Microbial cell individuality and the underlying sources of heterogeneity. Nature reviews Microbiology. 2006;4:577–587. doi: 10.1038/nrmicro1460. [DOI] [PubMed] [Google Scholar]
- Ballon DR, Flanary PL, Gladue DP, Konopka JB, Dohlman HG, Thorner J. DEP-domain-mediated regulation of GPCR signaling responses. Cell. 2006;126:1079–1093. doi: 10.1016/j.cell.2006.07.030. [DOI] [PubMed] [Google Scholar]
- Becskei A, Kaufmann BB, van Oudenaarden A. Contributions of low molecule number and chromosomal positioning to stochastic gene expression. Nat Genet. 2005;37:937–944. doi: 10.1038/ng1616. [DOI] [PubMed] [Google Scholar]
- Becskei A, Serrano L. Engineering stability in gene networks by autoregulation. Nature. 2000;405:590–593. doi: 10.1038/35014651. [DOI] [PubMed] [Google Scholar]
- Brachmann CB, Davies A, Cost GJ, Caputo E, Li J, Hieter P, Boeke JD. Designer deletion strains derived from Saccharomyces cerevisiae S288C: a useful set of strains and plasmids for PCR-mediated gene disruption and other applications. Yeast. 1998;14:115–132. doi: 10.1002/(SICI)1097-0061(19980130)14:2<115::AID-YEA204>3.0.CO;2-2. [DOI] [PubMed] [Google Scholar]
- Chasse SA, Flanary P, Parnell SC, Hao N, Cha JY, Siderovski DP, Dohlman HG. Genome-scale analysis reveals Sst2 as the principal regulator of mating pheromone signaling in the yeast Saccharomyces cerevisiae. Eukaryotic cell. 2006;5:330–346. doi: 10.1128/EC.5.2.330-346.2006. [DOI] [PMC free article] [PubMed] [Google Scholar]
- Colman-Lerner A, Gordon A, Serra E, Chin T, Resnekov O, Endy D, Pesce CG, Brent R. Regulated cell-to-cell variation in a cell-fate decision system. Nature. 2005;437:699–706. doi: 10.1038/nature03998. [DOI] [PubMed] [Google Scholar]
- DiBello PR, Garrison TR, Apanovitch DM, Hoffman G, Shuey DJ, Mason K, Cockett MI, Dohlman HG. Selective uncoupling of RGS action by a single point mutation in the G protein alpha-subunit. The Journal of biological chemistry. 1998;273:5780–5784. doi: 10.1074/jbc.273.10.5780. [DOI] [PubMed] [Google Scholar]
- Dohlman HG, Song J, Ma D, Courchesne WE, Thorner J. Sst2, a negative regulator of pheromone signaling in the yeast Saccharomyces cerevisiae: expression, localization, and genetic interaction and physical association with Gpa1 (the G-protein alpha subunit) Molecular and cellular biology. 1996;16:5194–5209. doi: 10.1128/mcb.16.9.5194. [DOI] [PMC free article] [PubMed] [Google Scholar]
- Dohlman HG, Thorner JW. Regulation of G protein-initiated signal transduction in yeast: paradigms and principles. Annu Rev Biochem. 2001;70:703–754. doi: 10.1146/annurev.biochem.70.1.703. [DOI] [PubMed] [Google Scholar]
- Dublanche Y, Michalodimitrakis K, Kummerer N, Foglierini M, Serrano L. Noise in transcription negative feedback loops: simulation and experimental analysis. Molecular systems biology. 2006;2:41. doi: 10.1038/msb4100081. [DOI] [PMC free article] [PubMed] [Google Scholar]
- Elowitz MB, Levine AJ, Siggia ED, Swain PS. Stochastic gene expression in a single cell. Science. 2002;297:1183–1186. doi: 10.1126/science.1070919. [DOI] [PubMed] [Google Scholar]
- Erdman S, Lin L, Malczynski M, Snyder M. Pheromone-regulated genes required for yeast mating differentiation. The Journal of cell biology. 1998;140:461–483. doi: 10.1083/jcb.140.3.461. [DOI] [PMC free article] [PubMed] [Google Scholar]
- Fraser HB, Hirsh AE, Giaever G, Kumm J, Eisen MB. Noise minimization in eukaryotic gene expression. PLoS biology. 2004;2:e137. doi: 10.1371/journal.pbio.0020137. [DOI] [PMC free article] [PubMed] [Google Scholar]
- Ghaemmaghami S, Huh WK, Bower K, Howson RW, Belle A, Dephoure N, O'Shea EK, Weissman JS. Global analysis of protein expression in yeast. Nature. 2003;425:737–741. doi: 10.1038/nature02046. [DOI] [PubMed] [Google Scholar]
- Gu Z, Jiang Q, Yan Z. RGS4 modulates serotonin signaling in prefrontal cortex and links to serotonin dysfunction in a rat model of schizophrenia. Molecular pharmacology. 2007;71:1030–1039. doi: 10.1124/mol.106.032490. [DOI] [PubMed] [Google Scholar]
- Hao N, Behar M, Parnell SC, Torres MP, Borchers CH, Elston TC, Dohlman HG. A systems-biology analysis of feedback inhibition in the Sho1 osmotic-stress-response pathway. Curr Biol. 2007;17:659–667. doi: 10.1016/j.cub.2007.02.044. [DOI] [PubMed] [Google Scholar]
- Hao N, Nayak S, Behar M, Shanks RH, Nagiec MJ, Errede B, Hasty J, Elston TC, Dohlman HG. Regulation of cell signaling dynamics by the protein kinase-scaffold Ste5. Mol Cell. 2008;30:649–656. doi: 10.1016/j.molcel.2008.04.016. [DOI] [PMC free article] [PubMed] [Google Scholar]
- Hoffman GA, Garrison TR, Dohlman HG. Analysis of RGS proteins in Saccharomyces cerevisiae. Methods Enzymol. 2002;344:617–631. doi: 10.1016/s0076-6879(02)44744-1. [DOI] [PubMed] [Google Scholar]
- Jackson CL, Hartwell LH. Courtship in S. cerevisiae: both cell types choose mating partners by responding to the strongest pheromone signal. Cell. 1990;63:1039–1051. doi: 10.1016/0092-8674(90)90507-b. [DOI] [PubMed] [Google Scholar]
- Kussell E, Leibler S. Phenotypic diversity, population growth, and information in fluctuating environments. Science. 2005;309:2075–2078. doi: 10.1126/science.1114383. [DOI] [PubMed] [Google Scholar]
- Lobner-Olesen A. Distribution of minichromosomes in individual Escherichia coli cells: implications for replication control. The EMBO journal. 1999;18:1712–1721. doi: 10.1093/emboj/18.6.1712. [DOI] [PMC free article] [PubMed] [Google Scholar]
- Madden K, Snyder M. Cell polarity and morphogenesis in budding yeast. Annual review of microbiology. 1998;52:687–744. doi: 10.1146/annurev.micro.52.1.687. [DOI] [PubMed] [Google Scholar]
- Maheshri N, O'Shea EK. Living with noisy genes: how cells function reliably with inherent variability in gene expression. Annual review of biophysics and biomolecular structure. 2007;36:413–434. doi: 10.1146/annurev.biophys.36.040306.132705. [DOI] [PubMed] [Google Scholar]
- McAdams HH, Arkin A. It's a noisy business! Genetic regulation at the nanomolar scale. Trends in genetics : TIG. 1999;15:65–69. doi: 10.1016/s0168-9525(98)01659-x. [DOI] [PubMed] [Google Scholar]
- McCullagh E, Seshan A, El-Samad H, Madhani HD. Coordinate control of gene expression noise and interchromosomal interactions in a MAP kinase pathway. Nature cell biology. 2010;12:954–962. doi: 10.1038/ncb2097. [DOI] [PMC free article] [PubMed] [Google Scholar]
- Moskow JJ, Gladfelter AS, Lamson RE, Pryciak PM, Lew DJ. Role of Cdc42p in pheromone-stimulated signal transduction in Saccharomyces cerevisiae. Molecular and cellular biology. 2000;20:7559–7571. doi: 10.1128/mcb.20.20.7559-7571.2000. [DOI] [PMC free article] [PubMed] [Google Scholar]
- Neves SR, Ram PT, Iyengar R. G protein pathways. Science. 2002;296:1636–1639. doi: 10.1126/science.1071550. [DOI] [PubMed] [Google Scholar]
- Newman JR, Ghaemmaghami S, Ihmels J, Breslow DK, Noble M, DeRisi JL, Weissman JS. Single-cell proteomic analysis of S. cerevisiae reveals the architecture of biological noise. Nature. 2006;441:840–846. doi: 10.1038/nature04785. [DOI] [PubMed] [Google Scholar]
- Pruyne D, Bretscher A. Polarization of cell growth in yeast. I. Establishment and maintenance of polarity states. Journal of cell science. 2000;113(Pt 3):365–375. doi: 10.1242/jcs.113.3.365. [DOI] [PubMed] [Google Scholar]
- Purvis JE, Lahav G. Encoding and decoding cellular information through signaling dynamics. Cell. 2013;152:945–956. doi: 10.1016/j.cell.2013.02.005. [DOI] [PMC free article] [PubMed] [Google Scholar]
- Raser JM, O'Shea EK. Control of stochasticity in eukaryotic gene expression. Science. 2004;304:1811–1814. doi: 10.1126/science.1098641. [DOI] [PMC free article] [PubMed] [Google Scholar]
- Raser JM, O'Shea EK. Noise in gene expression: origins, consequences, and control. Science. 2005;309:2010–2013. doi: 10.1126/science.1105891. [DOI] [PMC free article] [PubMed] [Google Scholar]
- Ricicova M, Hamidi M, Quiring A, Niemisto A, Emberly E, Hansen CL. Dissecting genealogy and cell cycle as sources of cell-to-cell variability in MAPK signaling using high-throughput lineage tracking. Proceedings of the National Academy of Sciences of the United States of America. 2013;110:11403–11408. doi: 10.1073/pnas.1215850110. [DOI] [PMC free article] [PubMed] [Google Scholar]
- Roman DL, Talbot JN, Roof RA, Sunahara RK, Traynor JR, Neubig RR. Identification of small-molecule inhibitors of RGS4 using a high-throughput flow cytometry protein interaction assay. Molecular pharmacology. 2007;71:169–175. doi: 10.1124/mol.106.028670. [DOI] [PubMed] [Google Scholar]
- Segall JE. Polarization of yeast cells in spatial gradients of alpha mating factor. Proceedings of the National Academy of Sciences of the United States of America. 1993;90:8332–8336. doi: 10.1073/pnas.90.18.8332. [DOI] [PMC free article] [PubMed] [Google Scholar]
- Siekhaus DE, Drubin DG. Spontaneous receptor-independent heterotrimeric G-protein signalling in an RGS mutant. Nat Cell Biol. 2003;5:231–235. doi: 10.1038/ncb941. [DOI] [PubMed] [Google Scholar]
- Sprague GF., Jr Assay of yeast mating reaction. Methods Enzymol. 1991;194:77–93. doi: 10.1016/0076-6879(91)94008-z. [DOI] [PubMed] [Google Scholar]
- Thattai M, van Oudenaarden A. Intrinsic noise in gene regulatory networks. Proc Natl Acad Sci U S A. 2001;98:8614–8619. doi: 10.1073/pnas.151588598. [DOI] [PMC free article] [PubMed] [Google Scholar]
- Thattai M, van Oudenaarden A. Stochastic gene expression in fluctuating environments. Genetics. 2004;167:523–530. doi: 10.1534/genetics.167.1.523. [DOI] [PMC free article] [PubMed] [Google Scholar]
- Volfson D, Marciniak J, Blake WJ, Ostroff N, Tsimring LS, Hasty J. Origins of extrinsic variability in eukaryotic gene expression. Nature. 2006;439:861–864. doi: 10.1038/nature04281. [DOI] [PubMed] [Google Scholar]
Associated Data
This section collects any data citations, data availability statements, or supplementary materials included in this article.
Supplementary Materials
Figure S1: gpa1G302S and sst2Q304N are equally sensitive to pheromone
(A) Time course of phospho-MAPK activation: Wild type cells and mutant strains gpa1G302S or sst2Q304N were treated with 3 μM α factor and samples collected at the indicated times. MAPK activation was determined by immunoblotting with phospho-p44/42 (P-Fus3, P-Kss1), Fus3 C terminal (Fus3) and G6PDH (Load) antibodies (left). Densitometry of P-Fus3 bands normalized to the loading control (right). Results show the mean ± SEM for three individual experiments.
(B) Halo Assay to measure pheromone induced growth arrest. Disks were spotted with 0, 5, 15 and 50 μg α factor. (Related to Figure 1)
Figure S2: Noise analysis of pheromone pathway specific gene expression.
(A) Scatter plots demonstrating pheromone pathway specific (FUS1-GFP) and pathway independent (ADH1-mCherry) noise in wild type and sst2Δ cells. Each point represents the mean fluorescence intensities from one cell.
(B) Change in CV over time in the absence of pheromone in wild type and sst2Δ cells. Fluorescence and CV measurements were made every 3 min.
(C) Single cell traces of relative GFP (GFP fluorescence/mCherry fluorescence) for wild type, sst2Δ, sst2Q304N and gpa1G302S cells over time after treatment with 150 nM α factor. Data represent traces from one experiment with approximately 35-50 cells per condition. To plot the data for each strain on the same Y axis, raw values were normalized such that the mean relative fluorescence at the final time point was assigned a value of 10.
(D) Dynamic changes in CV over time following treatment with 150 nM α factor. Fluorescence and CV measurements were made either every 3 min or every 6 min. Three replicates are shown for wild type and sst2Δ cells and two replicates are shown for sst2Q304N and gpa1G302S cells.
(E) Increase in CV in wild type cells upon α factor treatment is sustained when cells are treated with a low dose of pheromone (left). Cells were stimulated with either 50 nM (low) or 150 nM (high) α factor and imaged every 3 min. CV was calculated as ‘standard deviation of mean GFP’ (mCherry normalized) (middle) divided by the ‘mean GFP’ (mCherry normalized) over time (right). Note that the mean (mCherry normalized) GFP is the same at low and high doses of pheromone. The GFP reporter is driven by the α factor-inducible FUS1 promoter, which is expected to be maximally induced at both high and low concentrations of stimulus.
(F) sst2Δ cells exhibit sustained high CV when treated with a low dose of pheromone (left). sst2Δ cells were stimulated with either 1 nM (low dose) or 10 nM (high dose) α factor and imaged every 6 min. CV was calculated as standard deviation of mean (mCherry normalized) GFP (middle) divided by the mean (mCherry normalized) GFP (right). Note that the initial mean fluorescence and standard deviation are different at the two doses owing to differences in the laser power outputs for the microscope on separate days.
(G) Sst2-receptor binding at the membrane is initiated 30 min post pheromone stimulation. Wild type cells expressing GFP-tagged Sst2 were either left untreated or treated with 10 μM (saturating dose) α factor in a shaking culture flask. Samples were collected and imaged on agar pads for Sst2-GFP at the indicated times. Representative GFP (inverted fluorescence) images are shown for each time with the percentage of cells demonstrating Sst2-membrane localization at the bottom of each image. Arrows point to membrane polarized Sst2-GFP. Scale bars, 5 μm. (Related to Figure 2)
Figure S3: Alternative models tested (left) and corresponding simulations (right) that were unable to capture the dynamic changes in CV of the GFP reporter in wild type cells *φ.
(A) Model of pathway activation that includes the core signaling cascade: G-αβγ, Fus3, Sst2, mRNA, and GFP (left). Simulations of dynamic changes in CV for wild type cells using the basic activation model (middle). Simulations of dynamic changes in CV for wild type cells using the basic activation model with variability in protein abundance (right). Single cell traces of relative (FUS1 promoter driven) GFP over time in wild type cells simulated by the basic activation model with variability in protein abundance. The initial trajectories generated by the model have shapes that are in agreement with the data shown in Figures 2C and S2C (bottom right).
(B) Model of pathway activation that includes pheromone mediated stabilization or destabilization of Fus3 in the core signaling cascade (left). Simulations of dynamic changes in CV for wild type cells with the stabilization/destabilization (of Fus3) model (right).
(C) Model of pathway activation that includes positive feedback where activated Fus3 leads to synthesis of more Fus3 in the core signaling cascade (left). Simulations of dynamic changes in CV for wild type cells using the positive feedback model (right).
(D) Model of pathway activation that includes negative feedback whereby Fus3 increases Sst2 levels, which in turn lowers G protein activity in the core signaling cascade (left). Simulations of dynamic changes in CV for wild type cells using the negative feedback model (right). (Related to Figure 2)
* All four models incorporate intrinsic fluctuations due to the random nature of biochemical reactions in the cell. Models B, C and D do not include any cell-to-cell variability in initial protein levels. None of the models include fluctuations that may be present on long time scales.
φ For each of these models 50 parameter sets were chosen from a normal distribution centering on average values derived from the literature. For each model the 50 simulations were grouped using the MATLAB kmeans clustering algorithm with the “distance” option set to “correlation”.
Figure S4: Sst2 limits heterogeneity in pheromone dependent cell fate (morphology).
Wild type (left) and sst2Δ cells (right) were treated with the indicated doses of pheromone in a microfluidic chamber and morphological fates of individual cells were tracked every hour up to 10 h. Cells were categorized as follows: (1) vegetative (G1/S/G2/M): budding or small rounded , (2) worm or peanut (elongating): arise from a slight constriction at the polar cap followed by an elongation in that direction over time , (3) shmoo-worm hybrid: arise when cells shmoo once and subsequently initiate elongation perpendicular to the shmoo, (4) enlarged (circular or ellipse): arise when cells grow in size without polarization, (5) shmoo: (one, two or three well defined constricted projections), and (6) irregular (undefined shapes): arise due to cell expansion and random changes in the direction of polarization over time. Key shows representative images for each morphological class. Each graph contains data from one experiment with at least 100 cells monitored over time. Scale bar, 5 μm. (Related to Figures 3 & 4).
Table S1: Table of strains used in this study
Table S2: Table of plasmids used in this study
Table S3: Table of oligonucleotide primer sequences
Table S4: Model parameter values and reactions
Supplemental Movie S1: Movie showing wild type, sst2Δ, sst2Q304N and gpa1G302S cells (merged DIC and Bem1-GFP) responding to saturating dose of α-factor (300 nM) in a microfluidic chamber. Cells were imaged at 5 min intervals for 4 h as described in the experimental procedures. (Related to Figure 4)