Abstract
Purpose
To describe the effect of the corneal asphericity and toricity on the map patterns and Best Fit Sphere (BFS) characteristics in elevation topography.
Methods
The corneal surface was modeled as a biconic surface of principal radii and asphericity values of (r1, r2) and (Q1, Q2), respectively. The apex of the biconic surface corresponded to the origin of a polar coordinates system. Minimization of the squared residuals was used to calculate the values of the radii of the best fit spheres (BFS) and apex distance (A-values :z distance between the corneal apex and the BFS) of the modelled corneal surface for various configurations relating to commonly clinical measured values of apical radius, asphericity and toricity.
Results
Increased apical radius of curvature and increased prolateness (negative asphericity) led to an increase in BFS radius, but had opposite effects on the A-value. Increased prolateness resulted in increased BFS radius and A-value. Increasing toricity did not alter these findings. Color-plot elevation maps of the modelled corneal surface showed complete ridge patterns when toricity was increased and showed incomplete ridge and island patterns when prolateness was increased.
Conclusions
High A-values in patients with corneal astigmatism may result from steep apical curvature and/or high prolateness (negative asphericity). The BFS radius may help in distinguishing between these two causes of increased A-values. Increased prolateness and decreased apical radius of curvature (often seen in keratoconus) have opposite effects on the BFS radius but similar effects on the apex distance.
INTRODUCTION
Evaluation of corneal shape is an important aspect in the preoperative assessment of refractive surgery candidates. The representation of the anterior corneal surface can be achieved by elevation or curvature mapping. Although algorithms based on Placido-technology can compute the corneal elevation, direct acquisition of the corneal relief is enabled by slit scanning, rasterstereorgraphy or Scheimpflug imaging. These technologies allow for the acquisition of the spatial coordinates of multiple points from both the anterior and posterior corneal surfaces. The colors on the elevation map represent the height of the analyzed corneal surface with respect to a reference surface1.
Subclinical keratoconus or form-fruste keratoconus remains difficult to identify and carries a risk of ectasia after keratorefractive surgery2-10. Adherence to proper screening may decrease the risk of ectasia, even on eyes with high myopic refractive errors11-12. The development of corneal topographic analysis has enabled ophthalmologists to detect keratoconus suspects and several automated keratoconus-detection systems using several quantitative corneal indices are available13-20. Placido disk-based topography systems are limited to providing information about anterior corneal surface morphologic features. Other systems provide elevation data from both the anterior and the posterior corneal surface. With float or elevation difference maps, subclinical or forme fruste keratoconus are difficult to identify correctly. With surface curvature maps, it may be difficult to determine whether the pattern is associated with an atypical normal condition, a true disease state, or an artifact of alignment or processing.
In KC, the posterior corneal curvature is affected in addition to the anterior corneal surface21-27. Moreover, early morphological changes in eyes with keratoconus may develop on the posterior surface24.
Currently, there are two methods of measuring the posterior corneal surface: the slit-scanning corneal topography (Orbscan by Bausch & Lomb, Rochester, NY, USA) and the 3D-Scheimpflug imaging (Pentacam by Oculus Optikgeräte, Wetzlar, Germany; and Galilei by Ziemer, Port, Switzerland) 28-31. Both methods provide information regarding the anterior and the posterior corneal surfaces as well as the corneal thickness. The colors on the elevation maps represent the height of the analyzed corneal surface relative to a reference surface, which is often chosen as a sphere without positioning constraints (float mode). Therefore, the radius and positioning of the sphere are essential to determine the relative elevation of the corneal surface, as any change in the radius or the alignment of the reference sphere would have a direct impact on the topography map and maximal elevation distance. The anterior and posterior corneal surfaces differ in apical curvature and asphericity32-35, which may alter the respective elevation patterns.
In this study, we modeled the anterior and posterior corneal surfaces using biconic equations. Our approach involved determining the theoretical effects of the apical curvature, asphericity and toricity on the BFS radius and the distance between the BFS and the apex (A-value). We evaluated the theoretical effects of varying these parameters on the color representation of the elevation maps. Our approach could be useful to provide qualitative and quantitative data to better understand the corneal anterior and posterior elevation characteristics in normal and astigmatic corneas versus keratoconus suspects.
MATERIALS AND METHODS
Corneal Surface Modeling
We used a biconic basis surface to represent and adjust the shape of the corneal surfaces. Given that the corneal anterior and posterior surfaces are aspheric; their shape in cross section can be approximated by a conic section36-41, which is defined by two parameters: the apical radius and asphericity. The toricity is usually defined as the variation of the apical curvature of the corneal meridians. Our biconic model which includes four variables (two radii and two conic constants) is fairly complete, contemplating most of the basic optical properties of the cornea42-44. The representation of a corneal surface using the biconic model allows variation of the apical curvature and asphericity of the principal meridians. The toric model has a circular shape (null asphericity) along the two orthogonal meridians of different apical radii.
In our analysis, we studied the effect of varying the apical radii and asphericity values of the principal meridians of the corneal modeled with a biconic surface. Although the value of the asphericity has been reported to vary slightly within the corneal meridians36-38, we used identical numerical asphericity values for the corneal meridians in our simulations.
Analytical determination of the BFS characteristics
I. Influence of Asphericity and Apical Curvature on the BFS Parameters
The corneal surface was modeled by a revolution conic, whose profile is a conic section C(r,Q) of equation (Figure 1):
where r and Q are the apical radius and asphericity (conic constant), respectively. The apex of the profile is at the origin of the polar coordinate system.
Figure 1.
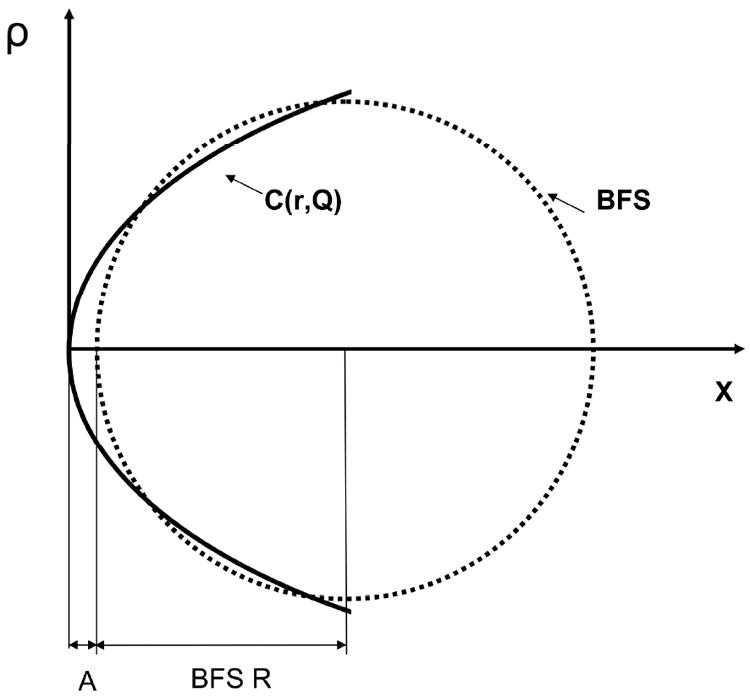
Determination of the Best Fit radius (R) and distance to the apex (A) for a corneal profile modeled as a conic section of apical radius r and asphericity A, respectively.
The profile of a sphere which center is located on (O,x) and which apex is distant from A from the apex of the conoid is a circle described by the following equation;
| (Eq. 1) |
The values of A and R can be determined as those that minimize the following integral which is equivalent to the sum of the squared residuals from the tested conoid to the circle:
| (Eq.2) |
II. Influence of Toricity on BFS Parameters
We modeled the corneas as biconic surfaces. Along an arbitrary meridian, the biconic surface has a conic profile. It comprises two principal meridians whose equations are conic sections of apical radii r1, r2 and asphericity Q1, and Q2, respectively (Figure 2). As the surface is circumnavigated, the apical radius of curvature oscillates between r1 and r2, and the conic constant between Q1 and Q2. The 3 dimensional surface is thus constructed by meridional sinusoidal interpolation. To simplify our calculations, we used a common aspherity Q value for the biconic surfaces (Q=Q1=Q2).
Figure 2.
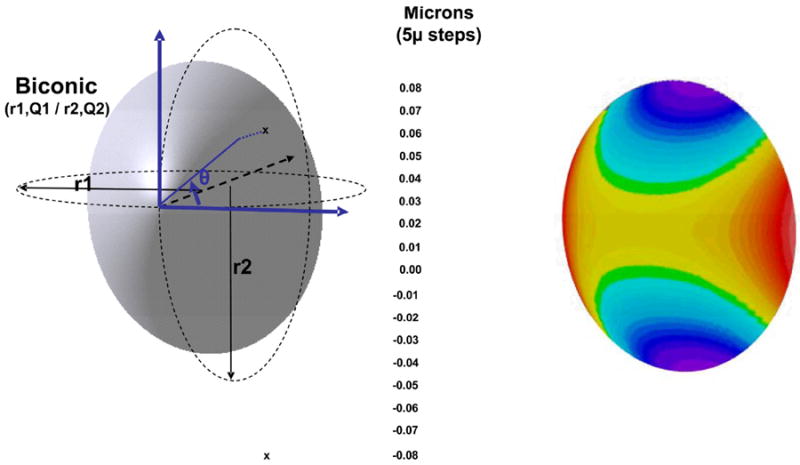
Representation of the elevation map of a corneal surface modeled as a biconic. The flatter and steeper meridians have apical radii of r1 and r2 (r1>r2) and asphericity of Q1 and Q2, respectively. The color scale has a 5 micron steps. This scale is used for the Figures R5 and R6.
The best fit sphere was approximated as the sphere minimizing the sum of the squared residuals with the tested corneal surface modeled by a biconic. We initially determined the radii of the two best fit spheres that correspond to the conoids in the principal meridians.
For each of the two orthogonal revolution conics, each having the profile of one of the principal meridians of the biconic, we generated values for radii of the two BFS, R1 and R2, and the distances, A1 and A2, from the apex of the conoids to their respective BFS. These values served as the starting boundaries for iterative calculations of the best sphere. Least squared fit minimization of the residuals from the tested BFS to the biconic was performed using iterative calculus with Maple 8 software. The numerical tested values of the radius (R) ranged between R1 and R2 and had 0.01 mm increments. The numerical tested values of the distance between the conoid apex and the BFS, A, ranged between A1 and A2 and had 0.5 micron increments. The values for A and R were approximated based on the minimal RMS of the residuals from the tested BFS to the biconic surface. The convergence of the procedure was tested by selecting different starting values outside the R1 to R2 and the A1 to A2 ranges. This did not alter the BFS R and A values.
Once the values of R and A were calculated, the amplitude of the maximal elevation in the 3mm (E3) and 7mm (E7) zones (defined as the distance from the lowest to the highest point relative to the BFS) were calculated. The values chosen for calculation examples corresponded to clinically measured or estimated values of radii of curvature and asphericity of both the posterior and anterior corneal surfaces32-37. Increased toricity and negative asphericity (prolateness) were intended to reflect some of the geometric changes incurred at the anterior and posterior corneal surfaces level in the evolution toward keratoconus.
RESULTS
I. Rotationally Symmetrical Surfaces (Non-toric Revolution Conics)
Influence of the Apical Radius of Curvature on BFS Parameters
-
Figure 3A shows the influence of the apical radius on the distance from the apex to the BFS. For a given surface asphericity, the increase in apical radius (surface flattening) results in an exponential decrease in the distance from the BFS to the apex of the corneal surface (A-value). For the same asphericity (Q=-0.3), the reduction of the apical radius from 8mm to 6.75mm results in a doubling of the A-values.
Figure 4A shows the influence of the apical radius on the Best fit Fit radius. For a given surface asphericity, the increase in apical radius results in a linear increase of the BFS Radius (Table 1).
Figure 3.
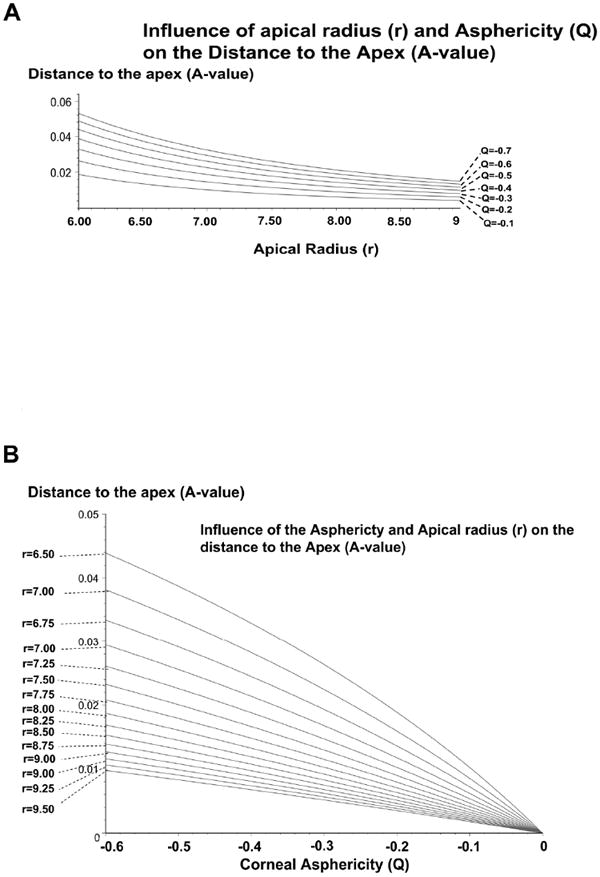
A: Influence of the apical radius of the corneal surface modeled as a revolution conic on the distance between the BFS to the apex. There is a non linear increase of the distance to the apex (anterior elevation) of the BFS radius with the decrease of the apical radius (apical steepening) of the surface.
B: Influence of the asphericty of the corneal surface modeled as a revolution conic on the distance between the BFS to the apex. There is a non linear increase of the distance to the apex (anterior elevation) of the BFS radius with the increase of negative asphericity (increased prolateness) of the surface.
Figure 4.
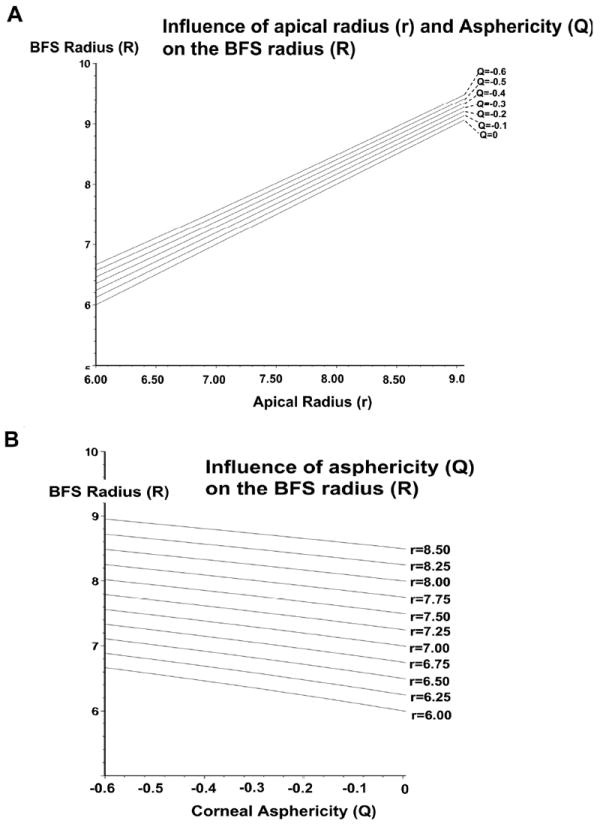
A: Influence of the apical radius of the corneal surface modeled as a revolution conic on the BFS radius. There is a linear increase of the BFS radius with the increase of the apical radius of the surface.
B: Influence of the asphericty of the corneal surface modeled as a revolution conic on radius of the BFS. There is a linear increase of BFS radius of the BFS radius with the increase of negative asphericity (increased prolateness) of the surface.
Table 1.
Effect of Increased Apical Radius of Curvature and Prolateness on BFS Radius and A-value
| BFS Radius | A-Value | |
|---|---|---|
| Increased Apical Radius of Curvature | ↑ | ↓ |
| Increased Prolateness (negative asphericity) | ↑ | ↑ |
Influence of Asphericity on BFS Parameters
Figure 3B shows the influence of the asphericity on the distance from the apex to the BFS (A-value). With increasing prolateness (negative the surface asphericity), the A-value is increased (Table 1). For a corneal surface with an apical radius of 7.75 mm, changing the asphericity from -0.1 to -0.5 results in four-fold increase of the A-value.
Figure 4B shows the influence of the apshericity on the Best fit Fit radius. For a given apical radius of curvature, increase the surface negative asphericity results in a linear increase of the BFS radius (Table 1).
Figure 5 shows elevation plots against their computed BFS for theoretical corneal surface modeled with conicoid surfaces having different apical radii of curvature (5.75mm, 6.75mm, 7.25mm, 8.25mm) and asphericity (-0.2 to -0.8 by 0.2 steps). An island pattern with concentric elevation rings was obtained. The increase of the A-value to the apex with the increase in negative asphericity resulted in a shift toward warm colors centrally, and to cold colors peripherally. For a given apical radius of curvature, the RMS value tend to increase with the prolateness of the corneal surface.
Figure 5.
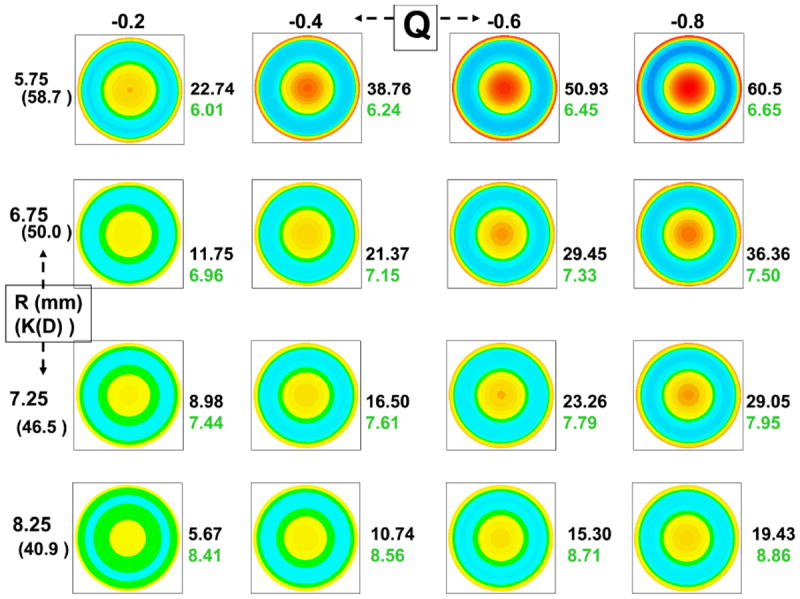
Elevation plots of corneal surface of increasing negative asphericty (X axis) and apical curvature (Y axis). The top row represents surface plots corresponding to steep corneas (apical radius of curvature = 5.75 mm) Q= -0.2 (left), Q= -0.4, Q= -0.6, and Q= -0.8 (right). The plots in rows 2-4 represent surface plots of flatter corneas. All surfaces are rotationally symmetrical. The value of the distance of the apex to the sphere (microns, black font) and the radius of the BFS (mm, green font) are shown to the right of each surface plot.
II. Non-Rotationally Symmetric (Toric Aspheric) Surfaces
Figure 6 shows elevation plots against their computed BFS of theoretical corneal surfaces modeled with conicoids with increasing toricity (horizontal meridian : r1= 7.75mm, vertical meridian r2 :7.75mm, 7.55mm, 7.45mm and 7.25mm) and asphericity (Q varying from -0.2 to -0.8 by 0.2 unit steps). For a given toricity, a slight prolateness of the surface resulted in a ridge pattern that evolved toward an island pattern with further increase in the negative asphericity.
The increase in toricity did only slightly increase the value of the A-value to the apex. The value of the BFS radius was close to the arithmetic mean of the values of the apical radii of the principal meridians. Depending on degree of toricity, increasing the negative asphericity results in an increase or decrease of the 3mm and 7mm maximum amplitude value.
Figure 6.
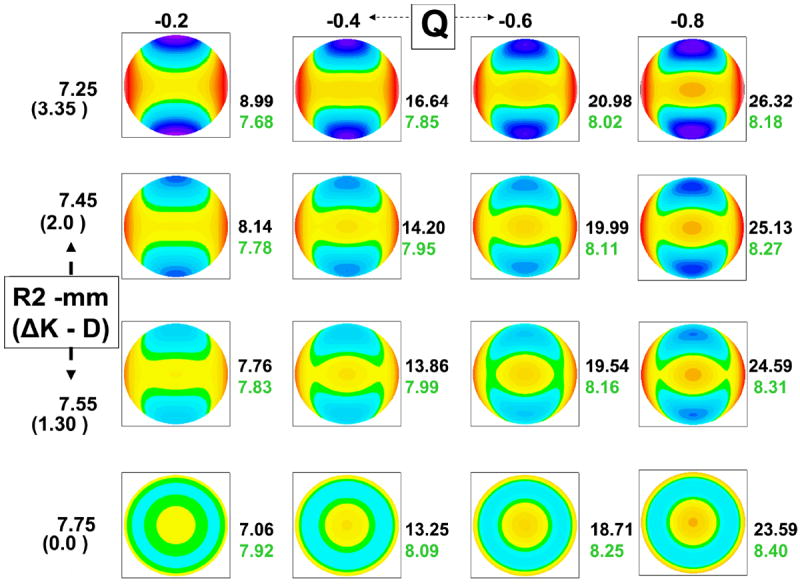
Elevation plots of corneal surface of increasing negative asphericty (X axis) and apical toricity (Y axis). r2 is the apical radius of the vertical meridian and is expressed in mm (the corresponding dioptric power change from the horizontal meridian is shown in parenthesis) along the Y axis. The top row represents corneas with high astigmatism of 3.35 Diopters (r2=7.25 mm). The plots in rows 2-4 represent surface plots of corneas with less astigmatism (2D, 1.3D, and 0 D). The value of the distance of the apex to the sphere (microns, black font) and the radius of the BFS (mm, green font) are shown to the right of each surface plot.
For non-toric corneas, the RMS value from the surfaces of interest to the computed BFS ranged between 0.38 10-3 to 0.16 microns in our numeric calculations. It tends to increase with increased apical curvature, and increased negative asphericity. The maximal elevation amplitude in the central 3 mm zone ranged between 1.23 microns (r=8.25mm, Q=-0.1) and 24.45 microns (r=6.25mm, Q=-0.8). The maximal elevation amplitude in the central 7 mm zone ranged between 4.40 microns (r=8.25mm, Q=-0.1) and 89.50 microns (r=6.25mm, Q=-0.8).
For toric and toric-aspheric corneas, the RMS value from the surfaces of interest to the computed BFS ranged between 0 to 0.14 microns in our numeric calculations. It tend to increase with increased toricity, and increased negative asphericity. The maximal elevation amplitude in the central 3 mm zone ranged between 0 microns (r1=r2=7.75mm, Q=0) and 16.48 microns (r1=7.75mm, r2=7.25mm, Q=-0.8). The maximal elevation amplitude in the central 7 mm zone ranged between 0 microns (r1=r2=7.75mm, Q=0) and 67.58 microns (r1=7.75mm, r2=7.25mm, Q=-0.8).
DISCUSSION
We were able to estimate the corresponding theoretical changes in the best fit sphere and consequent elevation parameters for rotationally and non-rotationally symmetric corneal shapes modeled with bi-conic surfaces. Previous studies have investigated the role of elevation topography to: (i) establish normal patterns and standards45,46, (ii) identify high-risk individuals who may experience corneal ectasia after LASIK18,27, (iii) screen eye-bank eyes for previous refractive surgery47, (iv) evaluate possible changes in posterior corneal elevation after laser in situ keratomileusis (LASIK) or photorefractive keratectomy (PRK)48, and (v) build population-based average three dimensional (3-D) atlases or standards of the human cornea 49. Different patterns have been proposed to describe aspects of elevation topography maps including: “island”, “regular ridge”, “irregular ridge”, “incomplete ridge”, and “unclassified”50-52. Our results demonstrate that island pattern is induced by increased negative asphericity, whereas the ridge pattern reflects a combination of both increased negative asphericity and toricity.
For the same net change toward negative asphericity, the steeper the corneal surface centrally (the smaller the apical radius), the larger the increase in the A-value from the apex to the BFS. In normal corneas from an Asian population, the anterior BFS and posterior BFS measured with the Orbscan II were normally distributed and significantly correlated53. The posterior corneal surface has been reported to be centrally steeper and more prolate than that of the anterior surface24, 32-35. Therefore, the maximum posterior elevation is expected to be greater than that of the anterior surface, as has been reported clinically for normal corneas. This disparity has been illustrated by the conclusions of a preliminary study conducted by Tababe et al.54, who have noted that using the 5 microns scale, the posterior corneal map of a normal eye may look as if there was posterior keratectasia. The authors determined the most appropriate color-coded scale for scanning slit topography. The maps were judged to be abnormal when more than three colors were found within the central 3-mm area. They found that for 10 and 20 micron interval color scales are most appropriate for anterior and posterior elevation maps of the scanning slit topography, respectively.
Keratoconus screening is mandatory in the preoperative determination of the eligibility in refractive surgery. The exact mechanisms of genesis and progression of keratoconus are still unknown. Changes in the anterior and posterior corneal surfaces have been observed from the early stage of this disorder24,26,27 Given the geometry of the posterior corneal surface, any concomitant apical steepening and peripheral flattening of both corneal surfaces would result in a greater increase in the apical distance to the posterior suface’s BFS, and therefore a warmer central color in the elevation plot. These theoretical predictions echo the clinical impression that early manifestations of keratoconus as seen on the anterior corneal surface are often accompanied by concomitant increase in the apical posterior elevation. Lim et al.26 have compared the value of the maximum elevation against a BFS was compared in normal and keratoconus patients. It was found higher in keratoconus than in normal subjects. The epithelium has variable thickness55 and reduces the topographical irregularities of the Bowman’s membrane in myopic eyes56. One may hypothesize that the variations in epithelial thickness could mask some early corneal anomalies that may otherwise identify some corneas in the early stages of keratoconus and reinforce the discrepancy between anterior and posterior elevation characteristics in this population.
Apical steepening and increased negative asphericity result in an increase in the distance to the Apex (A-value) but have opposite effects on the BFS radius. Due to this disparity, indices derived from the ratio of the BFS of the anterior and posterior surfaces may not reach acceptable levels of sensitivity for keratoconus detection. Any increase in the distance from the apex to the BFS should not be identified as a “forward” shift when comparing two successive elevation maps. Our calculations show that the variations in the A-value to apex should not be interpreted without reference to the BFS radius values. For example, a revolution conic of 7.75 mm apical radius and -0.3 asphericity would show a greater A-value from the apex to the BFS than a similar but steeper of 7.25 mm apical radius and -0.2 asphericity.
Similarly, surfaces of different apical curvature and asphericity may have the same BFS radius value. The repartition of the surface data points above and below the BFS would be however different for each of these cases. Grzybowski et al.57 have evaluated the response of the posterior cornea after uneventful laser in situ keratomileusis (LASIK) with scanning-slit videokeratography, using the change in elevation as a measure of biomechanical remodeling. Despite an increase in central posterior corneal elevation after LASIK was noted, it appeared to be dominated by backward peripheral corneal swelling into the anterior chamber rather than forward “bulging” of the central posterior cornea.
The increase in the corneal apical curvature results in a linear variation of the BFS radius. This is expected given that varying the apical radius of a rotationally symmetrical conoid without changing the value of its asphericity is equivalent to an isometric change. Increasing the apical toricity for the same surface asphericity does not influence the value of the distance from the apex to the BFS. For the same level of asphericity, increasing the apical toricity produces an increase on the 3mm and 7 mm elevation maximal amplitude values. Our results suggest that in corneas exhibiting high levels of toricity, the A-value of from the apex to the BFS (A-value) may be a better parameter to distinguish between congenital astigmatism and the presence of an early keratoconus.
The analysis of corneal topography involves fitting the raw data to a geometric model that includes a regular basis surface, plus some sort of polynomial expansion to adjust the more irregular residual component. The residual can be smoothed by fitting some type of polynomial expansion, splines, or Zernike polynomial expansion. One limitation of our study is that the influence of the residuals was not investigated. Navarro et al. have shown that the general ellipsoid could be a better model for normal corneas provided that the fitting process was done using the canonical form (independent of the axis of the measuring instrument) as an intrinsic representation of the topography58. Consequently, we assumed that the bi-conic surface is a good, natural model of the average topography of the cornea. Our modeling was limited to studying the influence of basic corneal geometry characteristics such as asphericity and toricity, as no odd-functions were used, and we could not investigate the influence of surface tilt or asymmetry.
Read et al. have analyzed combined central and peripheral corneal topography maps. They found that for the conic fitting of the corneal data, the conic fit parameters were both found to change significantly for increasing corneal diameters59. For a 10-mm corneal diameter, the RMS fit error increased from a mean of 0.79 ± 0.4 μm for the 6-mm diameter to 21.18 ± 11.1 μm for the 10-mm corneal diameter. In this case, the RMS fit error corresponds to the departure of the natural corneal surface to a rotationally symmetrical surface and increased peripheral flattening. The fit error could be reduced by the inclusion of weighted even-order polynomials. Our data show that the RMS fit error, from the reference sphere to the conic section model, tend to increase with the decrease in the apical radius of curvature (apical steepening) for rotationally symmetrical surfaces.
The representation in elevation of biconic corneal models, against a BFS, corresponded to common symmetric elevation features observed in elevation topography, which may explain the differences in the elevation patterns of the anterior and posterior corneal surfaces. Increased prolateness and increased apical radius of curvature have similar effects on the BFS radius (increase), but opposite effects on the A-value. Further studies are needed to determine, the influence of such surface distortions, such as those in keratoconus, on the BFS radius and A-values.
Acknowledgments
Grant support: NIH EY10101 (D.T.A.), EY001792 (D.T.A.), and an unrestricted departmental Grant from Research to Prevent Blindness (New York, NY).
Footnotes
Commercial Relationships: None
References
- 1.Cairns G, McGhee CN. Orbscan computerized topography: attributes, applications, and limitations. J Cataract Refract Surg. 2005;31:205–220. doi: 10.1016/j.jcrs.2004.09.047. [DOI] [PubMed] [Google Scholar]
- 2.Holland SP, Srivannaboon S, Reinstein DZ. Avoiding serious corneal complications of laser assisted in situ keratomileusis and photorefractive keratectomy. Ophthalmology. 2000;107(4):640–52. doi: 10.1016/s0161-6420(99)00131-1. [DOI] [PubMed] [Google Scholar]
- 3.Kohnen T. Iatrogenic keratectasia: current knowledge, current measurements. J Cataract Refract Surg. 2002;28(12):2065–6. doi: 10.1016/s0886-3350(02)01879-5. [DOI] [PubMed] [Google Scholar]
- 4.Faraj HG, Gatinel D, Chastang PJ, Hoang-Xuan T. Corneal ectasia after LASIK. J Cataract Refract Surg. 2003;29(1):220. doi: 10.1016/s0886-3350(02)02012-6. [DOI] [PubMed] [Google Scholar]
- 5.Randleman JB, Russell B, Ward MA, Thompson KP, Stulting RD. Risk factors and prognosis for corneal ectasia after LASIK. Ophthalmology. 2003;110(2):267–75. doi: 10.1016/S0161-6420(02)01727-X. [DOI] [PubMed] [Google Scholar]
- 6.Binder PS, Lindstrom RL, Stulting RD, Donnenfeld E, Wu H, McDonnell P, Rabinowitz Y. Keratoconus and corneal ectasia after LASIK. J Cataract Refract Surg. 2005;31(11):2035–8. doi: 10.1016/j.jcrs.2005.12.002. [DOI] [PubMed] [Google Scholar]
- 7.Holland EJ. Ectasia following laser in situ keratomileusis. J Cataract Refract Surg. 2005;31(11):2034. doi: 10.1016/j.jcrs.2005.12.001. [DOI] [PubMed] [Google Scholar]
- 8.Tabbara KF, Kotb AA. Risk factors for corneal ectasia after LASIK. Ophthalmology. 2006;113(9):1618–22. doi: 10.1016/j.ophtha.2006.03.045. [DOI] [PubMed] [Google Scholar]
- 9.Rabinowitz YS. Ectasia after laser in situ keratomileusis. Curr Opin Ophthalmol. 2006;17(5):421–6. doi: 10.1097/01.icu.0000243015.51886.3a. [DOI] [PubMed] [Google Scholar]
- 10.Randleman JB. Post-laser in-situ keratomileusis ectasia: current understanding and future directions. Curr Opin Ophthalmol. 2006;17(4):406–12. doi: 10.1097/01.icu.0000233963.26628.f0. [DOI] [PubMed] [Google Scholar]
- 11.Condon PI. 2005 ESCRS Ridley Medal Lecture: will keratectasia be a major complication for LASIK in the long term? J Cataract Refract Surg. 2006;32(12):2124–32. doi: 10.1016/j.jcrs.2006.07.036. [DOI] [PubMed] [Google Scholar]
- 12.Condon PI, O’keefe M, Binder PS. Long-term results of laser in situ keratomileusis for high myopia: Risk for ectasia. J Cataract Refract Surg. 2007;33(4):583–90. doi: 10.1016/j.jcrs.2006.12.015. [DOI] [PubMed] [Google Scholar]
- 13.Maeda N, Klyce SD, Smolek MK, Thompson HW. Automated keratoconus screening with corneal topography analysis. Invest Ophthalmol Vis Sci. 1994;35:2749–2757. [PubMed] [Google Scholar]
- 14.Wilson SE, Klyce SD. Screening for corneal topographic abnormalities before refractive surgery. Ophthalmology. 1994;101:147–152. doi: 10.1016/s0161-6420(94)31372-8. [DOI] [PubMed] [Google Scholar]
- 15.Maeda N, Klyce SD, Smolek MK. Comparison of methods for detecting keratoconus using videokeratography. Arch Ophthalmol. 1995;113:870–874. doi: 10.1001/archopht.1995.01100070044023. [DOI] [PubMed] [Google Scholar]
- 16.Maeda N, Klyce SD, Smolek MK. Neural network classification of corneal topography. Preliminary demonstration. Invest Ophthalmol Vis Sci. 1995;36:1327–1335. [PubMed] [Google Scholar]
- 17.Smolek MK, Klyce SD. Current keratoconus detection methods compared with a neural network approach. Invest Ophthalmol Vis Sci. 1997;38:2290–2299. [PubMed] [Google Scholar]
- 18.Rabinowitz YS, Rasheed K. KISA% index: a quantitative videokeratography algorithm embodying minimal topographic criteria for diagnosing keratoconus. J Cataract Refract Surg. 2000;26:472–474. doi: 10.1016/s0886-3350(99)00195-9. [DOI] [PubMed] [Google Scholar]
- 19.Chastang PJ, Borderie VM, Carvajal-Gonzalez S, Rostene W, Laroche L. Automated keratoconus detection using the EyeSys videokeratoscope. J Cataract Refract Surg. 2000;26:675–683. doi: 10.1016/s0886-3350(00)00303-5. [DOI] [PubMed] [Google Scholar]
- 20.Mahmoud AM, Roberts CJ, Lembach RG, Twa MD, Herderick EE, McMahon TT CLEK Study Group. CLMI: the cone location and magnitude index. Cornea. 2008;27(4):480–7. doi: 10.1097/ICO.0b013e31816485d3. [DOI] [PMC free article] [PubMed] [Google Scholar]
- 21.Auffarth GU, Wang L, Volcker HE. Keratoconus evaluation using the Orbscan Topography System. J Cataract Refract Surg. 2000;26(2):222–8. doi: 10.1016/s0886-3350(99)00355-7. [DOI] [PubMed] [Google Scholar]
- 22.Tomidokoro A, Oshika T, Amano S, Higaki S, Maeda N, Miyata K. Changes in anterior and posterior corneal curvatures in keratoconus. Ophthalmology. 2000;107:1328–1332. doi: 10.1016/s0161-6420(00)00159-7. [DOI] [PubMed] [Google Scholar]
- 23.Rao SN, Raviv T, Majmudar PA, Epstein RJ. Role of Orbscan II in screening keratoconus suspects before refractive corneal surgery. Ophthalmology. 2002;109(9):1642–6. doi: 10.1016/s0161-6420(02)01121-1. [DOI] [PubMed] [Google Scholar]
- 24.Schlegel Z, Hoang-Xuan T, Gatinel D. Comparison of and correlation between anterior and posterior corneal elevation maps in normal eyes and keratoconus-suspect eyes. J Cataract Refract Surg. 2008;34(5):789–95. doi: 10.1016/j.jcrs.2007.12.036. [DOI] [PubMed] [Google Scholar]
- 25.Bessho K, Maeda N, Kuroda T, Fujikado T, Tano Y, Oshika T. Automated keratoconus detection using height data of anterior and posterior corneal surfaces. Jpn J Ophthalmol. 2006;50(5):409–16. doi: 10.1007/s10384-006-0349-6. [DOI] [PubMed] [Google Scholar]
- 26.Lim L, Wei RH, Chan WK, Tan DT. Evaluation of keratoconus in Asians: role of Orbscan II and Tomey TMS-2 corneal topography. Am J Ophthalmol. 2007;143(3):390–400. doi: 10.1016/j.ajo.2006.11.030. [DOI] [PubMed] [Google Scholar]
- 27.Sonmez B, Doan MP, Hamilton DR. Identification of scanning slit-beam topographic parameters important in distinguishing normal from keratoconic corneal morphologic features. Am J Ophthalmol. 2007;143(3):401–8. doi: 10.1016/j.ajo.2006.11.044. [DOI] [PubMed] [Google Scholar]
- 28.Rufer F, Schroder A, Arvani MK, Erb C. Central and peripheral corneal pachymetry—standard evaluation with the Pentacam system. Klin Monatsbl Augenheilkd. 2005;222:117–122. doi: 10.1055/s-2005-857908. [DOI] [PubMed] [Google Scholar]
- 29.Chen D, Lam AK. Intrasession and intersession repeatability of the Pentacam system on posterior corneal assessment in the normal human eye. J Cataract Refract Surg. 2007;33(3):448–54. doi: 10.1016/j.jcrs.2006.11.008. [DOI] [PubMed] [Google Scholar]
- 30.Lam AK, Chen D. Pentacam pachometry: comparison with non-contact specular microscopy on the central cornea and inter-session repeatability on the peripheral cornea. Clin Exp Optom. 2007;90(2):108–14. doi: 10.1111/j.1444-0938.2006.00103.x. [DOI] [PubMed] [Google Scholar]
- 31.Menassa N, Kaufmann C, Goggin M, Job OM, Bachmann LM, Thiel MA. Comparison and reproducibility of corneal thickness and curvature readings obtained by the Galilei and the Orbscan II analysis systems. J Cataract Refract Surg. 2008;34(10):1742–7. doi: 10.1016/j.jcrs.2008.06.024. [DOI] [PubMed] [Google Scholar]
- 32.Patel S, Marshall J, Fitzke FW. Shape and radius of posterior corneal surface. Refract Corneal Surg. 1993;9(3):173–81. [PubMed] [Google Scholar]
- 33.Garner LF, Owens H, Yap MK, Frith MJ, Kinnear RF. Radius of curvature of the posterior surface of the cornea. Optom Vis Sci. 1997;74(7):496–8. doi: 10.1097/00006324-199707000-00016. [DOI] [PubMed] [Google Scholar]
- 34.Lam AK, Douthwaite WA. A pilot study on the measurement of central posterior corneal radius in Hong Kong Chinese using Purkinje image technique. Ophthalmic Physiol Opt. 1997;17(1):68–74. [PubMed] [Google Scholar]
- 35.Dubbelman M, Sicam VA, Van der Heijde GL. The shape of the anterior and posterior surface of the aging human cornea. Vision Res. 2006;46(6-7):993–1001. doi: 10.1016/j.visres.2005.09.021. [DOI] [PubMed] [Google Scholar]
- 36.Kiely PM, Smith G, Carney LG. The mean shape of the human cornea. Opt Acta. 1982;29:1027–1040. [Google Scholar]
- 37.Guillon M, Lydon DP, Wilson C. Corneal topography: a clinical model. Ophthalmic Physiol Opt. 1986;6:47–56. [PubMed] [Google Scholar]
- 38.Eghbali F, Yeung KK, Maloney RK. Topographic determination of corneal asphericity and its lack of effect on the refractive outcome of radial keratotomy. Am J Ophthalmol. 1995;119:275–280. doi: 10.1016/s0002-9394(14)71167-5. [DOI] [PubMed] [Google Scholar]
- 39.Carney LG, Mainstone JC, Henderson BA. Corneal topography and myopia: a cross sectional study. Invest Ophthalmol Vis Sci. 1997;38:311–320. [PubMed] [Google Scholar]
- 40.Holladay JT. Corneal topography using the Holladay Diagnostic Summary. J Cataract Refract Surg. 1997;23(2):209–21. doi: 10.1016/s0886-3350(97)80344-6. [DOI] [PubMed] [Google Scholar]
- 41.Douthwaite WA, Hough T, Edwards K, Notay H. The EyeSys videokeratoscope assessment of apical radius and p-value in the normal human cornea. Ophthalmic Physiol Opt. 1999;19:467–474. doi: 10.1046/j.1475-1313.1999.00462.x. [DOI] [PubMed] [Google Scholar]
- 42.Schwiegerling J, Snyder RW. Custom photorefractive keratectomy ablations for the correction of spherical and cylindrical refractive error and higher-order aberration. J Opt Soc Am A Opt Image Sci Vis. 1998;15(9):2572–9. doi: 10.1364/josaa.15.002572. [DOI] [PubMed] [Google Scholar]
- 43.Langenbucher A, Viestenz A, Seitz B. Conoidal fitting of corneal topography height data after excimer laser penetrating keratoplasty. J Refract Surg. 2002;18(1):63–71. doi: 10.3928/1081-597X-20020101-10. [DOI] [PubMed] [Google Scholar]
- 44.Langenbucher A, Seitz B, Naumann GO. Three-axis ellipsoidal fitting of videokeratoscopic height data after penetrating keratoplasty. Curr Eye Res. 2002;24(6):422–9. doi: 10.1076/ceyr.24.6.422.8597. [DOI] [PubMed] [Google Scholar]
- 45.Wei RH, Lim L, Chan WK, Tan DT. Evaluation of Orbscan II corneal topography in individuals with myopia. Ophthalmology. 2006;113(2):177–83. doi: 10.1016/j.ophtha.2005.11.004. [DOI] [PubMed] [Google Scholar]
- 46.Módis L, Jr, Langenbucher A, Seitz B. Evaluation of normal corneas using the scanning-slit topography/pachymetry system. Cornea. 2004;23(7):689–94. doi: 10.1097/01.ico.0000126315.05519.0b. [DOI] [PubMed] [Google Scholar]
- 47.Hick S, Laliberte JF, Meunier J, Ousley PJ, Terry MA, Brunette I. Topographic screening of donor eyes for previous refractive surgery. J Cataract Refract Surg. 2006;32(2):309–17. doi: 10.1016/j.jcrs.2005.12.035. [DOI] [PubMed] [Google Scholar]
- 48.Ciolino JB, Belin MW. Changes in the posterior cornea after laser in situ keratomileusis and photorefractive keratectomy. J Cataract Refract Surg. 2006;32(9):1426–31. doi: 10.1016/j.jcrs.2006.03.037. [DOI] [PubMed] [Google Scholar]
- 49.Laliberte JF, Meunier J, Chagnon M, Kieffer JC, Brunette I. Construction of a 3-D atlas of corneal shape. Invest Ophthalmol Vis Sci. 2007;48(3):1072–8. doi: 10.1167/iovs.06-0681. [DOI] [PubMed] [Google Scholar]
- 50.Naufal SC, Hess JS, Friedlander MH, Granet NS. Rasterstereography-based classification of normal corneas. J Cataract Refract Surg. 1997;23(2):222–30. doi: 10.1016/s0886-3350(97)80345-8. [DOI] [PubMed] [Google Scholar]
- 51.Liu Z, Huang AJ, Pflugfelder SC. Evaluation of corneal thickness and topography in normal eyes using the Orbscan corneal topography system. Br J Ophthalmol. 1999;83(7):774–8. doi: 10.1136/bjo.83.7.774. [DOI] [PMC free article] [PubMed] [Google Scholar]
- 52.Tananuvat N, Pansatiankul N. Assessment of the anterior structures of eyes in a normal Northern Thai group using the Orbscan II. J Med Assoc Thai. 2005;88(Suppl 9):S105–13. [PubMed] [Google Scholar]
- 53.Lim KL, Fam HB. Relationship between the corneal surface and the anterior segment of the cornea: An Asian perspective. J Cataract Refract Surg. 2006;32(11):1814–9. doi: 10.1016/j.jcrs.2006.08.022. [DOI] [PubMed] [Google Scholar]
- 54.Tanabe T, Oshika T, Tomidokoro A, Amano S, Tanaka S, Kuroda T, Maeda N, Tokunaga T, Miyata K. Standardized color-coded scales for anterior and posterior elevation maps of scanning slit corneal topography. Ophthalmology. 2002;109(7):1298–302. doi: 10.1016/s0161-6420(02)01030-8. [DOI] [PubMed] [Google Scholar]
- 55.Reinstein DZ, Archer TJ, Gobbe M, Silverman RH, Coleman DJ. Epithelial thickness in the normal cornea: three-dimensional display with Artemis very high-frequency digital ultrasound. J Refract Surg. 2008;24(6):571–81. doi: 10.3928/1081597X-20080601-05. [DOI] [PMC free article] [PubMed] [Google Scholar]
- 56.Gatinel D, Racine L, Hoang-Xuan T. Contribution of the corneal epithelium to anterior corneal topography in patients having myopic photorefractive keratectomy. J Cataract Refract Surg. 2007;33(11):1860–5. doi: 10.1016/j.jcrs.2007.06.041. [DOI] [PubMed] [Google Scholar]
- 57.Grzybowski DM, Roberts CJ, Mahmoud AM, Chang JS., Jr Model for nonectatic increase in posterior corneal elevation after ablative procedures. J Cataract Refract Surg. 2005;31(1):72–81. doi: 10.1016/j.jcrs.2004.10.045. [DOI] [PubMed] [Google Scholar]
- 58.Navarro R, Gonzalez L, Hernandez JL. Optics of the average normal cornea from general and canonical representations of its surface topography. J Opt Soc Am A Opt Image Sci Vis. 2006;23(2):219–32. doi: 10.1364/josaa.23.000219. [DOI] [PubMed] [Google Scholar]
- 59.Read SA, Collins MJ, Carney LG, Franklin RJ. The topography of the central and peripheral cornea. Invest Ophthalmol Vis Sci. 2006;47(4):1404–15. doi: 10.1167/iovs.05-1181. [DOI] [PubMed] [Google Scholar]


