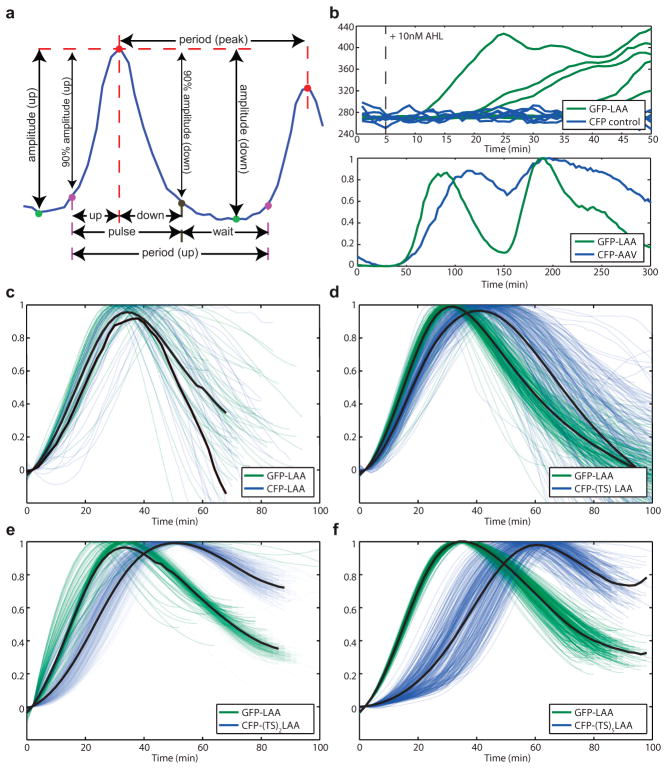
Extended Data Fig. 1.
Increasing length of the TS linker sequence results in increasing downstream module degradation delay. (a) Detailed breakdown of single fluorescent trajectory analysis. Peaks are identified in red, troughs in green, upslope 10% points in purple and downslope 10% points in dark beige. The two period measurements are peak to peak and the time between two successive 10% upslope points. (b) Top: sfGFP does not show bleed-over into CFP fluorescence channel. Induction of sfGFP with 10nM AHL (dashed line) showed increase in fluorescence of sfGFP, which was not detected in CFP channel. Bottom: the use of the published AAV degradation tag30 shows delay in the downstream module degradation of 15min. (c) Without the TS linker sequence, there is very little delay in downstream module degradation. (d) Single TS linker sequence results in 10 min delay. (e) Double TS linker sequence results in 16 min delay, similar to that of AAV degradation sequence. (f) 5-TS linker sequence results in 25 min delay (data shown in panels c–f was used to generate Fig. 1C).

