

Abstract
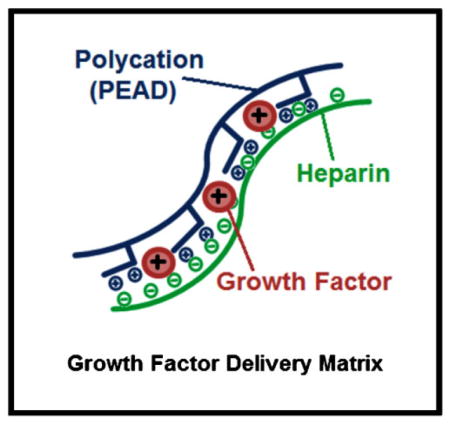
Controlled delivery of multiple growth factors (GFs) holds great potential for the clinical treatment of ischemic diseases and might be more therapeutically effective to reestablish vasculature than the provision of a single GF. Vascular endothelial growth factor (VEGF) and hepatocyte growth factor (HGF) are two potent angiogenic factors. However, due to rapid degradation and dilution in the body, their clinical potential will rely on an effective mode of delivery. A coacervate, composed of heparin and a biodegradable polycation, which protects GFs from proteolysis and potentiates their bioactivities, is developed. Here, the coacervate incorporates VEGF and HGF and sustains their release for at least three weeks. Their strong angiogenic effects on endothelial cell proliferation and tube formation in vitro are confirmed. Furthermore, it is demonstrated that coacervate-based delivery of these factors has stronger effects than free application of both factors and to coacervate delivery of each GF separately.
Keywords: angiogenesis, coacervate, drug delivery systems, growth factor, proteins
1. Introduction
Harnessing the body’s ability to regenerate damaged tissues and enhance functional recovery presents an exciting and challenging opportunity for growth factor (GF) therapy. The regenerative microenvironment is influenced by the interactions between cells, the extra-cellular matrix, and signaling molecules. GFs, chemokines, and cytokines can trigger endogenous repair mechanisms by providing the appropriate signals for cells to proliferate, migrate, differentiate, or apoptose.[1–3] Although the delivery of a single GF has shown promising results for some diseases or conditions, others will require a more complex approach.[4,5] Co-delivery of multiple GFs may be paramount to successful therapeutic angiogenesis for ischemic tissues such as in myocardial infarction and chronic wounds. According to the Angiogenesis Foundation, at least 314 million patients in Western nations could benefit from some form of pro-angiogenic therapy.[6] Vascular endothelial growth factor (VEGF) and hepatocyte growth factor (HGF) are potent stimulators of angiogenesis and play important roles in promoting endothelial cell (EC) growth, proliferation, migration, differentiation, and survival.[7–12] Several studies have demonstrated that the combination of VEGF and HGF in free-form produces a robust pro-angiogenic response, stronger than either GF alone.[13–16] This underscores the complexity of the neovascularization process and the need to develop therapies which adequately address this complexity.
The efficacy of GF therapy hinges on a delivery system that can appropriately maintain their bioactivity and bioavailability.[1,3] Efficient delivery vehicles may achieve this by protecting the GFs from proteolytic degradation and controlling their spatiotemporal release, while also avoiding side effects from high GF concentrations systemically or at unwanted distal locations.[3,4,17] Concentrating efforts on delivery systems with the capability of delivering GFs in a time-dependent and dosage-dependent fashion might be the key to obtaining sufficient tissue development.[4] We have previously described a new class of controlled release vehicles: an injectable polyvalent coacervate formed by a polycation, poly(ethylene arginyl aspartate diglyceride) (PEAD), and heparin that can control the release of heparin-binding GFs.[18] More than 400 human proteins bind heparin, many of which are important for healthy vasculature and tissue regeneration.[19] The coacervate is biodegradable, has excellent biocompatibility, and enhances the bioactivity of the GFs.[18,20–27] The objective of this study is to examine the effect of controlled co-release of VEGF and HGF from the PEAD:heparin coacervate on human EC proliferation and tube formation. We hypothesized that co-delivery of VEGF and HGF would yield stronger and more robust angiogenic effects than those of the individual GF coacervates and the co-administration of free GFs.
2. Experimental Section
2.1. Materials and Instruments
Clinical-grade heparin USP from porcine intestine was kindly provided as a gift from Scientific Protein Labs (Waunakee, WI). Recombinant human VEGF165 and HGF and the VEGF enzyme-linked immunosorbent assay (ELISA) kit were purchased from Peprotech (Oak Park, CA). The HGF ELISA kit was purchased from R&D Systems (Minneapolis, MN). Human umbilical vein endothelial cells (HUVEC) were purchased from ATCC (Manassas, VA). EGM-2 media was purchased from Lonza (Walkersville, MD). Calcein AM was purchased from Molecular Probes (Eugene, OR). NHS-Rhodamine was purchased from Thermo Scientific (Rockford, IL). Fibrinogen and thrombin were purchased from Sigma (St. Louis, MO). The BrdU cell proliferation assay was purchased from Millipore (Billerica, MA). The fluorescence microscope was an Eclipse Ti and used NIS-Elements AR imaging software, both from Nikon (Tokyo, Japan). The SynergyMX plate reader was from Biotek (Winooski, VT). The scanning electron miscroscope was a JSM-6335F field emission scanning electron microscopy (SEM) from JEOL (Peabody, MA). The Zetasizer Nano ZS90 was from Malvern (Worcestershire, UK).
2.2. VEGF and HGF Coacervate Characterization
2.2.1. Zeta Potential and Dynamic Light Scattering (DLS) Measurements
PEAD was synthesized as previously described.[18,22] Heparin and PEAD were each dissolved at 10 mg mL−1 in deionized (DI) water and filter-sterilized at 0.22 μm. Heparin was initially combined with either VEGF or HGF or both at 100:1 mass ratio of heparin:GF to ensure that the solution was saturated with heparin to bind all the available GFs. Solutions were then titrated with PEAD to obtain different PEAD:heparin:GF mass ratios. The solution was diluted with DI water to a total of 750 μL before zeta potential was measured with a Zetasizer Nano Z. Results were reported as a mean with standard deviation for 25 measurements. The same instrument was used to determine the hydrodynamic diameters of PEAD:heparin (5:1), heparin:VEGF (100:1), PEAD:heparin:VEGF (500:100:1), heparin:HGF (100:1), and PEAD:heparin:HGF (500:100:1) by DLS. Results were reported as a mean with polydispersity index (PDI) for 25 measurements. PDI in the area of light scattering is used to describe the width of the particle size distribution.
2.2.2. Fluorescent Imaging of the Coacervate
PEAD solution was mixed with rhodamine-labeled heparin at the optimized 5:1 PEAD:heparin mass ratio. The coacervate was centrifuged at 12 100 g for 10 min to form a pellet. The supernatant was aspirated to remove unbound heparin and the pellet was resuspended in DI water and added to a 96-well plate for fluorescent imaging.
2.2.3. Scanning Electron Microscopy (SEM)
SEM samples were prepared with PEAD:heparin mass ratio 5:1 for blank coacervate and PEAD:heparin:GF mass ratio 500:100:1 for VEGF or HGF coacervates. The complex was dropped on an aluminum stub, lyophilized, gold sputter-coated, and examined by SEM.
2.3. Growth Factor Loading Efficiency and Release Assay
The loading efficiencies of VEGF and HGF were determined by sandwich ELISA. VEGF + HGF coacervates (n = 3) were formed using 200 ng of each GF combined together then mixed with heparin followed lastly by PEAD at the optimized 500:100:1 mass ratio of PEAD:heparin:GF. Solution was then centrifuged at 12 100 g for 10 min to pellet the coacervate. The supernatant was aspirated and stored, and pellet was resuspended in DI water. The first collection (Day 0) was used to determine the loading efficiency. The same centrifugation and supernatant collection procedure was repeated on days 1,3,7,14, and 21. ELISA was performed to detect the amount of released GF in the supernatants according to the ELISA kit manufacturer’s instructions. After the addition of the stop solution, the absorbance at 450/540 nm was recorded by a SynergyMX plate reader and compared to standards (n =3) that contained 200 ng free-form GF each to determine percent release.
2.4. Endothelial Proliferation and Live Cell Count Assays
Similar culture conditions were used for cell proliferation and live cell count assays. Passage 6 HUVEC were labeled with calcein AM for 2 h before seeding 104 cells in 100 μL EGM-2 media per well in a 96-well plate. Six hours after seeding, group-specific media was added and 8 groups were used with 3 wells per group: basal media, blank coacervate, free HGF, free VEGF, free VEGF +HGF, HGF coacervate, VEGF coacervate, and VEGF +HGF coacervate. Each GF was added at a final 30 ng mL−1 concentration. For the BrdU cell proliferation assay, the plate was incubated at 37 °C for 16 h, then 20 μL of BrdU label was added to each well and incubated for 4 h. The proliferation assay protocol was then followed according to the kit’s instruction manual. After the addition of the stop solution, the absorbance at 450/540 nm was recorded by a SynergyMX plate reader and normalized to the basal media control. For the live cell count assay, the plate was incubated at 37 °C for 3 d, then cells were observed using a fluorescence microscope. Cell number was determined by manually counting the cells in a 0.67 mm2 field in the center of the well for 3 wells per group. Fluorescent images of cells were taken of 4 mm2 fields.
2.5. Endothelial Tube Formation Assay
Fibrin gels were prepared for a 3D cell culture environment as previously described.[28] Briefly, 6 mg mL−1 bovine fibrinogen was dissolved in EGM-2 media, added in 150 μL volumes to wells of a 24-well plate, activated with 150 μL thrombin solution (0.1 mg mL−1) in EGM-2, swirled gently to mix and solidified at 37 °C. Passage 5 HUVEC were labeled with calcein AM for 2 h, then 1.5 × 10⁵ cells were seeded on top of each gel in 1 mL EGM-2 media and incubated at 37 °C overnight. A confluent cell monolayer formed next day; media was removed and 300 μL group-specific fibrin gels were overlaid and solidified as before, followed by 1 mL EGM-2 media on top. Group-specific additions to top gels included 8 groups: basal media, blank coacervate, free VEGF, free HGF, free VEGF +HGF, VEGF coacervate, HGF coacervate, and VEGF +HGF coacervate. In all groups, the dosage of VEGF or HGF was 250 ng. After 3 d culture, media was removed and cells were imaged with a fluorescence microscope. An EC tube was defined as a straight cellular extension joining two cell masses or branch points.[28] Tube number, lengths, and thicknesses were measured as angiogenic indices.[28–30] Using microscopy software, endothelial tubes were manually counted and quantified in length and thickness in a 0.67 mm2 field in the center of 3 wells per group.
2.6. Statistical Analysis
GraphPad Prism 5.0 statistical software (La Jolla, CA) was used for statistical analysis. ANOVA followed by the post-hoc Tukey’s comparisontest was used to analyze the data for bioactivity assays. Data are presented as mean ± standard deviations.
3. Results and Discussion
3.1. VEGF and HGF Coacervate Characterization
The zeta potential of the strongly negative solution of heparin:GF (100:1 mass ratio) became more positive as it was titrated with the polycation PEAD. At 100:100:1 mass ratio of PEAD:heparin:GF, VEGF coacervate and HGF coacervate had negative zeta potentials of −52 ± 17.7 mV and −42.3 ± 4.87 mV, respectively. Zeta potentials approached neutrality at a mass ratio of approximately 500:100:1 with high turbidity in the solution, regardless of the GF used (−0.89 ± 3.86 mV for VEGF, and −1.84 ± 5.22 mV for HGF). As more PEAD was added, the zeta potential reached a positive plateau of 21.8 ± 5.09 mV for VEGF coacervate and 17.1 ± 4.43 mV for HGF coacervate at 1000:100:1 mass ratio (Figure 1A). In our previous report, a 5:1 mass ratio of PEAD:heparin produced a neutral coacervate.[18] The results of the present study indicate that a small amount of GFs does not have a significant effect on zeta potential. Therefore, for the rest of this study, we used a PEAD:heparin: GF mass ratio of 500:100:1 to achieve maximal coacervation.
Figure 1.
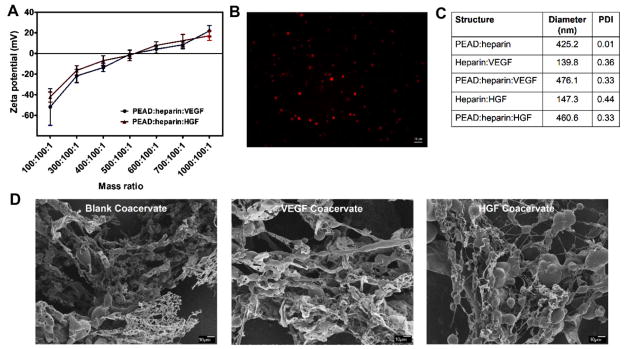
A) Zeta potentials of VEGF and HGF coacervates were measured at different mass ratios of PEAD:heparin:GF by titrating heparin: GF solutions with PEAD. B) Spherical droplets of Rhodamine-labeled blank coacervates were imaged by fluorescence microscope. C) DLS measurements show the hydrodynamic diameters of heparin:GF, PEAD:heparin, and PEAD:heparin:GF particles. D) SEM images at low magnification (500×) show the ribbon-like structures and globular domains of blank coacervate, VEGF coacervate, and HGF coacervate.
Fluorescent imaging of a blank coacervate using rhodamine-labeled heparin revealed spherical droplets of different sizes (Figure 1B). DLS measurements showed significant increases in hydrodynamic diameters upon addition of PEAD to heparin:GF complexes. The blank coacervate had a hydrodynamic diameter of 425.2 nm with 0.01 PDI. VEGF coacervate and HGF coacervate had diameters of 476.1 nm with 0.33 PDI and 460.6 nm with 0.33 PDI, respectively, demonstrating a small increase in size due to GF addition (Figure 1C). SEM images revealed the morphology of VEGF coacervate and HGF coacervate to be mainly composed of ribbon-like structures with globular beads of various sizes (Figure 1D). This is consistent with our previous reports, where the coacervate morphology consisted of fibers, beads, globular structures, and ribbon-like sheets.[18,21,26] The ribbon-like structures range from nanometers to micrometers scale and are highly variable in size, which could explain why they might not appear clearly in some SEM images. There was no apparent morphological difference between blank coacervates and GF-loaded coacervates at the chosen mass ratio, consistent with the conclusion that the ribbon-like and globular bead structures originate from PEAD and heparin, respectively.[18]
3.2. Coacervate Loading and Release of VEGF and HGF
We investigated the GF release kinetics from the coacervate using ELISA to detect the amount of released VEGF and HGF in the supernatant after pelleting the coacervate. The loading efficiency of VEGF was approximately 99%. The VEGF release profile showed a relatively small initial burst of 5.9% on day 1. After 3 d, the release became nearly linear and resulted in a total release of approximately 35.1% by 21 d (Figure 2). The loading efficiency of HGF was approximately 98%. The HGF release profile also showed a relatively small initial burst of 4.8% on day 1. After 3 d, the release became nearly linear and resulted in a total release of approximately 26.5% by 21 d (Figure 2). Our results demonstrate the impact of GF-heparin binding affinity on release rate. HGF which has a strong heparin-binding affinity (Kd = 12 nM) released slower from the coacervate than VEGF which has a relatively weaker heparin-binding affinity (Kd = 165 nM).[31] However, release rate of GF is also influenced by hydrolytic degradation of PEAD, dissociation of the complex in an ionic environment, and by enzymes such as esterases and heparinases, so the release is expected to be faster in vivo.
Figure 2.

Sustained in vitro release of VEGF and HGF from the coacervate for 3 weeks into DI water. VEGF and HGF were combined, then mixed with heparin followed by PEAD. After coacervate formed, tubes were centrifuged and supernatant was collected. GF amount was then quantified by sandwich ELISA at the specific time points. Bars indicate means ± SD.
Without efficient delivery systems, GFs tend to diffuse away from the target sites, degrade quickly, lose their bioactivities, and are potentially harmful when injected at high concentrations.[3] Current GF delivery systems including hydrogels, polymeric microspheres, and peptide nano-fibers face a number of challenges.[3] For example, PLGA microsphere formation requires organic solvents which may compromise the bioactivity of the loaded GF.[32] Hydrogels, on the other hand, make it hard to control the GF release kinetics and usually result in large initial burst releases.[33] Peptide nanofibers are expensive to synthesize which may be a roadblock to clinical translation.[34] In addition, all of these types of delivery vehicles often have relatively low GF loading efficiencies. For example, the one study that displayed the capability to deliver VEGF and HGF simultaneously and sequentially, using poly(trimethylene carbonate) based photo-cross-linked elastomers, did not evaluate any angiogenic effects of the two factors together or compare their bioactivity results to free GF administration.[35]
The coacervate delivery system was developed to overcome challenges faced by other delivery approaches. The coacervate was used in this study to simultaneously deliver VEGF and HGF. We are currently modifying the coacervate release kinetics to gain improved capability of simultaneous, sequential, and spatiotemporal delivery of GFs.[26] These modifications will include adjustment of the molecular weight of PEAD and/or heparin, the charge density of PEAD, and the [PEAD:heparin] mass ratio. The coacervate preserves the native properties and function of heparin through the ionic interactions with PEAD without covalent cross-linking to the delivery matrix. Intact heparin provides a high GF loading efficiency and preservation of GF bioactivity, and the phase separated coacervate localizes the GFs to the target tissues.[18,20–27] Finally, the coacervate is injectable and therefore can be easily utilized in a clinical setting.
3.3. VEGF +HGF Coacervate Displays Strong Angiogenic Effects
VEGF is an established promoter of blood vessel formation and remains the main driver of angiogenesis.[11,36] However, the administration of VEGF alone leads to the formation of immature, leaky, and unstable neovessels.[11] The utility of VEGF is also restricted by a dosage limit, which leads to proinflammatory side effects if surpassed.[37,38] Additional factors are therefore necessary to drive angiogenesis to completion. HGF is another potent angiogenic factor that stimulates EC proliferation and migration, and can induce endogenous expression of VEGF.[7,10,39] It has been shown that the combination of VEGF and HGF results in a more robust angiogenic response in vitro and in vivo than either factor alone.[13–16] However, the clinical potential of these therapies is limited because bolus and systemic injections of free-form GFs have low efficacy. This prompted us to investigate the potential benefit of coacervate-based co-delivery of VEGF and HGF on angiogenic applications.
3.3.1. VEGF +HGF Coacervate Induces Strong EC Proliferation
To investigate the effects of VEGF and HGF on HUVEC proliferation, we applied each GF separately or together, and in free-form or delivered by the coacervate. One day after application, both GFs together in free-form induced significantly greater proliferation compared to each GF alone, which showed no effect compared to control. Each GF alone delivered by the coacervate also significantly stimulated proliferation compared to each GF alone in free-form. Finally, coacervate delivery of both GFs together induced significantly greater proliferation compared to all other groups (Figure 3A).
Figure 3.

Endothelial cell (EC) proliferation and live cell count assays. Treatment groups with 30 ng mL−1 concentration for each GF were applied to 3 wells per group with seeded HUVEC. A) One day after incubation, BrdU cell proliferation assay was performed and absorbance was recorded. Data is presented as a fold-change from the basal media. B) Live cell number was quantified after 3 days incubation over 0.67 mm2 fields in 3 wells per group. C) Microscope images of calcein-stained HUVEC in 4 mm2 fields. Bars indicate means ± SD. * p value <0.05.
To verify that cell proliferation continued beyond 1 d and that the cells were still viable, we used calcein staining after 3 d culture and counted the number of live HUVECs. The results were similar to that of the proliferation assay with VEGF and HGF displaying a stronger angiogenic effect compared to each GF alone, and coacervate delivery inducing significantly higher cell numbers than respective free-form GF application (Figure 3B,C). These results show the benefit of co-delivery of VEGF and HGF using the coacervate on EC proliferation, a key process in angiogenesis.
3.3.2. VEGF +HGF Coacervate Induces Strong EC Tube Formation
To investigate the angiogenic potential of coacervate co-delivery of HGF and VEGF, we performed an established HUVEC tube formation assay within fibrin gels.[28,40] This three-dimensional angiogenesis assay better preserves the vessel architecture and represents a closer mimicking of in vivo events than two-dimensional models.[40,41] After 3 d of culture, no significant tube formation was observed in the basal media or blank coacervate control groups. VEGF and HGF did induce tube formation which was improved with coacervate delivery compared to free-form application, and their coacervate co-delivery induced the most well-interconnected, thick endothelial tubes (Figure 4A).
Figure 4.

Endothelial tube formation assay using 3D fibrin gels environment. HUVEC were seeded on bottom gel and specific treatment groups were added to top gel with 3 wells per group and incubated for 3 days. A) Microscope images of calcein-stained EC tubes formed in different groups. B) Number of EC tubes, C) tube thickness, and D) tube length were quantified by microscope imaging analysis software in 0.67 mm2 fields. Bars indicate means ± SD. * p value <0.05.
Both GFs together in free-form significantly increased EC tube number and thickness compared to each GF alone. Each GF alone delivered by the coacervate significantly increased the EC tube number and thickness compared to each GF alone in free-form. More importantly, coacervate delivery of both GFs together significantly increased EC tube number and thickness compared to all other groups (Figure 4B,C). Although combining VEGF and HGF induced more and thicker tubes in both free-form and using the coacervate, this combination interestingly did not have a significant effect on tube length compared to delivery of each GF alone. However, the coacervate groups did induce significantly longer tubes than their corresponding free-form groups (Figure 4D).
As has been previously reported, our results confirm the stronger angiogenic effects of VEGF and HGF when applied together to promote angiogenesis.[13–16] Additionally, our results demonstrate that controlled co-delivery of these factors using a polycation:heparin coacervate does not impede the cooperation between the two GFs, but rather enhances it compared to free-form GF application. In the design of the coacervate platform, we were inspired by the stable ternary complex formed by fibroblast growth factor (FGF), heparin, and its cell receptor, whereby heparin facilitates their association.[42,43] We mimicked the heparin-binding domain of fibroblast growth factor receptor (FGFR) which contains many basic amino acids with the synthetic polycation PEAD. Utilizing heparin in its native conformation facilitates the GF-receptor interaction and likely results in the improved angiogenic effects shown by the coacervate-based delivery compared to free-form GFs. A gene expression profiling study demonstrated that there exists discrete signaling pathways for VEGF and HGF in vascular ECs.[44] Therefore, this combination of GFs applied in a sustained release fashion may be highly effective in vivo, but requires further investigation.
As we have demonstrated with other heparin-binding GFs, the coacervate serves as an effective delivery vehicle for VEGF and HGF. The coacervate sustains their release for at least 3 weeks and localizes and promotes their bioactivities compared to free-form GFs, therefore lower dosages may be used. This study also validates the use of this delivery platform for co-delivery of two factors, motivating future investigations of other GF combinations and simultaneous and sequential delivery of three or more factors. We may assess other important GFs involved in angiogenesis such as platelet-derived growth factor (PDGF), FGF (FGF-1 and FGF-2), and angiopoietins in order to further promote the angiogenic effects. After we evaluate an optimal combination of angiogenic factors delivered by the coacervate in vitro, our next step would be to evaluate the angiogenic potential of this combination in an in vivo ischemia model.
4. Conclusion
Many ischemic tissues cannot regenerate their functions and architectures without proper vascular support. Angiogenesis is a complicated process; thus regulating the local availability of different GF combinations can provide a powerful tool in controlling tissue regeneration. The coacervate can serve as an efficient system to deliver GFs either individually or in combinations. In this study, the coacervate displayed its ability to load VEGF and HGF with high efficiency and sustain their release for at least 3 weeks with minimal initial burst. Combining VEGF and HGF yields stronger and more robust angiogenic effects, shown by EC proliferation and tube formation assays. More importantly, we demonstrated that coacervate-based delivery of these factors has more profound angiogenic effects than free GFs and controlled delivery of each GF separately. This indicates that the coacervate enhanced the bioactivity of the GFs. The in vitro pro-angiogenic results of VEGF +HGF coacervate warrant further investigation in vivo to examine its efficacy for therapeutic angiogenesis.
Acknowledgments
The authors thank Scientific Protein Labs for providing heparin. This research was supported in part by an AHA grant 12EIA9020016 and an NSF grant DMR-1005766.
Contributor Information
Hassan K. Awada, Department of Bioengineering, University of Pittsburgh, Pittsburgh, Pennsylvania 15261-3649, USA. McGowan Institute for Regenerative Medicine, Pittsburgh, Pennsylvania 15219-3110, USA
Noah R. Johnson, Department of Bioengineering, University of Pittsburgh, Pittsburgh, Pennsylvania 15261-3649, USA. McGowan Institute for Regenerative Medicine, Pittsburgh, Pennsylvania 15219-3110, USA
Dr. Yadong Wang, Email: yaw20@pitt.edu, Department of Bioengineering, University of Pittsburgh, Pittsburgh, Pennsylvania 15261-3649, USA. McGowan Institute for Regenerative Medicine, Pittsburgh, Pennsylvania 15219-3110, USA
References
- 1.Tayalia P, Mooney DJ. Adv Mater. 2009;21:3269. doi: 10.1002/adma.200900241. [DOI] [PubMed] [Google Scholar]
- 2.Li WW, Talcott KE, Zhai AW, Kruger EA, Li VW. Adv Skin Wound Care. 2005;18:491. doi: 10.1097/00129334-200511000-00013. [DOI] [PubMed] [Google Scholar]
- 3.Chu H, Wang Y. Ther Delivery. 2012;3:693. doi: 10.4155/tde.12.50. [DOI] [PMC free article] [PubMed] [Google Scholar]
- 4.Chen FM, Zhang M, Wu ZF. Biomaterials. 2010;31:6279. doi: 10.1016/j.biomaterials.2010.04.053. [DOI] [PubMed] [Google Scholar]
- 5.Risau W. Nature. 1997;386:671. doi: 10.1038/386671a0. [DOI] [PubMed] [Google Scholar]
- 6.The Angiogenesis Foundation. [accessed: July, 2013]; www.angio.org.
- 7.Bussolino F, Di Renzo MF, Ziche M, Bocchietto E, Olivero M, Naldini L, Gaudino G, Tamagnone L, Coffer A, Comoglio PM. J Cell Biol. 1992;119:629. doi: 10.1083/jcb.119.3.629. [DOI] [PMC free article] [PubMed] [Google Scholar]
- 8.Ferrara N. Semin Oncol. 2002;29:10. doi: 10.1053/sonc.2002.37264. [DOI] [PubMed] [Google Scholar]
- 9.Rosen EM, Goldberg ID. Adv Cancer Res. 1995;67:257. doi: 10.1016/s0065-230x(08)60715-0. [DOI] [PubMed] [Google Scholar]
- 10.Taniyama Y, Morishita R, Aoki M, Nakagami H, Yamamoto K, Yamazaki K, Matsumoto K, Nakamura T, Kaneda Y, Ogihara T. Gene Ther. 2001;8:181. doi: 10.1038/sj.gt.3301379. [DOI] [PubMed] [Google Scholar]
- 11.Yancopoulos GD, Davis S, Gale NW, Rudge JS, Wiegand SJ, Holash J. Nature. 2000;407:242. doi: 10.1038/35025215. [DOI] [PubMed] [Google Scholar]
- 12.Ruvinov E, Leor J, Cohen S. Biomaterials. 2010;31:4573. doi: 10.1016/j.biomaterials.2010.02.026. [DOI] [PubMed] [Google Scholar]
- 13.Golocheikine A, Tiriveedhi V, Angaswamy N, Benshoff N, Sabarinathan R, Mohanakumar T. Transplantation. 2010;90:725. doi: 10.1097/TP.0b013e3181ef8a63. [DOI] [PubMed] [Google Scholar]
- 14.Sulpice E, Ding S, Muscatelli-Groux B, Berge M, Han ZC, Plouet J, Tobelem G, Merkulova-Rainon T. Biol Cell. 2009;101:525. doi: 10.1042/BC20080221. [DOI] [PubMed] [Google Scholar]
- 15.Van Belle E, Witzenbichler B, Chen D, Silver M, Chang L, Schwall R, Isner JM. Circulation. 1998;97:381. doi: 10.1161/01.cir.97.4.381. [DOI] [PubMed] [Google Scholar]
- 16.Xin X, Yang S, Ingle G, Zlot C, Rangell L, Kowalski J, Schwall R, Ferrara N, Gerritsen ME. Am J Pathol. 2001;158:1111. doi: 10.1016/S0002-9440(10)64058-8. [DOI] [PMC free article] [PubMed] [Google Scholar]
- 17.Lee K, Silva EA, Mooney DJ. J R Soc Interface. 2011;8:153. doi: 10.1098/rsif.2010.0223. [DOI] [PMC free article] [PubMed] [Google Scholar]
- 18.Chu H, Johnson NR, Mason NS, Wang Y. J Controlled Release. 2011;150:157. doi: 10.1016/j.jconrel.2010.11.025. [DOI] [PubMed] [Google Scholar]
- 19.Ori A, Wilkinson MC, Fernig DG. J Biol Chem. 2011;286:19892. doi: 10.1074/jbc.M111.228114. [DOI] [PMC free article] [PubMed] [Google Scholar]
- 20.Chu H, Chen CW, Huard J, Wang Y. Biomaterials. 2013;34:1747. doi: 10.1016/j.biomaterials.2012.11.019. [DOI] [PubMed] [Google Scholar]
- 21.Chu H, Gao J, Chen CW, Huard J, Wang Y. Proc Natl Acad Sci U S A. 2011;108:13444. doi: 10.1073/pnas.1110121108. [DOI] [PMC free article] [PubMed] [Google Scholar]
- 22.Chu H, Gao J, Wang Y. Biotechnol Prog. 2012;28:257. doi: 10.1002/btpr.728. [DOI] [PubMed] [Google Scholar]
- 23.Johnson NR, Wang Y. J Controlled Release. 2013;166:124. doi: 10.1016/j.jconrel.2012.11.004. [DOI] [PMC free article] [PubMed] [Google Scholar]
- 24.Johnson NR, Wang Y. PLoS One. 2013;8:e63075. doi: 10.1371/journal.pone.0063075. [DOI] [PMC free article] [PubMed] [Google Scholar]
- 25.Li H, Johnson NR, Usas A, Lu A, Poddar M, Wang Y, Huard J. Stem Cells Trans Med. 2013;2:667. doi: 10.5966/sctm.2013-0027. [DOI] [PMC free article] [PubMed] [Google Scholar]
- 26.Johnson NR, Ambe T, Wang Y. Acta Biomater. 2014;10:40. doi: 10.1016/j.actbio.2013.09.012. [DOI] [PMC free article] [PubMed] [Google Scholar]
- 27.Lee KW, Johnson NR, Gao J, Wang Y. Biomaterials. 2013;34:9877. doi: 10.1016/j.biomaterials.2013.08.082. [DOI] [PMC free article] [PubMed] [Google Scholar]
- 28.Chalupowicz DG, Chowdhury ZA, Bach TL, Barsigian C, Martinez J. J Cell Biol. 1995;130:207. doi: 10.1083/jcb.130.1.207. [DOI] [PMC free article] [PubMed] [Google Scholar]
- 29.Aranda E, Owen GI. Biol Res. 2009;42:377. [PubMed] [Google Scholar]
- 30.Yamagishi S, Yonekura H, Yamamoto Y, Katsuno K, Sato F, Mita I, Ooka H, Satozawa N, Kawakami T, Nomura M, Yamamoto H. J Biol Chem. 1997;272:8723. doi: 10.1074/jbc.272.13.8723. [DOI] [PubMed] [Google Scholar]
- 31.Ashikari-Hada S, Habuchi H, Kariya Y, Itoh N, Reddi AH, Kimata K. J Biol Chem. 2004;279:12346. doi: 10.1074/jbc.M313523200. [DOI] [PubMed] [Google Scholar]
- 32.Wang X, Wenk E, Hu X, Castro GR, Meinel L, Wang X, Li C, Merkle H, Kaplan DL. Biomaterials. 2007;28:4161. doi: 10.1016/j.biomaterials.2007.05.036. [DOI] [PMC free article] [PubMed] [Google Scholar]
- 33.Silva AK, Richard C, Bessodes M, Scherman D, Merten OW. Biomacromolecules. 2009;10:9. doi: 10.1021/bm801103c. [DOI] [PubMed] [Google Scholar]
- 34.Hsieh PC, Davis ME, Gannon J, MacGillivray C, Lee RT. J Clin Invest. 2006;116:237. doi: 10.1172/JCI25878. [DOI] [PMC free article] [PubMed] [Google Scholar]
- 35.Chapanian R, Amsden BG. J Controlled Release. 2010;143:53. doi: 10.1016/j.jconrel.2009.11.025. [DOI] [PubMed] [Google Scholar]
- 36.Zachary I, Morgan RD. Heart. 2011;97:181. doi: 10.1136/hrt.2009.180414. [DOI] [PubMed] [Google Scholar]
- 37.Baumgartner I, Rauh G, Pieczek A, Wuensch D, Magner M, Kearney M, Schainfeld R, Isner JM. Ann Intern Med. 2000;132:880. doi: 10.7326/0003-4819-132-11-200006060-00005. [DOI] [PubMed] [Google Scholar]
- 38.Detmar M, Brown LF, Schon MP, Elicker BM, Velasco P, Richard L, Fukumura D, Monsky W, Claffey KP, Jain RK. J Invest Dermatol. 1998;111:1. doi: 10.1046/j.1523-1747.1998.00262.x. [DOI] [PubMed] [Google Scholar]
- 39.Sengupta S, Gherardi E, Sellers LA, Wood JM, Sasisekharan R, Fan TP. Arterioscler Thromb Vasc Biol. 2003;23:69. doi: 10.1161/01.atv.0000048701.86621.d0. [DOI] [PubMed] [Google Scholar]
- 40.Vailhe B, Vittet D, Feige JJ. Lab Invest. 2001;81:439. doi: 10.1038/labinvest.3780252. [DOI] [PubMed] [Google Scholar]
- 41.Nissanov J, Tuman RW, Gruver LM, Fortunato JM. Lab Invest. 1995;73:734. [PubMed] [Google Scholar]
- 42.Zern BJ, Chu H, Wang Y. PLoS One. 2010;5:e11017. doi: 10.1371/journal.pone.0011017. [DOI] [PMC free article] [PubMed] [Google Scholar]
- 43.Pellegrini L. Curr Opin Struct Biol. 2001;11:629. doi: 10.1016/s0959-440x(00)00258-x. [DOI] [PubMed] [Google Scholar]
- 44.Gerritsen ME, Tomlinson JE, Zlot C, Ziman M, Hwang S. Br J Pharmacol. 2003;140:595. doi: 10.1038/sj.bjp.0705494. [DOI] [PMC free article] [PubMed] [Google Scholar]