Abstract
Improving the signal-to-noise-ratio (SNR) of magnetic resonance imaging (MRI) using denoising techniques could enhance their value, provided that signal statistics and image resolution are not compromised. Here, a new denoising method based on spectral subtraction of the measured noise power from each signal acquisition is presented. Spectral subtraction denoising (SSD) assumes no prior knowledge of the acquired signal and does not increase acquisition time. Whereas conventional denoising/filtering methods are compromised in parallel imaging by spatially dependent noise statistics, SSD is performed on signals acquired from each coil separately, prior to reconstruction. Using numerical simulations, we show that SSD can improve SNR by up to ~45% in MRI reconstructed from both single and array coils, without compromising image resolution. Application of SSD to phantom, human heart, and brain MRI achieved SNR improvements of ~40% compared to conventional reconstruction. Comparison of SSD with anisotropic diffusion filtering showed comparable SNR enhancement at low-SNR levels (SNR = 5–15) but improved accuracy and retention of structural detail at a reduced computational load.
Index Terms: Magnetic resonance imaging (MRI) denoising, parallel imaging, spectral subtraction, SENSE
I. Introduction
Improving signal-to-noise ratio (SNR) in magnetic resonance imaging (MRI) without sacrificing spatial resolution, contrast, or scan-time could improve diagnostic value. While time averaging increases SNR, with SNR ∝ √(scan-time), extending the scan-time is expensive, prone to motion artifacts, and unacceptable in many clinical MRI applications. Indeed, parallel imaging techniques, such as sensitivity encoding (SENSE) [1] and generalized autocalibrating partially parallel acquisitions (GRAPPA) [2], are commonly used to shorten scan-times. Images reconstructed with these techniques exhibit spatially varying noise statistics, which limit the applicability of conventional denoising techniques.
Several denoising methods have been proposed to enhance the SNR of images acquired using parallel MRI techniques. One method, anisotropic diffusion filtering (ADF) [3], effectively improves SNR while preserving edges by averaging the pixels in the direction orthogonal to the local image signal gradient. ADF can potentially remove small features and alter the image statistics, although adaptively accounting for MRI’s spatially varying noise characteristics can offer improvements, this is practically challenged by the unavailability of the image noise matrix [4]. Wavelet-based filters have also been applied to MRI [5]–[8]. These are prone to produce edge and blurring artifacts.
Recently, denoising methods employing nonlocal means (NLM) [9] were applied to increase the MRI SNR by reducing variations among pixels in the image with close similarity indices [10]. The robustness of the determination of pixel similarity is enhanced by comparing small image regions centered at each pixel, rather than pixel-by-pixel comparisons. While adaptive NLM denoising (involving the estimation and incorporation of spatial variations in the noise power) offers improved performance [11], NLM can still affect image statistics [12] and its computational burden is high compared to other approaches.
In this study, we introduce a new, time efficient, image de-noising method by applying spectral subtraction directly to MRI acquisitions in k-space. Spectral subtraction is well established for the suppression of additive Gaussian noise (AGN) [13] and is commonly used in speech processing [14]. It has been applied to the time-course of functional MRI (fMRI) data to facilitate event detection [15], but not the SNR enhancement of routine MRIs per se. We test spectral subtraction denoising (SSD) on both numerical simulations, as well as experimental MRI data including parallel SENSE image reconstruction [1], and compare its performance with ADF.
A preliminary version of this work was submitted to the 6th Cairo International Biomedical Engineering Conference, 2012 [16].
II. Theory
For Cartesian MRI, the acquired complex signal fills k-space matrix. Each k-space row can be modeled as an underlying true signal plus Gaussian noise:
| (1) |
where x(t) is the observed k-space signal, s(t) is the true underlying noiseless k-space signal, n(t) is the AGN, and subscripts r and i denote real and imaginary components, respectively. For convenience, equations for denoising the real part of any k-space line should be interpreted hereinafter as applying also to the imaginary part. Assuming that signal and noise are uncorrelated (which is the case in MRI), the power spectral density (PSD) obtained from a 1-D Fourier transform (FT) of a k-space line is given by
| (2) |
where |Sr (f)|2 is the PSD of the noiseless signal and |Nr (f)|2 is the PSD of the noise; f is the conjugate variable of t. Because the PSD of the AGN is constant, we can subtract the root-mean-square noise power, , from the PSD of the acquired signal to get an estimate of |Sr (f)|2. This reduces the noise bias on the acquired signal, which becomes
| (3) |
where W (f) is a predefined weighting function of f with real values in the interval [0, 1], and Yr (f) is the f-spectrum of the denoised signal and estimator of Sr (f). Because the PSD cannot be negative, subtractions that result in negative values are replaced by the original PSD at the corresponding f-frequency, according to
| (4) |
where a is a real, single-valued regulation parameter in the interval [0, 1] [13]. The denoised signal, Yr (f), is computed from the square root of its PSD, with the phase information retrieved from the f-spectrum, Xr (f), of the acquired signal:
| (5) |
Phase information is kept the same as in the original f-spectrum. Taking the inverse FT of Yr (f) yields the real part of the denoised k-space line.
After applying the same algorithm to the real and imaginary parts of all the k-space lines, a denoised k-space set, yr (t) + i · yi (t), is produced, from which a conventional 2-D FT image reconstruction yields the denoised MRI. To reduce directional filtering effects, the same algorithm is applied on the columns of the k-space and the average of both denoised images is taken.
III. Methods
A. SSD and ADF Application
The algorithm for performing SSD of MRI uses MATLAB (Mathworks, Inc., Natick, MA) software on a laptop computer with 2-GHz processor and 8 GB of memory. The algorithm is separately applied to each k-space row and column, as depicted in Fig. 1, and the two denoised k-space results averaged. The regulation parameter a was set to 0.2 and the windowing function W (f) set to 1 for all frequencies to avoid introducing any extra spatial filtering effects.
Fig. 1.
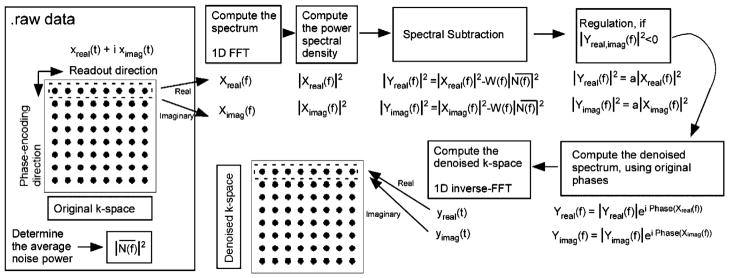
Flowchart of the spectral subtraction algorithm along the row direction of k-space.
ADF is chosen for comparison as it was previously used for denoising MRI, and shown to overcome the problems of blurring of object boundaries while providing a time-efficient implementation [3], [17]. The MATLAB script, “anisodiff2D” (available from MATLAB Central File Exchange [18]) is applied on magnitude images scaled to a range of [0, 1] (input parameters: 15 iterations; integration constant = 1/7; gradient modulus = 0.02).
B. Computer Simulations
Numerical simulations are performed using a 1024 × 1024 pixel Shepp–Logan phantom and a reference 256 × 256 pixel high-SNR brain MRI which was considered noise-free [19]. Gaussian noise of the same amplitude is added to the real and imaginary parts of the 2-D FT (k-space) of the images. SSD is applied to the complex k-space data, while the ADF is applied to the magnitude image.
Numerical simulations for SENSE [1] images are based on the 256 × 256 high-SNR brain image. Eight complex coil sensitivity maps corresponding to the sensitivity profiles of an eight-channel head coil are simulated [20], and the individual coil data are generated by multiplying the simulated sensitivity pro-files with the original image. Gaussian noise is then added to the real and imaginary parts of the 2-D FT of each of the eight images. Simulated noisy k-space data generated by 2-D FFT of the individual coil images are subsampled with a reduction factor, R. The SSD method is separately applied to the complex k-space data from the eight coils. Subsampled and unprocessed k-space data and spectral subtraction method applied k-space data are then fed into a SENSE reconstruction employing the simulated coil profiles. For comparison, the ADF is applied to the SENSE magnitude image generated from unprocessed k-space data. The brain image, simulated sensitivity profiles, and SENSE reconstruction code is publicly available and was downloaded from [19].
The average noise power used for denoising the simulated images is determined by scaling the variance of the added noise, with the dimension, X, of the 1-D FT (to account for the FT scaling):
| (6) |
where is the average noise power added to k-space to corrupt the image.
Computer simulations are iterated 100 times for each input SNR level and reduction factor. Pixel-wise SNR values are extracted from the signal mean and standard deviation (SD) using
| (7) |
where Ii (x, y) is the magnitude of the pixel at location (x, y) in the image at the ith iteration. The root-mean-squared error (RMSE) and structural similarity indices (SSIMs) [21] of noisy and denoised images are quantified by comparing them to the original noiseless image. The SSIM is computed using
| (8) |
where x and y are the images that are compared, μ is the mean of the pixel intensities, σxy is the cross correlation between the two images, and σx is the standard deviation of pixel intensities in image x.
The reported SNR and RMSE for images reconstructed in computer simulations are pixel-wise averages over each entire image, excluding the background.
C. MRI Experiments
Imaging experiments are performed on a mineral oil phantom, and on healthy volunteers in studies approved by our Institutional Review Board. Experiments are conducted on a 3 T Philips Achieva scanner (Philips Medical Systems, Cleveland, OH), and the raw data are exported for processing. Spin-lattice relaxation time (T1)-weighted multislice (24 slices) fast field echo (FFE) sequences with a flip angle of 80° are used for both phantom and brain studies. Single coil phantom images are acquired with the Philips body coil. The FFE sequence is used in phantom experiments with a repetition period TR = 30 ms, and echo time TE = 4.6 ms.
Parallel MRI data from the brain are acquired using a Philips eight-channel 3 T head coil with TR/TE = 385/9.2 ms and a 576 × 575 matrix size (with no reduction factor). A six-channel Philips cardiac coil is used for cardiac cine MRI, which is performed with two SNRs realized by varying the bandwidth per pixel from 1.63 to 0.86 kHz. The change in bandwidth affects the sequence timing slightly: we use single breath-hold, ECG-triggered 2-D turbo field echo sequences (turbo factor, 8; TR/TE = 2.7/1.35, 3.2/1.53 ms; cardiac phases: 30, 25; matrix size: 256 × 256) for cardiac studies.
The average noise power in the MRI experiments is accurately determined from data acquired during the preparation phase of the scanner with both RF power and gradients turned off. The receiver bandwidth and gain are identical for each set of experiments. Samples for each coil element are stored (as “.raw” files) and exported from the scanner. This does not affect exam time because the information is already acquired by the scanner, but the noise could also be estimated from the image data by other statistical and/or spectral analyses [22], [23]. We observed that the noise power of the highest noise-contributing coil element was 90% higher than the coil element with the lowest noise contribution. The MRI signal from each coil element is denoised separately using their corresponding additive noise level estimates determined from the “.raw” data. is calculated using (6), where is the variance of the acquired noise samples.
The sensitivity profile for the SENSE reconstruction is separately estimated for each coil by polynomial fitting of the complete acquired dataset [24]. The effect of denoising on parallel imaging was tested with SENSE reconstruction reduction factors of R = 1.5–3. The SNR reported for brain images was taken as the average of pixel-wise SNR values computed using given by [6], including all the image pixels and CSF, except the background.
IV. Results
A. Single-Channel Denoising
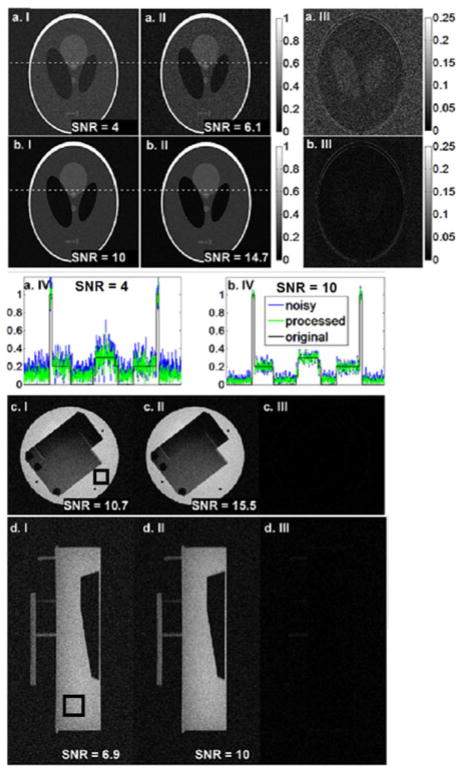
Simulation results of the Shepp–Logan phantom with different SNR values are shown in Fig. 2(a) and (b). The magnitude images reconstructed from the original and the denoised k-space data are shown in columns I and II, respectively. Column III shows the absolute difference between the images of columns I and II (residual), while column IV plots the noiseless, noisy, and SSD signal across a horizontal line through the phantom. SSD provides an SNR improvement versus the noisy image of 50% without any significant artifacts apparent.
Fig. 2.
Simulated Shepp–Logan phantom (rows a and b) and MRI phantom magnitude images (rows c and d) are shown. Original noisy images (column I), processed images (column II), and the residuals (column III) are displayed. Pro-files of the image along the dotted lines in (a.I), (a.II) and (b.I), (b.II) are plotted in (a.IV) and (b.IV), respectively. SNR improvement of ~40% is observed. Noise level is calculated from the background and signal intensity is calculated by averaging the pixels in a uniform region as indicated by the square box.
Experimental MRI results from a phantom imaged with the body coil and using the background to calculate noise power are shown in Fig. 2(c) and (d). Column I shows the original images, column II shows the processed images, and column III shows the residuals. Here, SSD results in a mean pixel SNR improvement of 45%.
A high-SNR brain image polluted with AGN, and then filtered with ADF or SSD, is displayed in Fig. 3, row I. The differences between the processed and the original image [see Fig. 3(a.I)] are shown in row II. Both denoising methods effectively increase SNR by about 40% without removing high spatial-frequency information, as evidenced by the residual images.
Fig. 3.
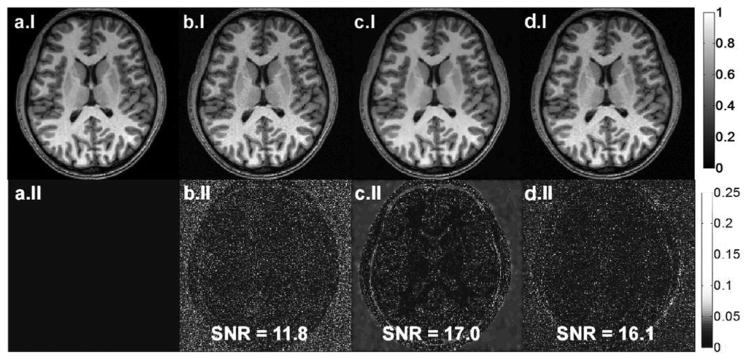
(a.I) Original noiseless image, (b.I) noise added image with SNR = 11.8, (c.I) ADF, and (d.I) SSD method applied images are shown on top row. Residual images with respect to (a.I) are displayed on row II.
The results from filtering and denoising as a function of noise level are plotted in Fig. 4. As suggested by the higher SNR for ADF in Fig. 4(a) , ADF can provide a greater SNR gain at high SNR. However, the ADF and SSD gains are comparable at low SNR [see Fig. 4(a)], and SSD has a much more homogeneous SNR improvement in the presence of varying signal SNR than ADF [see Fig. 4(a)]. This means that it is much better at preserving the original contrast between signals that vary in intensity, spatially, especially at higher SNR values. The SNR gain for SSD approaches unity as the SNR of the acquisition improves and the noise has a diminishing affect on the signal. This is not the case for ADF. The accuracy or RMSE of the two approaches, as compared to the original image, is plotted in Fig. 4(b). Both methods show a comparable improvement in accuracy at low SNR compared to the noise image. However, at higher SNR (>25), the accuracy of ADF is inferior to not using any filter, while the performance of the SSD method tracks the accuracy of the input image. Fig. 4(c) shows the SSIM [21]. This illustrates that the SSD method is superior to ADF in preserving the structural information of the image.
Fig. 4.

(a) SNR improvement, (b) RMSE, and (c) SSIM are plotted against input image SNR for computer simulation results, where dotted curves are anisotropic diffusion filter results while dashed ones represent the spectral subtraction method.
B. SENSE Reconstruction Denoising
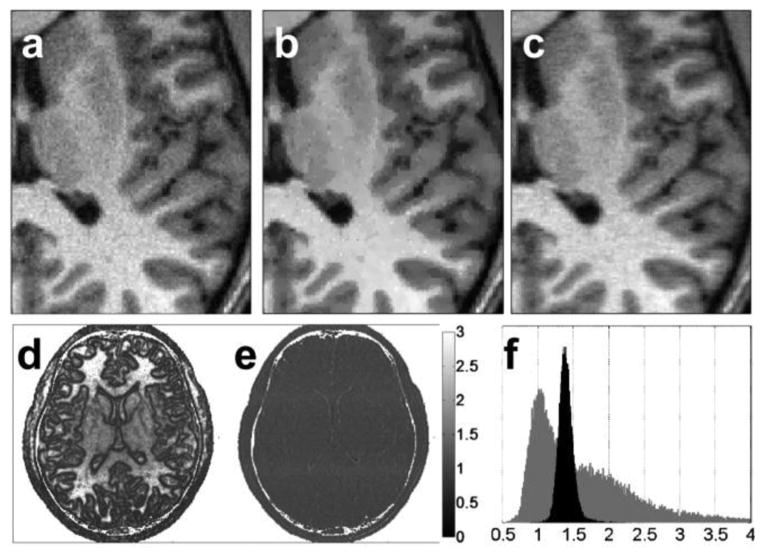
Fig. 5 depicts a reconstructed eight-channel SENSE image with a reduction factor (R) of 1.5 and an unfiltered mean image SNR of 16.3, zoomed-in to reveal fine detail without filtering [see Fig. 5(a)], with ADF [see Fig. 5(b)], and with SSD [see Fig. 5(c)] applied. Fig. 5(d) shows the pixel-wise SNR improvement map provided by the ADF method. For ADF, the spatial performance is inhomogeneous, with a salt-and-pepper-type noise pattern that is also evident in Fig. 5(b). Conversely, because the SSD method operates in the frequency domain of the acquired data, its pixel-wise SNR improvement map in Fig. 5(e) is uniform throughout the signal-bearing regions of the image, demonstrating that the acquisition statistics are preserved. This is further evidenced by histograms of the pixel intensities of the two SNR improvement maps [from Fig. 5(d) and (e)] in Fig. 5(f), which are sharply clustered for SSD, but not ADF. RMSE, SSIM, and SNR improvement are plotted as a function of reduction factor and input SNR in Fig. 6 for both filtering methods. The SSD method’s performance is comparable to ADF up to a reduction factor of ~2, and better than ADF at higher reduction factors. The SNR improvement for SSD is inversely related to the input SNR.
Fig. 5.
(a) SENSE reconstruction from noise added data with reduction factor of 1.5 and SNR of each coil image equal to 12, (b) anisotropic diffusion filtered image, and (c) spectral subtraction method applied image are zoomed in. (d) Pixel-wise SNR improvement rate of anisotropic diffusion filter, and (e) spectral subtraction method are displayed along with their histograms (f, gray: anisotropic diffusion filter, black: spectral subtraction method). Background of the image is not used in SNR calculations. Despite the higher SNR improvement of ADF, pixilation effects are visible in the image.
Fig. 6.
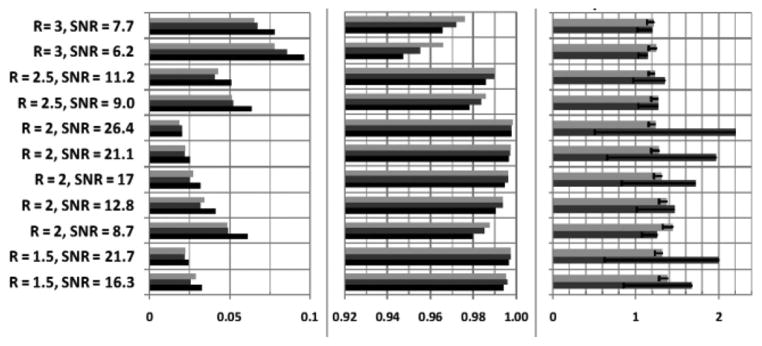
(a) RMSE, (b) SSIM, and (c) SNR improvement rates on SENSE images with different reduction factors and input SNRs (light gray: SSD, dark gray: ADF, black: original reconstruction). It is noted that the SSD outperforms both the original SENSE reconstruction and ADF in terms of the SSIM.
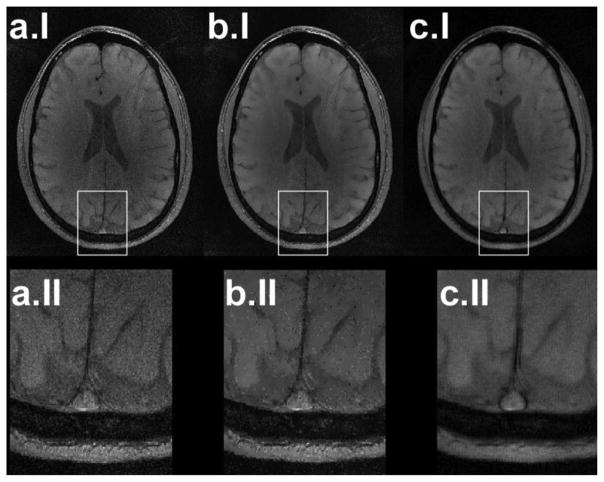
SENSE reconstructed, ADF, and SSD-processed images from acquired parallel imaging data with reduction factor of 2 are shown in row I of Fig. 7, with their corresponding zoomed-in views in row II. The ADF performance is spatially heterogeneous, with best results in high-SNR regions and pixilation effects in the middle of the image with low SNR. On the other hand, the SSD method is unaffected by local noise variations and acts homogeneously on the image. Fig. 7(c.II) shows better delineation of the superior sagittal sinus compared to the original and ADF applied images.
Fig. 7.
(a.I) Brain MR image of a healthy volunteer reconstructed from an eight-channel coil using SENSE reconstruction with a reduction factor of 2, (b.I) denoised image using ADF, and (c.I) SSD. (row II) Superior sagittal sinus surrounded by white boxes in images in row I are zoomed in to show the image quality improvement.
SENSE cardiac images reconstructed with R = 1.5 and two different acquisition bandwidths are shown in Fig. 8(a) and (c). Five cardiac phases are depicted, four of which are zoomed in. To assess the SNR improvement realized by SSD in the septum, the mean signal intensity is divided by the noise level in the square volumes marked in Fig. 8. The apparent SNR in the septum is 3.06 ± 0.4 and 8.25 ± 1.0 for the unfiltered images acquired with 1.63 and 0.86 kHz bandwidth per pixel, respectively [see Fig. 8(a) and (c)]. SSD provides average SNR improvements of 40 ± 3 and 42 ± 3% calculated and averaged over the 30 and 25 cardiac phases of each scan, respectively [see Fig. 8(b) and (d)], consistent with the numerical results. No significant blurring effects are noticed in comparing the filtered and unfiltered cardiac cine images acquired at the two different SNR levels (see Fig. 8).
Fig. 8.
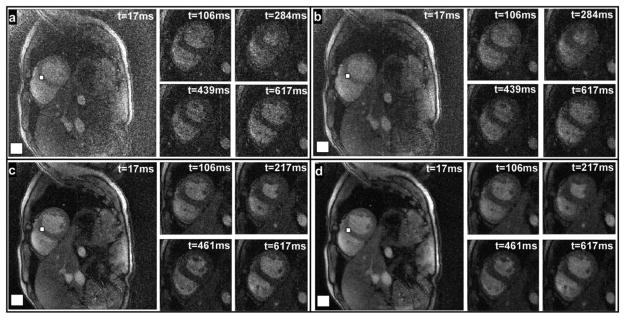
Displayed in panels (a), (c) are SENSE (R = 1.5) reconstructed short-axis cardiac images acquired at different cardiac phases, and the corresponding SSD images are shown in panels (b), (d). SNR calculations from septum and background (white boxes) show an average improvement of 40 ± 3% and 42 ± 3% (b and d, respectively).
SSD using MATLAB took 0.4 s for a 512 × 512 image, compared to 1.3 s for ADF on the 2-GHz computer.
V. Discussion
Spectral subtraction methods are commonly used in automated speech recognition [14] to improve the estimation efficiency, and in many other applications including the temporal denoising of fMRI data streams for event detection [15]. However, at least to our knowledge, they have not been used in standard MRI for the spatial denoising of individual images. SSD methods work on data corrupted by AGN that is uncorrelated with the underlying data and has a constant power spectrum. Noise in the complex data acquired from each coil element in an NMR experiment generally satisfies these assumptions, but is not immune from non-Gaussian events such as physiologic motion or noise spikes, for example. The computational load for denoising an N × N image using SSD is of the order O(N2 log(N)) [13], much less than that of denoising by NLM, O(N4) [25].
The SSD method can be likened to a Wiener filter. An optimum Wiener filter modifies each component in the power spectrum of the input according to the noise power at the corresponding frequency, which may not be constant throughout the spectrum. However, the SSD method denoises the data using the mean of the power spectrum to provide an unbiased estimate of the signal and a variance depending on the signal and noise characteristics [13], [15]. SSD does not account for the variations in the phase caused by the additive noise. The phase of the complex Gaussian noise is uniformly distributed in the interval [−π, π] which cannot be estimated statistically in either the image or its transformed domains. However, the power spectrum of finite samples of complex Gaussian noise is scattered at a constant level, enabling its estimation and subtraction from the power spectrum of the complex received signal.
The response of the SSD filter depends on the input signal. It is an SNR-dependent filter wherein lower SNR components are attenuated more than higher SNR components, which may introduce subtle image blurring for low-level signals. Any de-noising method applied to parallel MRI data is challenged by the spatially varying noise statistics that result from the coils’ sensitivity profiles and reconstruction algorithm. The SSD method is immune to such effects when the data acquired from each coil element are separately denoised using its measured average noise power spectrum, which can vary significantly between elements. The present results also suggest that SSD can be applied in situations where there is inherent physiological noise and motion such as in the heart (see Fig. 8).
In conclusion, we have shown SNR improvements of up to 45% for MRI using SSD in both single and array coils reconstruction while preserving image details in simulations and, in practice, in phantoms and multichannel brain and cardiac MRI. The SSD method performs comparably to ADF in terms of SNR improvement, and superior to ADF with respect to accuracy and the retention of structural detail, at a reduced computational load.
Acknowledgments
This work was supported by the National Institutes of Health under Grant R01 EB 007829.
The authors would like to thank Daniel A. Herzka, Ph.D., Johns Hopkins University, for his help with the cardiac scans.
Biographies

M. Arcan Ertürk (M’08) received the B.S. degree in electrical and electronics engineering from Bilkent University, Ankara, Turkey, in 2009, and the M.S. degree in electrical and computer engineering, from Johns Hopkins University, Baltimore, MD, USA, in 2011, where he is currently working toward the Ph.D. degree in the Electrical and Computer Engineering Department.
His research interests include RF and microwave circuit design, interventional magnetic resonance imaging (MRI) and internal MR detectors, ultra-high-field MRI, MR RF safety, RF pulse design and signal processing.
Mr. Ertürk has been a member of the International Society for Magnetic Resonance in Medicine since 2010.

Paul A. Bottomley received the B.Sc. (Hons.) degree in physics from Monash University, Melbourne, Vic., Australia, in 1974, and the Ph.D. degree in physics at Nottingham University, Nottingham, U.K., in one of the three original laboratories that began magnetic resonance imaging (MRI).
In Raymond Andrew’s group, alongside that of Peter Mansfield, he built the first MRI system producing radiographic-quality images of the human wrist, and performed the initial work on RF field and power deposition in human MRI. Upon completing his Ph.D., he went to Johns Hopkins University, Baltimore, MD, USA, in 1978 to adapt MRI for spatially localized spectroscopy, MRS, using surface coils to demonstrate metabolite depletion and reversal in regional myocardial ischemia. From 1980 to 1994, he was at the GE Research Center, Schenectady, NY, USA, where, after ordering the biggest magnet available—a 1.5 T system—the team built the first high-field whole-body MRI/MRS scanner, overcoming problems of coil design, RF penetration, and signal-to-noise ratio. The results translated into the highly successful 1.5 T MRI product line with well over 20 000 systems today. He did the first localized MRS in human heart and brain, then returned to Johns Hopkins in 1994 as the Russell Morgan Professor. He is currently the Director of the MR Research Division in Radiology, Johns Hopkins University. He has about 170 peer-reviewed papers and more than 40 patents, including high-field and spin-echo MRI, “crusher” gradients, and PRESS.
Dr. Bottomley is a Fellow of the International Society for Magnetic Resonance in Medicine. He is a 1989 Gold Medal recipient, and a GE gold patent and Coolidge Fellowship awardee.
AbdEl-Monem M. El-Sharkawy (M’96) received the B.S. and M.S. degrees in systems and biomedical engineering, from Cairo University, Cairo, Egypt. He also received the M.S. and Ph.D. degrees in electrical and computer engineering from Johns Hopkins University, Baltimore, MD, USA, in 2004 and 2008, respectively.
He is currently with Johns Hopkins University. From 1998 to 2001, his research work was focused on ultrasound medical imaging related topics. He has been involved with magnetic resonance imaging (MRI) for more than ten years now. His research work includes signal processing, MR thermometry, static magnetic field stability, RF coil design, human MR phosphorus spectroscopy, MR RF safety and power deposition monitoring, interventional MRI, SPECT-MR, and MRI acoustic noise reduction. His article on high field signal-to-noise-ratio performance of the MR loopless antennas was featured as the cover picture for the May 2008 issue of the Medical Physics Journal. Currently, he has about 16 peer-reviewed journal papers, one patent, and more than 50 conference presentations.
Contributor Information
M. Arcan Ertürk, Email: merturk1@jhu.edu, Electrical and Computer Engineering Department, Johns Hopkins University, Baltimore, MD 21218 USA.
Paul A. Bottomley, Email: bottoml@mri.jhu.edu, Radiology Department and the Electrical and Computer Engineering Department, Johns Hopkins University, Baltimore, MD 21287 USA
AbdEl-Monem M. El-Sharkawy, Email: abdshark@jhu.edu, Radiology Department, Johns Hopkins University, Baltimore, MD 21287 USA.
References
- 1.Pruessmann KP, Weiger M, Scheidegger MB, Boesiger P. SENSE: sensitivity encoding for fast MRI. Magn Resonance Med. 1999 Nov;42(5):952–62. [PubMed] [Google Scholar]
- 2.Griswold MA, Jakob PM, Heidemann RM, Nittka M, Jellus V, Wang JM, Kiefer B, Haase A. Generalized autocalibrating partially parallel acquisitions (GRAPPA) Magn Resonance Med. 2002 Jun;47(6):1202–1210. doi: 10.1002/mrm.10171. [DOI] [PubMed] [Google Scholar]
- 3.Perona P, Malik J. Scale-space and edge-detection using anisotropic diffusion. IEEE Trans Pattern Anal Mach Intell. 1990 Jul;12(7):629–639. [Google Scholar]
- 4.Samsonov AA, Johnson CR. Noise-adaptive nonlinear diffusion filtering of MR images with spatially varying noise levels. Magn Resonance Med. 2004 Oct;52(4):798–806. doi: 10.1002/mrm.20207. [DOI] [PubMed] [Google Scholar]
- 5.Tsao J, Kozerke S, Boesiger P, Pruessmann KP. Optimizing spa-tiotemporal sampling for k-t BLAST and k-t SENSE: application to high-resolution real-time cardiac steady-state free precession. Magn Resonance Med. 2005 Jun;53(6):1372–82. doi: 10.1002/mrm.20483. [DOI] [PubMed] [Google Scholar]
- 6.Nowak RD. Wavelet-based rician noise removal for magnetic resonance imaging. IEEE Trans Image Process. 1999 Oct;8(10):1408–1419. doi: 10.1109/83.791966. [DOI] [PubMed] [Google Scholar]
- 7.Weiger M, Boesiger P, Hilfiker PR, Weishaupt D, Pruessmann KP. Sensitivity encoding as a means of enhancing the SNR efficiency in steady-state MRI. Magn Resonance Med. 2005 Jan;53(1):177–85. doi: 10.1002/mrm.20322. [DOI] [PubMed] [Google Scholar]
- 8.Wirestam R, Bibic A, Latt J, Brockstedt S, Stahlberg F. Denoising of complex MRI data by wavelet-domain filtering: Application to high-b-value diffusion-weighted imaging. Magn Resonance Med. 2006 Nov;56(5):1114–1120. doi: 10.1002/mrm.21036. [DOI] [PubMed] [Google Scholar]
- 9.Buades A, Coll B, Morel JM. A non-local algorithm for image denoising. Proc IEEE Comput Soc Conf Comput Vis Pattern Recognit. 2005;2:60–65. [Google Scholar]
- 10.Manjon JV, Carbonell-Caballero J, Lull JJ, Garcia-Marti G, Marti-Bonmati L, Robles M. MRI denoising using non-local means. Med Image Anal. 2008 Aug;12(4):514–523. doi: 10.1016/j.media.2008.02.004. [DOI] [PubMed] [Google Scholar]
- 11.Manjon JV, Coupe P, Marti-Bonmati L, Collins DL, Robles M. Adaptive non-local means denoising of MR images with spatially varying noise levels. J Magn Resonance Imag. 2010 Jan;31(1):192–203. doi: 10.1002/jmri.22003. [DOI] [PubMed] [Google Scholar]
- 12.Thacker NA, Manjon JV, Bromiley PA. Statistical interpretation of non-local means. IET Comput Vis. 2010 Sep;4(3):162–172. [Google Scholar]
- 13.Vaseghi SV. Advanced Digital Signal Processing and Noise Reduction. 2. New York, USA: Wiley; 2000. [Google Scholar]
- 14.Boll SF. Suppression of acoustic noise in speech using spectral subtraction. IEEE Trans Acoust Speech, Signal Process. 1979 Apr;ASSP-27(2):113–120. [Google Scholar]
- 15.Kadah YM. Adaptive denoising of event-related functional magnetic resonance imaging data using spectral substraction. IEEE Trans Biomed Eng. 2004 Nov;51(11):1944–1953. doi: 10.1109/TBME.2004.831525. [DOI] [PubMed] [Google Scholar]
- 16.Erturk MA, Bottomley PA, El-Sharkawy A-MM. Spectral subtraction de-noising of MRI; Proc. 6th Cairo Int. Biomed. Eng. Conf; Cairo, Egypt. 2012; pp. 138–141. [Google Scholar]
- 17.Gerig G, Kubler O, Kikinis R, Jolesz FA. Nonlinear anisotropic filtering of MRI data. IEEE Trans Med Imag. 1992 Jun;11(2):221–232. doi: 10.1109/42.141646. [DOI] [PubMed] [Google Scholar]
- 18.Lopes D. Anisotropic diffusion. 2012 [Online]. Available at http://www.mathworks.com/matlabcentral/fileexchange/14995-anisotropic-diffusion-perona-malik.
- 19.Lin F-H. 2012 [Online]. Available at http://www.nmr.mgh.harvard.edu/~fhlin/tool_sense.htm.
- 20.Dietrich O, Raya JG, Reeder SB, Reiser MF, Schoenberg SO. Measurement of signal-to-noise ratios in MR images: Influence of mul-tichannel coils, parallel imaging, and reconstruction filters. J Magn Resonance Imag. 2007 Aug;26(2):375–385. doi: 10.1002/jmri.20969. [DOI] [PubMed] [Google Scholar]
- 21.Wang Z, Bovik AC, Sheikh HR, Simoncelli EP. Image quality assessment: From error visibility to structural similarity. IEEE Trans Image Process. 2004 Apr;13(4):600–612. doi: 10.1109/tip.2003.819861. [DOI] [PubMed] [Google Scholar]
- 22.Sijbers J, den Dekker AJ. Maximum likelihood estimation of signal amplitude and noise variance from MR data. Magn Resonance Med. 2004 Mar;51(3):586–594. doi: 10.1002/mrm.10728. [DOI] [PubMed] [Google Scholar]
- 23.Sijbers J, Den Dekker AJ, Van Audekerke J, Verhoye M, Van Dyck D. Estimation of the noise in magnitude MR images. Magn Resonance Imag. 1998 Jan;16(1):87–90. doi: 10.1016/s0730-725x(97)00199-9. [DOI] [PubMed] [Google Scholar]
- 24.Jaermann T, Pruessmann KP, Valavanis A, Kollias S, Boesiger P. Influence of SENSE on image properties in high-resolution single-shot echo-planar DTI. Magn Resonance Med. 2006 Feb;55(2):335–42. doi: 10.1002/mrm.20769. [DOI] [PubMed] [Google Scholar]
- 25.Orchard J, Ebrahimi M, Wong A. Efficient nonlocal-means denoising using the SVD. Proc 15th IEEE Int Conf Image Process. 2008;1–5:1732–1735. [Google Scholar]


