

Abstract
A new method was developed for the analysis of natural and synthetic androgenic steroids and their selected metabolites in aquatic environmental matrices using direct large-volume injection (LVI) high performance liquid chromatography (HPLC) tandem mass spectrometry (MS/MS). Method accuracy ranged from 88 to 108% for analytes with well-matched internal standards. Precision, quantified by relative standard deviation (RSD), was less than 12%. Detection limits for the method ranged from 1.2 to 360 ng/L. The method was demonstrated on a series of 1-hr composite wastewater influent samples collected over a day with the purpose of assessing temporal profiles of androgen loads in wastewater. Testosterone, androstenedione, boldenone, and nandrolone were detected in the sample series at concentrations up to 290 ng/L and loads up to 535 mg. Boldenone, a synthetic androgen, had a temporal profile that was strongly correlated to testosterone, a natural human androgen, suggesting its source may be endogenous. An analysis of the sample particulate fraction revealed detectable amounts of sorbed testosterone and androstenedione. Androstenedione sorbed to the particulate fraction accounted for an estimated five to seven percent of the total androstenedione mass.
Introduction
Waste water treatment plants (WWTPs) can act as point sources of anthropogenic pollutants to receiving waters.1 Sensitive and simplified methods are needed to quantify pollutants in complex wastewater and environmental matrices, especially endocrine disrupting chemicals (EDCs) that are bioactive at low (ng/L) concentrations.2-5 Analyses of EDCs focus primarily on estrogens and their conjugates in wastewater,6-13 due to observed estrogenic effects on aquatic wildlife.7, 14, 15 Conversely, analyses of androgens are focused on wood pulp mill effluent14, 16 and agricultural runoff,2, 3, 17 which exhibit androgenic effects on aquatic wildlife. Recently, WWTP influent and effluent are reported to have androgenic activities.18-21 However, the limited analyses of androgenic steroids in wastewater focuses on compounds endogenous to humans and a few select synthetic compounds, such as methyl-testosterone and stanozolol.22-25 It is possible that some of the androgenic activity detected in wastewater is due to synthetic androgens which have been overlooked by current androgenic-activity and chemical analyses. Synthetic androgens are used medically and abused illicitly, and because of this sales data on them are incomplete. Therefore, it is largely unknown which synthetic androgens might occur in municipal wastewater systems, so analyses incorporating a broader range of synthetic androgens are needed. Androgenic steroids and their phase-I metabolites are, in most cases, excreted from humans as glucuronic acid or sulfate conjugates.26, 27 Others report that estrogenic steroids are largely deconjugated back to their parent form in-route to, and during, wastewater treatment.6, 9, 11, 28 However, there have been no studies to support that this phenomenon also applies to androgens in wastewater and, as such, remains a data gap in the literature.
Solid phase extraction (SPE) is the conventional method for steroid extraction, cleanup, and concentration from environmental and wastewater matrices.22-25, 29, 30 However, sample pre-treatment by SPE requires the use of large quantities of solvents, materials, and is laborious and expensive. In contrast, direct LVI of analytes in aquatic environmental and wastewater matrices reduces the amount of labor, solvents, and materials required because the only sample pre-treatment step is centrifugation31-33 or filtration.34, 35
Most wastewater sampling approaches use 24-hr composite samples, while very few studies are conducted using sampling approaches based on higher temporal sample resolution.36, 37 To date, sampling protocols for the study androgens in wastewater rely on grab samples22 and 24-hr volume-proportional composites collected with an unknown sampling frequency.24 Wastewater influent is highly heterogeneous and sampling error comes from sampling frequency and number of wastewater pulses containing the analyte.36, 37 For example, grab sampling can miss analyte events in wastewater entirely.36, 37 24-hr composites do not reveal daily patterns in analyte loads,37 which potentially can help discriminate between analytes of endogenous and synthetic origin. Additionally, 24-hr composites may dilute analytes that occur only episodically throughout a given day to levels below detection.
The objective of this study was to develop a LVI based method that allows for the analysis of androgenic steroids in waste and surface water that is simplified compared to conventional methods, and is sensitive, selective, reproducible, and suitable a for wide range of androgens. The analytes included in this study are two endogenous androgens and nine synthetic androgens used in human38, 39 and veterinary medicine,40, 41 and abused illicitly.42-44 Five major phase-I human metabolites26 of selected androgens were also included. Additional phase-I metabolites are commercially available; however, they were cost prohibitive. While important, assessing androgen conjugates and the potential for their deconjugation in wastewater was beyond the scope of this study. The occurrences of eight of these analytes have not been studied in wastewater. The method was demonstrated on a series of 1-hr composite wastewater influent samples collected over a 24-hr period to assess diurnal variation in androgen loads.
Experimental
Chemicals
Standards of Nandrolone (Nand), Boldenone (Bold), Methandienone (Meta), Stanozolol (Stan), 16β-Hydroxystanozolol (16-Stan), Androstenedione (Andro), Methenolone (Mete), 17β-Trenbolone (Tren), 17α-Methyltestosterone (CH3-Test), and d3-Stanozolol (d3-Stan) were obtained from Cerilliant Corporation (Round Rock, Texas) as solutions at concentrations of 1mg/mL in either acetonitrile or 1,2-dimethoxyethane (DME) except 16-Stan and d3-Stan which were 0.1 mg/mL. Testosterone (Test) and d3-Testosterone (d3-Test) were purchased from Sigma-Aldrich (Saint Louis, Missouri) as solutions in DME at 1 mg/ml and 0.1 mg/ml respectively. 17α-trenbolone (Epi-Tren), 5β-Androst-1-en-17β-ol-3-one (5-Andro), 17α-oxandrolone (Epi-Ox), 6β-Hydroxymethandienone (6-Meta), Tetrahydrogesterone (THG), and d3-Boldeonone (d3-Bold) were purchased from National Measurement Institute (NMI) (Pymble, New South Wales). THG was available only as a qualitative standard (purity 63.3%). Attempts to find a higher purity, commercially available standard were unsuccessful. Standards made from THG were adjusted to compensate for purity. 17β-Oxandrolone (Ox) was purchased from Steraloids Incorporated (Newport, Rhode Island). Primary parent standards were made in the solvent recommended by the manufacturer at 10 or 100 μg/mL; compounds with no recommendation were made in DME.
HPLC grade methanol (MeOH) and acetone were purchased from Sigma-Aldrich (Saint Louis, Missouri), formic acid was bought from Fisher Scientific (Fair Lawn, New Jersey) and ammonium formate was obtained from Mallinckrodt Chemical (Saint Louis, Missouri). Ultra-pure water was made using a Barnstead Easepure water filtration system (Dubuque, IA).
Sample Collection and Treatment
Wastewater samples were obtained from a wastewater treatment facility located in the Pacific Northwest that serves a population of approximately 55,000. For the demonstration study twenty-four, 1-hr wastewater influent composites were collected via an ISCO 3700 autosampler (Teledyne Isco Inc., Lincoln, NE) on March 17, 2010 starting at 8 am. The influent flow during the sampling period was relatively constant throughout the day (1.6 ± 0.2 ML/hr (95% CI)). The autosampler was set to collect a wastewater subsample every 6 min over each 1-hr period. The samples were collected in 350 mL clear glass vials and kept on ice at 4°C during collection. The samples were shaken and approximately 40 mL from each 1-hr composite was transferred to 50mL HDPE centrifuge tube and stored at -20°C until analysis. For method development purposes, grab samples of wastewater influent and effluent were collected in one L baked (450°C) and solvent rinsed (MeOH and acetone) amber glass vials and stored at 4°C. A river water sample was collected in a 0.5 L HDPE (high density polyethylene) bottle, stored at 4°C, and used for method development. Zebra fish housing (FH) water from a recirculating system was collected in a one L baked and solvent rinsed amber glass vial and stored at 4°C. The FH water was treated with sodium bicarbonate and Instant Ocean® salt, to maintain pH and conductivity, and contained 15 to 20 thousand fish.
Wastewater samples were centrifuged in an IEC clinical centrifuge (Thermo IEC, Nutley, NJ) at 1625 RCF (Relative Centrifugal Force) for 15 min. Supernatant aliquots of 2.5 mL were transferred to a six mL glass autosampler vial and spiked with 188 pg of each stable-isotope internal standard available during the study (d3-Stan, d3-Bold, d3-Test). River and FH water samples were allowed to settle and required no centrifugation. Five mL of each river water sample was placed in a six mL glass autosampler vial and spiked with 375 pg of each internal standard.
Liquid Chromatography
An Agilent 1100 Series HPLC system (Santa Clara, California) was modified with a 900 μL Injection Upgrade Kit (Agilent part no. G1363-90100) and a Multidraw Upgrade Kit (Agilent part no. G1313-90100) that came with a 1,400 μL seat capillary. Additionally, a 5,000 μL seat capillary (Agilent part no. 0101-0301) was purchased. The HPLC was controlled via Agilent ChemStation (Rev. A 10.02 [1757]).
Injection volumes of 1,800 μL were employed for wastewater influent and effluent, as described in Chiaia et al.31 Briefly, one 900 μL sample volume was loaded in the 1,400 μL seat capillary and a second 900 μL sample volume was drawn into the needle loop for a total of 1,800 μL. For river and FH water, 4,500 μL injection volumes were performed by ejecting five 900 μL sample volumes into the 5,000 μL seat capillary.
Analyte separations were performed on a 4.6 × 12.5 mm × 5 μ m particle diameter C18 ZORBAX Eclipse Plus guard column combined with a 4.6 × 150 mm 3.5 μ m particle diameter ZORBAX Eclipse Plus C18 analytical column (Agilent, Santa Clara, California). The mobile phase consisted of 0.02% formic acid in methanol (A) and 0.5 mM ammonium formate in ultra pure water (B). Upon injection, the LC injection valve was set to direct the mobile phase through the injection assembly and a post-column valve (Model E90, Valco Insturments Co. Inc., Huston, Texas) was set to direct the column eluent to waste. For 1,800 μL injections, the gradient started at 15% A at one mL/min and was held for 5.6 min to load the sample on the column and then to wash the column. Next, the flow was reduced to 0.5 mL/min over a tenth of a min and the injection valve was set so that the mobile phase bypassed the injection assembly, which reduces mobile phase dwell time. The injection valve was switched after a sufficient amount of mobile phase had passed through the seat capillary (wash time) to quantitatively transfer the entire analyte sample to the column which eliminated system carryover. Over the next 8.4 min, the gradient was ramped to 70% A and held for 8.3 min. Finally, the gradient was then ramped to 97.5% A over 5.6 min and held for 10 min. All the analytes eluted before 29 min, the extra 9.4 min of 97.5% A acted to elute the most hydrophobic matrix components off the column. At 16 min, the post-column valve directed the column eluent to the mass spectrometer and at 29 min the post-column valve diverted it back to waste. The column re-equilibrated to initial conditions during the subsequent run's injection sequence. The gradient profile allowed for the separation of the two early eluting isomers of Trenbolone. The gradient was similar for 4,500 μL injections, except that the initial 15% A was held for 10 min at one mL/min and the post-column valve redirects the column eluent to the mass spectrometer at 22.5 min and back to waste at 36.4 min.
Tandem Mass Spectrometry
A SCIEX API 3000 (Applied Biosystems; Foster City, CA) tandem mass spectrometer was equipped with an electrospray ionization (ESI) interface (Turbo Ionspray) and controlled via Analyst (version 1.5.1.). All sample analyses were performed by MRM in positive ionization mode. The source conditions for temperature, nebulizing gas, and Turbo Ionspray gas were: 500°C, 35 bar, and 8000 cc/min, respectively. Analyte standards were made in MeOH at approximately one mg/L and infused into the mass spectrometer at 10 to 20 μL/min via a syringe pump (Harvard Apparatus; Holliston, MA) to determine the most intense precursor [M+H]+ and product ions and to optimize the declustering and focusing potential (DP and FP), collision energy (CE), and collision cell exit potential (CXP) for each compound (Table 1). The precursor and product ions identified for the analytes are consistent with previously published literature.45, 46
Table 1.
Analyte, precursor and productions, compound-dependent mass spec parameters†, compound class* and internal standard used for quantification.
| Analyte | Parent Ion (m/z) | Frag Ions (m/z) | C.E. (V) | C.X.P. (V) | D.P. (V) | F.P. (V) | Class | Internal Standard |
|---|---|---|---|---|---|---|---|---|
| Test | 289 | 97 | 33 | 6 | 61 | 240 | P | d3 -Test |
| 109 | 35 | 18 | ||||||
| d3 -Test | 292 | 97 | 33 | 6 | 61 | 240 | IS | NA |
| 109 | 35 | 18 | ||||||
| Andro | 287 | 97 | 34 | 16 | 104 | 282 | P | d3 -Test |
| 109 | 34 | 5 | ||||||
| Bold | 287 | 121 | 31 | 8 | 70 | 265 | P | d3-Bold |
| 135 | 19 | 12 | ||||||
| d3-Bold | 290 | 121 | 33 | 22 | 70 | 265 | IS | NA |
| 138 | 23 | 7 | ||||||
| 5-Andro | 289 | 187 | 27 | 16 | 101 | 210 | MBold | d3-Bold |
| 69 | 43 | 12 | ||||||
| Meta | 301 | 149 | 21 | 8 | 51 | 180 | P | d3 -Test |
| 121 | 35 | 6 | ||||||
| 6-Meta | 317 | 281 | 18 | 18 | 56 | 250 | MMeta | d3-Bold |
| 299 | 13 | 18 | ||||||
| Stan | 329 | 81 | 71 | 14 | 66 | 220 | P | NA |
| 95 | 59 | 16 | ||||||
| d3-Stan | 332 | 81 | 76 | 14 | 159 | 301 | IS | d3-Stan |
| 95 | 60 | 16 | ||||||
| 16-Stan | 345 | 81 | 73 | 14 | 71 | 240 | MStan | d3-Stan |
| 95 | 61 | 16 | ||||||
| Tren | 271 | 253 | 30 | 16 | 58 | 268 | P | d3-Bold |
| 199 | 33 | 16 | ||||||
| Epi-Tren | 271 | 253 | 30 | 16 | 58 | 268 | MTren | d3-Bold |
| 199 | 33 | 16 | ||||||
| Mete | 303 | 83 | 35 | 14 | 51 | 230 | P | d3-Bold |
| 187 | 29 | 16 | ||||||
| CH3-Test | 303 | 97 | 37 | 16 | 56 | 240 | P | d3 -Test |
| 109 | 35 | 18 | ||||||
| Nan | 275 | 109 | 37 | 18 | 66 | 180 | P | d3-Bold |
| 257 | 17 | 42 | ||||||
| Tetra | 313 | 295 | 21 | 20 | 126 | 344 | P | d3-Bold |
| 241 | 31 | 14 | ||||||
| Ox | 307 | 289 | 17 | 24 | 86 | 340 | P | d3 -Test |
| 271 | 19 | 26 | ||||||
| Epi-Ox | 307 | 289 | 17 | 24 | 86 | 340 | MOX | d3-Bold |
| 271 | 19 | 26 |
Quantitation and Identification
Calibration standards were made in 5 mM ammonium formate in 10% MeOH/ultra pure water that was adjusted to pH 8.1 using 0.5 N NaOH. Calibration standards ranged from concentrations of 2.3 to 6,000 ng/L. For 1,800 and 4,500 μL injection volumes, an internal standard solution was spiked into each sample yielding an analyte mass of 188 or 375 pg in sample volumes of 2,500 and 5,000 μL, respectively. Analyte responses were normalized to internal standards and quantified from calibration standards (n = 5 or 6) by linear least square regression. All regression curves had a coefficient of determination (R2) > 0.99. Positive analyte identification required that its retention was ± 0.25 min from the average retention time of authentic standards. Two product ions were selected for each compound, one for quantitation and one for qualitative analyte confirmation (Table 1). Quantitative to qualitative ion ratios were required to be within 20% of those in over-spiked duplicate samples, because some analytes that were spiked into blank wastewater and river water produced product ion ratios that were different from analytical standards.
Quality Control
Quality control for the demonstration study included three sample duplicates, four blanks, and four calibration check standards (from 60 to 750 ng/L) that were run after every six to eight samples in the sequence. Duplicates were chosen randomly using a random number generator. Quality control accounted for 35% of the sample sequence. All calibration standards checks were ± 12% of their nominal concentration. The percent difference between duplicates was less than 14%; no analytes were detected in the blanks.
Injection Volume Optimization
The HPLC autosampler was configured to perform 5,000 μL injections. Wastewater influent, effluent, and FH water samples were spiked to final concentrations of 150 to 250 ng/L for selected analytes. Injection volumes were varied from 900 to 5,000 μL in order to assess the optimal injection volume for each matrix. Optimal injection volumes were selected by determining the maximum volume beyond which there was no increase in signal to noise (sensitivity).
Standard Addition, Accuracy, and Precision
Analyte concentrations in wastewater influent were determined from standard addition and compared to values obtained by internal standard calibration for the purpose of assessing the validity of using solvent-based calibration for analyte quantification. A working analyte stock was prepared at 375,000 ng/L and spiked into 25 mL of wastewater influent that gave no detectable analyte signals, yielding analyte concentrations ranging from 60 to 1,600 ng/L. Standard addition was performed using a nine-point calibration curve, which included four samples at the initial spike concentration and five standard additions corresponding to an increase of 0.5, 0.75, 1, 1.25, and 1.5 fold over the initial spike concentration. Standard additions were spiked with a separate working analyte stock made in ultra-pure water containing five mM ammonium formate and adjusted to pH 8.1 with 6 M NaOH. The four samples at the initial spike concentration also were quantified using three different internal standard calibration curves, one for each of the three internal standards that were available. For each analyte, the internal standard whose calibration values provided the best agreement to quantification derived by standard addition was used for subsequent analysis (Table 1).
Accuracy was determined for each analyte in wastewater influent, effluent and river water by analyzing each matrix in quadruplicate using internal standard based calibration. Accuracy was defined as the percent of the calculated analyte concentration over the nominal spiked concentration. Spiked samples in each matrix were prepared as described above at analyte concentrations ranging from 10 to 2,000 ng/L. Within-run method precision was quantified by calculating the RSD of quadruplicate samples.
Limit of Detection and Quantitation
There is currently no unified method for reporting detection limits for HPLC analyses.47 The limit of detection (LOD) and limit of quantitation (LOQ) in this study were calculated by multiplying the standard deviation of the area of the background noise (n = 10) in the matrix of interest by 3.3 and 10, respectively. Then, that number was divided by the slope of an analyte's calibration curve prepared near detection in the same matrix.48 Calibration curves used to calculate LOD and LOQ for each analyte contained no less than 13 points and were made in matrices characterized by no detectable background signal.
Storage Stability
A storage stability study was performed to determine the stability of androgens stored in wastewater influent at -20°C over 60 days. A 100 mL wastewater influent grab sample was analyzed for native steroids and tested positive for Andro, Test and Bold. The sample was then spiked with analytes that were not present above detection producing concentrations ranging from 150 to 1000 ng/L. Seven vials were filled with 12 mL of sample and analyzed in quadruplicate at 0, 1, 2, 8, 19, 31, and 60 days.
Boldenone Production in Wastewater
To test the hypothesis that Test is converted to Bold in wastewater influent during transit to the WWTP, 500 mL of influent was spiked with d3-Test to give a final concentration of 300 ng/L (1.03 nM) and monitored for the production of d3-Bold over 24-hr. An experimental duration of 24-hr was selected because it exceed the maximum estimated transit time of wastewater (8 hr) for the municipal system studied. The sample was kept between 18 and 22°C in a sealed 500 mL glass amber bottle with minimal head space and placed on a rotary shaker for the duration of the experiment. The bottle was only opened to collect samples (n = 3 per time point) for analysis at 0, 2, 6, 12, and 24-hr. Since d3-Test, d3-Bold were analytes d3-Stan was used as an internal standard for all analytes. Experimental conditions were meant to assess the potential for analyte formation in wastewater, not to fully simulate in-situ conditions.
Suspended Solids Extraction
Extraction of the solid phase associated with wastewater influent was performed to assess possible analyte loss due to sample centrifugation. Five single solid samples from selected 1-hr wastewater composites were removed, blotted on an absorbent tissue to remove residual water, placed in a 1.5 mL microcentrifuge vial, and frozen at -20°C until analysis. Methanol was chosen as an extraction solvent because it has been used for extraction of estrogenic steroids from sediment and sludge samples.29 Extractions were carried out in triplicate and performed by adding 200 μL MeOH to each sample, vortexing for 30 s and sonicating for 6 min. Samples and their extracts were then centrifuged at 8154 RCF for 4 min in a microcentrifuge (5415 C, Eppendorf, Hauppauge, NY). The supernatant was transferred to a six mL autosampler vial and the final volume was brought to 2,500 μL with 5 mM ammonium formate in pure water adjusted to a pH of 8.1, and analyzed as described above.
Results and Discussion
Large-volume Injection Liquid Chromatography
The LVI chromatography method employed produced good analyte peak shape and separation for analytes at or near their detection limit in wastewater influent (Figure 1), effluent (Figure S1), and river water (Figure S2). Solid phase extraction was eliminated by the use of large sample volumes (1,800 and 4,500 μL) that are directly injected onto the analytical column. Large-volume injection reduces the amount of solvent necessary to process the sample, which can be over 50 mL per sample for just the SPE step in environmental androgen analysis.22, 23
Figure 1.
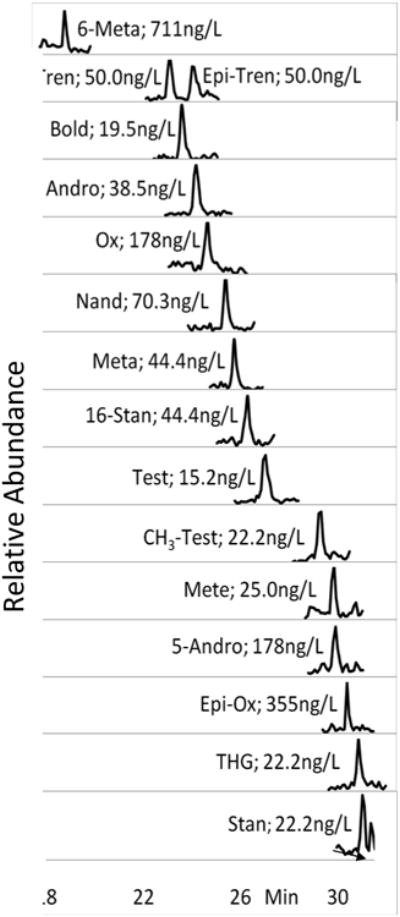
Chromatograms of analytes at or near their LOD in wastewater influent. Test, Andro, Bold, and Nand are native signals.
The same column was used throughout the entirety of this study and column performance did not noticeably decrease compared to more traditional chromatography utilizing small (20-100 μL) injections. However, it was necessary to replace the guard column after an average of 50 injections to prevent degradation in the chromatography.
Carryover of two analytes (Stan and 16-Stan) was observed initially only for injections of standards made in 10% MeOH/Water. Carryover was resolved by increasing the wash time of the seat capillary and making all analytical standards in buffered 10% MeOH/Water (See Experimental Section).
Injection Volume
Systematically increasing the injection volume of influent (Figure S3) and effluent (Figure S4) demonstrated that signal to noise (S/N) did not increase appreciably above 1,800 μL. For this reason 1,800 μL sample injection volumes were selected for the analysis of wastewater influent and effluent. In FH water, S/N increased with injection volumes up to 4,500 μL (Figure S5). Similar experiments were not performed with river water.
Standard Addition, Accuracy and Precision
Internal standard calibration provided statistically (p-value > 0.05, two sided t-test) equivalent concentration values to concentrations derived from standard addition for 13 analytes (Table S1), which validated their use for subsequent analyte quantification (Table 1). 5β-Androst-1-en-17β-ol-3-one, 6-Meta, and Epi-Ox differed significantly (p value < 0.05, two tailed t-test) from the concentrations calculated by internal standard calibrations to concentrations calculated by standard addition (Table S1), so the internal standard that provided the closest agreement (Table 1) was used for subsequent analyses. These differences are most likely attributed to matrix components effecting the ionization of 5-Andro, 6-Meta, and Epi-Ox differently than the internal standards avalable.49
Analytes with well-matched internal standards provided whole-method accuracy ranging from 87.6 to 108% for influent, 96.3 to 107% for effluent, and 93.9 to 108% for river water (Table 2). Analytes not well represented by their internal standard (5- Andro, 6-Meta, and Epi-OX) gave modest method accuracy for influent (62.3 to 84.8%) but improved in the less complex matrices, including effluent (76.4 to 93.4%) and river water (80.7 to 103%) (Table 2). Improved accuracy in wastewater effluent and river water is most likely due to a reduction of matrix effects from fewer matrix components when compared to wastewater influent.49 Whole-method accuracy obtained by LVI is improved compared to whole-method accuracy by online- and offline-SPE for the analysis of steroids in similar matrices.12, 22-25 The within-run precision of this method ranged from 1.2 to 8.9% for river water, 2.2 to 9.8% for effluent, and 1.2 to 8.8% for influent (Table 2). The within-run precision is comparable to those published for estrogens12 and androgens22, 24, 25 in similar matrices.
Table 2. Whole-method accuracy, determined for spiked concentrations ([Spike]), and relative standard deviation (RSD) outline the method performance in each matrix Limit of detection (LOD) and quantitation (LOQ) values for analytes in each matrix.
| Waste Water Influent | Waste Water Effluent | Willamette River Water | |||||||||||||||
|---|---|---|---|---|---|---|---|---|---|---|---|---|---|---|---|---|---|
| Analyte | Accuracy* (%) |
[Analyte] (ng/L) |
RSD† (%) |
LOD (ng/L) |
LOQ (ng/L) |
Analyte | Accuracy* (%) |
[Analyte] (ng/L) |
RSD† (%) |
LOD (ng/L) |
LOQ (ng/L) |
Analyte | Accuracy* (%) |
[Analyte] (ng/L) |
RSD† (%) |
LOD (ng/L) |
LOQ (ng/L) |
| Test | 108 ± 5.5 | 90 | 4.5 | 6.2 | 19 | Test | 101 ± 2.5 | 75 | 2.2 | 4.8 | 15 | Test | 99.2 ± 6.3 | 10 | 5.7 | 1.2 | 3.7 |
| Ando | 87.6 ± 6.2 | 60 | 6.3 | 6.2 | 19 | Ando | 101 ± 5.1 | 75 | 4.6 | 5.0 | 15 | Ando | 106 ± 3.4 | 15 | 2.9 | 1.5 | 4.5 |
| Bold | 98.4 ± 6.3 | 60 | 5.7 | 8.5 | 26 | Bold | 101 ± 3.8 | 75 | 3.4 | 6.2 | 19 | Bold | 108 ± 5.0 | 10 | 4.1 | 2.3 | 7.1 |
| 5-Andro | 78.6 ± 7.8 | 1600 | 8.8 | 120 | 360 | 5-Andro | 86 ± 3.5 | 2000 | 3.7 | 100 | 300 | 5-Andro | 95.7 ± 3.8 | 89 | 3.5 | 12 | 35 |
| Meta | 108 ± 8.9 | 200 | 7.3 | 18 | 54 | Meta | 104 ± 2.5 | 250 | 3.7 | 13 | 41 | Meta | 105 ± 6.3 | 22 | 3.3 | 3.8 | 12 |
| 6-Meta | 62.3 ± 3.9 | 1600 | 5.6 | 360 | 1100 | 6-Meta | 76.4 ± 8.4 | 2000 | 9.8 | 150 | 470 | 6-Meta | 80.7 ± 7.5 | 89 | 8.2 | 28 | 83 |
| Stan | 107 ± 7.6 | 200 | 6.4 | 11 | 33 | Stan | 107 ± 3.3 | 250 | 2.8 | 17 | 52 | Stan | 103 ± 4.6 | 22 | 4.0 | 3.2 | 9.8 |
| 16-Stan | 101 ± 5.7 | 200 | 5.1 | 19 | 58 | 16-Stan | 103 ± 4.2 | 250 | 3.6 | 17 | 76 | 16-Stan | 104 ± 4.2 | 22 | 3.6 | 3.3 | 10 |
| Tren | 96.6 ± 5.2 | 200 | 5.6 | 28 | 85 | Tren | 96.3 ± 6.9 | 250 | 6.3 | 19 | 57 | Tren | 93.9 ± 5.1 | 22 | 4.8 | 3.7 | 11 |
| Epi Tren | 93.9 ± 2.2 | 200 | 2.1 | 31 | 95 | Epi Tren | 100 ± 5.0 | 250 | 4.5 | 20 | 62 | Epi Tren | 98.2 ± 7.0 | 22 | 6.4 | 4.4 | 13 |
| Mete | 94.3 ± 8.5 | 200 | 8.1 | 22 | 67 | Mete | 96.3 ± 6.0 | 250 | 5.6 | 20 | 60 | Mete | 105 ± 8.4 | 22 | 7.1 | 4.3 | 13 |
| CH3-Test | 102 ±2.9 | 200 | 2.5 | 13 | 40 | CH3-Test | 102 ± 4.3 | 250 | 3.7 | 7.9 | 24 | CH3-Test | 99.5 ± 4.8 | 22 | 4.3 | 1.8 | 5.3 |
| Nand | 104 ± 8.3 | 200 | 7.2 | 23 | 68 | Nand | 96.8 ± 3.7 | 250 | 3.4 | 19 | 57 | Nand | 101 ± 2.7 | 22 | 2.4 | 3.2 | 9.8 |
| THG | 102 ± 9.9 | 200 | 8.7 | 8.1 | 24 | THG | 97.6 ± 7.0 | 250 | 6.4 | 8.0 | 24 | THG | 105 ± 2.3 | 22 | 1.9 | 1.8 | 5.6 |
| Ox | 103 ± 1.4 | 750 | 1.2 | 100 | 310 | Ox | 102 ± 4.8 | 1000 | 4.2 | 82 | 250 | Ox | 107 ± 8.1 | 89 | 6.8 | 19 | 58 |
| Epi-Ox | 84.8 ± 7.2 | 1600 | 7.6 | 210 | 620 | Epi-Ox | 93.4 ± 9.6 | 2000 | 9.2 | 120 | 360 | Epi-Ox | 103 ± 6.8 | 89 | 5.9 | 18 | 54 |
Accuracy is calculated as the average (n = 4, ± 95% CI) percent calculated internal standard calibration concentration over the spiked concentration ([Spike]).
Relative standard deviation was calculated from concentration values used to determine accuracy (n = 4).
Storage Stability
Over the 60 day time period of the storage stability study analyte concentrations plotted as a function of time yielded slopes that were not statistically different from zero (p >0.05, at 95% C.I.)50 for all analytes, with the exception of Test and Epi-Ox. This indicated that there was no degradation over 60 days for a majority of the analytes. Test (p-value = 0.01) and Epi-Ox (p-value = 0.04) had a slight positive slope which indicates either no degradation of Test and Epi-Ox or analyte formation. The latter seems plausible for Epi-Ox since it is a metabolite of Ox, and the concentration of Ox decreased slightly, although not significantly (p-value = 0.09). The storage stability study allowed for an analysis of the inter and intra-day RSDs for the method applied to wastewater influent (Table S2).
Limit of Detection and Quantitation
The limit of detection for analytes ranged from 1.2 to 28 ng/L for river water, 4.8 to 150 ng/L for effluent and 6.2 to 360 ng/L for influent (Table 2). Comparisons of LOD are difficult due to differences in analytes, matrices, detectors, calculation, and unreported experimental details. However, the method presented here has comparable LODs to other studies when the masses of the analyte delivered to the detector are compared. For example, reported LODs for Test in wastewater influent are 1.0 pg,22 4.0 pg,25 and 11 pg (current study) and reported LODs for Andro in wastewater influent are 7.5 pg,25 11 pg (current study) and 13 pg.22
Method Demonstration: Temporal Trends of Androgens in Wastewater Influent
Testosterone, Andro, and Bold were above detection in each 1-hr composite at concentrations up to 45, 290, and 110 ng/L, respectively, over the 24-hr sampling period. Nand was detectable in seven samples at concentrations up to 70 ng/L (Figure 2). Analyte concentration values were multiplied by the hourly flow to calculate analyte loads (mg) (Figure S6).
Figure 2. Diurnal profiles of analyte concentrations (± RSD*) present in the one hour composite influent samples.
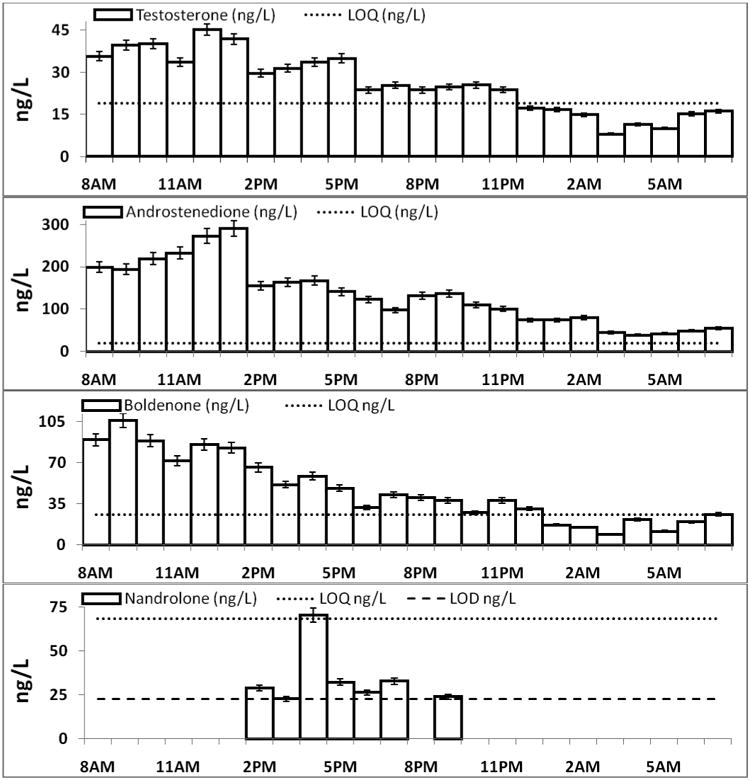
*Error bars are represented by concentration values (ng/L) multiplied by the within run RSD.
Androstenedione is a direct precursor in the human endogenous production of Test; therefore, it is not surprising that the Andro and Test were detected in every sample. A 1 day Test load of 1,023 ± 10 mg was computed by summing the individual one hour loads and propagating the uncertainty about their error (loads multiplied by within-run RSD). (Figure S6) However, 1,023 mg is a conservative estimate given that Test may be present in the wastewater as conjugated species. The computed total load is in general agreement with an estimated load of 1,744 mg Test calculated from the assumptions that 1) the average excretion of Test for males is 56.65 μg/d and 6.78 μg/d for females,51 2) the WWTP served a static population of 55,000 with a 1:1 male to female ratio, and 3) no analyte degradation. Data for Ando excretion by humans is limited,51 therefore a similar comparison was not performed. However, Andro is six times more concentrated on average in the wastewater samples compared to Test, which is in agreement with trends reported previously for the two analytes in wastewater.21, 22
Boldenone was detected in all the 1-hr composite influent samples over the 24-hr study period with concentrations (Figure 2) and loads (Figure S6) greater than Test. Boldenone was previously reported in 24-hr flow-proportional influent samples at concentrations up to 2,419 ng/L.24 Boldenone had temporal concentration and load profiles similar to Test and Andro, which was somewhat unexpected. Bold is a synthetic anabolic steroid of abuse, that can, in rare cases, be produced endogenously in humans.26, 52About 3 out of 10,000 doping control samples test positive for Bold.26 It is hypothesized that microbes in the gut with 1,2-steroid dehydrogenase activity convert Test to Bold and are responsible for the endogenous excretion of Bold in humans.26, 52, 53 It seems unlikely that the ubiquitous presence of Boldenone reported in this study is only from rare endogenous production. Boldenone is also used in equine veterinary medicine,40, 41 but not commonly employed by local veterinarians,54 so veterinary use was ruled out as a potential source. Boldenone is one of the most commonly abused anabolic steroids.42-44 Although, it seems unlikely that illicit use alone is responsible for its widespread presence, since it is estimated that only one percent of the United States population abuse androgenic steroids.44 A compound illicitly abused by only a small population of users is assumed to be intermittently excreted and contained in a few discrete number of wastewater pulses.36 However, Bold is detected at all time points and has loads higher than endogenous Test (Figure S6). This is a unique temporal trend that would have been missed without high temporal resolution sampling.
Hourly influent loads of Test and Bold are statistically correlated at 99% CI (r = 0.94, p-value < 0.0001) (Figure S7), which suggests that Bold loads are connected to Test loads in wastewater. Therefore, we hypothesized that 1,2,-steroid dehydrogenase activity present in wastewater influent was converting Test to Bold in-situ. An experiment was carried out to test this hypothesis by spiking d3-Test in influent and monitoring for d3-Bold production over time. A steady decrease was seen in d3-Test concentrations over time with no corresponding increase in d3-Bold (Figure S8), which indicate that Bold is not a transformation product of Test.
In contrast, there was a significant (one sided t-test, p-value < 0.05) increase in the native concentration of Bold over 6 hr (Figure S8). An explanation for the rise in the concentration of Bold over time could be due to a gradual deconjugation of glucuronide and sulfate conjugated Bold in wastewater. Estrogens undergo deconjugation in wastewater, presumably due to Escherichia coli which produce glucuronidase and sulfatase enzymes.6, 9, 11, 28 Further study is needed to elucidate if Bold is an in-situ transformation product of a related compound, an endogenous human excretion product, from illicit use, from a potential unknown source, or from a combination of sources. Interestingly, Andro followed a similar trend with a significant (one sided t-test, p-value < 0.05) increase in concentration over 6 hr (Figure S8). Andro is a biological oxidation product of Test in soils and biological waste,55-57 and could explain why concentrations of Andro increased over time during the experiment. This is supported by the fact that concentrations of Test, while below quantitation, decreased to below detection over 24-hrs.
Nandrolone was quantified in one sample and detected in six others (Figure 2). The occurrence of Nand, in this study, is likely from illicit and/or medical use. Nand is widely abused as a doping agent to improve athletic performance and body image,42-44 and can be used medically as a treatment for anemia associated with renal insufficiency.38 Although, Nand is a required metabolic intermediate in estrogen synthesis,58, 59 it is not known to be endogenously excreted by humans. Further study needs be performed to elucidate its source. Detection of the trace levels of Nand was made possible by the high frequency (samples taken every 6 min) and high resolution (1-hr composites) sampling protocol. Pooling the influent samples into a single 24-hr composite would have resulted in an estimated Nand concentration of 10 ng/L, which is below its LOD in wastewater influent (Table 2). Furthermore, a grab sample, or less frequent sampling, may have missed the Nand pulses completely.36, 37 To the best of our knowledge, only one other study documents the detection of Nand in wastewater (a single sample) at 1.7 ng/L, near their reported LOD for Nand (1.6 ng/L).25
Analysis of Solids
Centrifugation of wastewater samples results in a small solid pellet that is left in the bottom of the centrifuge tube (approximately 1 to 10 mg). To the best of our knowledge, currently there is no work on the sorption of androgenic steroids to the particulate phase in wastewater, and very little involving estrogens.29, 30 However, previous research indicates that androgens sorb to solid organic matter in soil and sediment.56, 60, 61 It is possible that the sorption of androgens to the solid phase is a potential source of analyte loss during wastewater analyses when centrifugation or filtration is used to remove the solid phase. To test this hypothesis, five solid samples from the 1-hr composite influent samples were extracted as described above. Test was detectable in one sample but below LOQ. Andro was detected in every sample and quantified in two. The quantified Andro mass sorbed to the solids was five and seven % of the total Andro mass. Calculated Kd (solid:water partition) values for quantified Andro concentrations were 31.5 and 46.3 L/kg which fell within a range of reported Kd values of Andro sorbing to soil.56
Conclusion
The LVI analytical method described above produces analyses of androgens in wastewater and environmental matrices without the laborious and expensive sample cleanup and pre concentration steps associated with SPE. The method yields results that are precise, reproducible, and that require only minor hardware modifications to commercially available LCs. LODs and LOQs are in the low ng/L range and are suitable for detection of androgens at environmentally-relevant concentrations. Furthermore, application of this method to related compounds (estrogens) or matrices (urine) would require only slight method modifications.
The method described here was used to analyze 24 wastewater influent samples taken as 1-hr composites. This high-temporal resolution approach to sampling allowed for an analysis of analyte concentrations and loads over time. Four analytes of interest were detected: testosterone, androstenedione, boldenone, and nandrolone. Testosterone and androstenedione are endogenous compounds that were detected in all samples.
Without the use of high-temporal resolution sampling the temporal trends in wastewater influent loads of boldenone would have been missed. Boldenone's ubiquity in the sample set is somewhat of an anomalous finding, considering it is a synthetic androgen of abuse and has loads that correlate strongly to testosterone loads. The study presented here ruled out in-situ transformation of testosterone to boldenone as a potential source of boldenone's ubiquity. Further investigation into the source of Boldenone is needed.
The low and infrequent wastewater loads of Nandrolone observed in this study may have been diluted below detection if a lower temporal resolution sampling strategy had been performed. The detection of Nandrolone in wastewater was likely from its use either medically or illicitly.
Supplementary Material
Acknowledgments
This publication was made possible, in part, by technical assistance by Jeff Morre of the Mass Spectrometry Facility Core of the Environmental Health Sciences Center at Oregon State University. Funding was provided, in part, by a Tartar Fellowship from OSU's Department of Chemistry and a General Research Fund grant from OSU. We would also like to thank Daniel Sudakin from the Environmental and Molecular Toxicology department at Oregon State University for his help in obtaining analytical standards. We are grateful for information on veterinary steroid use provided by Charles T. Estill and Candace Remcho. This study would not have been possible without the assistance of Guy Allen for his help in facilitating the collection of wastewater samples. We would also like to acknowledge Ben Place, Norm Forsberg, Steven O'Connell, and Amanda Brennan and Mindy Berger for their support, help with data analysis, and reviews.
Literature Cited
- 1.Ternes TA. Wat Res. 1998;11:3245–3260. [Google Scholar]
- 2.Ankley GT, Jensen KM, Makynen EA, Kahl MD, Korte JJ, Hornung MW, Henry TR, Denny JS, Leino RL, Wilson VS, Cardon MC, Hartig PC, Gray LE. Environ Toxicol Chem. 2003;22:1350–1360. [PubMed] [Google Scholar]
- 3.Jensen KM, Makynen EA, Kahl MD, Ankley GT. Environ Sci Technol. 2006;40:3112–3117. doi: 10.1021/es052174s. [DOI] [PubMed] [Google Scholar]
- 4.Thorpe KL, Cummings RI, Hutchinson TH, Scholze M, Brighty G, Sumpter JP, Tyler CR. Environ Sci Technol. 2003;37:1142–1149. doi: 10.1021/es0201348. [DOI] [PubMed] [Google Scholar]
- 5.Routledge EJ, Sheahan D, Desbrow C, Brighty GC, Waldock M, Sumpter JP. Environ Sci Technol. 1998;32:1559–1565. [Google Scholar]
- 6.D'Ascenzo G, Di Corcia A, Gentili A, Mancini R, Mastropasqua R, Nazzari M, Samperi R. Sci Total Environ. 2003;302:199–209. doi: 10.1016/s0048-9697(02)00342-x. [DOI] [PubMed] [Google Scholar]
- 7.Desbrow C, Routledge EJ, Brighty GC, Sumpter JP, Waldock M. Environ Sci Technol. 1998;32:1549–1558. [Google Scholar]
- 8.Ferguson PL, Iden CR, McElroy AE, Brownawell BJ. Anal Chem. 2001;73:3890–3895. doi: 10.1021/ac010327y. [DOI] [PubMed] [Google Scholar]
- 9.Gomes RL, Scrimshaw MD, Lester JN. Environ Sci Technol. 2009;43:3612–3618. doi: 10.1021/es801952h. [DOI] [PubMed] [Google Scholar]
- 10.Lai KM, Johnson KL, Scrimshaw MD, Lester JN. Environ Sci Technol. 2000;34:3890–3894. [Google Scholar]
- 11.Reddy S, Iden CR, Brownawell BJ. Anal Chem. 2005;77:7032–7038. doi: 10.1021/ac050699x. [DOI] [PubMed] [Google Scholar]
- 12.Rodriguez-Mozaz S, Lopez de Alda MJ, Barcelo D. Anal Chem. 2004;76:6998–7006. doi: 10.1021/ac049051v. [DOI] [PubMed] [Google Scholar]
- 13.Ternes TA, Stumpf M, Mueller J, Haberer K, Wilken RD, Servos M. Sci Total Environ. 1999;225:81–90. doi: 10.1016/s0048-9697(98)00334-9. [DOI] [PubMed] [Google Scholar]
- 14.Cody RP, Bortone SA. Bull Environ Contam Toxicol. 1997;58:429–436. doi: 10.1007/s001289900352. [DOI] [PubMed] [Google Scholar]
- 15.Purdom CE, Hardiman PA, Bye VVJ, Eno NC, Tyler CR, Sumpter JP. Chem and Ecol. 1994;8:275–285. [Google Scholar]
- 16.Larsson DG, Hallman H, Forlin L. Environ Toxicol Chem. 2000;19:2911–2917. [Google Scholar]
- 17.Durhan EJ, Lambright CS, Makynen EA, Lazorchak J, Hartig PC, Wilson VS, Gray LE, Ankley GT. Environ Health Perspect. 2005;114:65–68. doi: 10.1289/ehp.8055. [DOI] [PMC free article] [PubMed] [Google Scholar]
- 18.Kirk LA, Tyler CR, Lye CM, Sumpter JP. Environ Toxicol Chem. 2002;21:972–979. [PubMed] [Google Scholar]
- 19.Kumar V, Chakraborty A, Viswanath G, Roy P. Toxicol Appl Pharmacol. 2008;226:60–73. doi: 10.1016/j.taap.2007.08.023. [DOI] [PubMed] [Google Scholar]
- 20.Leusch FDL, Chapman HF, van den Heuvel MR, Tan BLL, Gooneratne SR, Tremblay LA. Ecotoxicol Environ Saf. 2006;65:403–411. doi: 10.1016/j.ecoenv.2005.07.020. [DOI] [PubMed] [Google Scholar]
- 21.Liu Z, Ito M, Kanjo Y, Yamamoto A. J Environ Sci. 2009;21:900–906. doi: 10.1016/s1001-0742(08)62356-6. [DOI] [PubMed] [Google Scholar]
- 22.Chang H, Wu S, Hu J, Asami M, Kunikane S. J Chromatogr, A. 2008;1195:44–51. doi: 10.1016/j.chroma.2008.04.055. [DOI] [PubMed] [Google Scholar]
- 23.Rice SL, Hale RC. Anal Chem. 2009;81:6716–6724. doi: 10.1021/ac900134m. [DOI] [PubMed] [Google Scholar]
- 24.Schroder HF, Gebhardt W, Thevis M. Anal Bioanal Chem. 2010;398:1207–1229. doi: 10.1007/s00216-010-3958-3. [DOI] [PubMed] [Google Scholar]
- 25.Sun L, Liu Y, Chu X, Lin J. Chromatographia. 2010;71:867–873. [Google Scholar]
- 26.Schänzer W. Clin Chem. 1996;42(7):1001–1020. [PubMed] [Google Scholar]
- 27.Schänzer W, Donike M. Analytica Chimica Acta. 1993;275:23–48. [Google Scholar]
- 28.Ternes TA, Kreckel P, Mueller J. Sci Total Environ. 1999;225:91–99. doi: 10.1016/s0048-9697(98)00335-0. [DOI] [PubMed] [Google Scholar]
- 29.Gabet V, Miège C, Bados P, Coquery M. Trends Anal Chem. 2007;26:1113–1131. [Google Scholar]
- 30.Streck G. Trends Anal Chem. 2009;28:635–652. [Google Scholar]
- 31.Chiaia AC, Banta-Green C, Field J. Environ Sci Technol. 2008;42:8841–8848. doi: 10.1021/es802309v. [DOI] [PubMed] [Google Scholar]
- 32.Huset CA, Chiaia AC, Barofsky DF, Jonkers N, Kohler HPE, Ort C, Giger W, Field JA. Environ Sci Technol. 2008;42:6369–6377. doi: 10.1021/es703062f. [DOI] [PMC free article] [PubMed] [Google Scholar]
- 33.Schultz MM, Barofsky DF, Field JA. Environ Sci Technol. 2005;40:289–295. doi: 10.1021/es051381p. [DOI] [PMC free article] [PubMed] [Google Scholar]
- 34.Ingelse BA, van Dam RCJ, Vreeken RJ, Mol HGJ, Steijger OM. J Chromatogr, A. 2001;918:67–78. doi: 10.1016/s0021-9673(01)00660-4. [DOI] [PubMed] [Google Scholar]
- 35.Kiso Y, Li H, Shigetoh K, Kitao T, Jinno K. J Chromatogr, A. 1996;733:259–265. [Google Scholar]
- 36.Ort C, Lawrence MG, Reungoat J, Mueller JF. Environ Sci Technol. 2010;44:6289–6296. doi: 10.1021/es100778d. [DOI] [PubMed] [Google Scholar]
- 37.Ort C, Lawrence MG, Rieckermann J, Joss A. Environ Sci Technol. 2010;44:6024–6035. doi: 10.1021/es100779n. [DOI] [PubMed] [Google Scholar]
- 38.Basaria S, Wahlstrom JT, Dobs SA. J Clin Endocrinol Metab. 2001;86:5108–5117. doi: 10.1210/jcem.86.11.7983. [DOI] [PubMed] [Google Scholar]
- 39.Shahidi NT. Clin Ther. 2001;23:1355–1390. doi: 10.1016/s0149-2918(01)80114-4. [DOI] [PubMed] [Google Scholar]
- 40.Fajt VR, McCook C. Equine Vet Ed. 2008;20:542–544. [Google Scholar]
- 41.Ho ENM, Yiu KCH, Tang FPW, Dehennin L, Plou P, Bonnaire Y, Wan TSM. J Chromatogr, B. 2004;808:287–294. doi: 10.1016/j.jchromb.2004.05.018. [DOI] [PubMed] [Google Scholar]
- 42.NIST. Research Report Series: Anabolic Steroid Abuse. National Institute on Drug Abuse; Bethesda: 2006. [Google Scholar]
- 43.WADA. 2009 Adverrse Analytical Findings and Atypical Findings Reported by Accredited Laboratories. World Anti-Doping Agency; Montreal: 2010. [Google Scholar]
- 44.Parkinson AB, Evans NA. Med Sci Sports Exercise. 2006;38:644–651. doi: 10.1249/01.mss.0000210194.56834.5d. [DOI] [PubMed] [Google Scholar]
- 45.Guan F, Soma LR, Luo Y, Uboh CE, Peterman S. J American Society Mass Spec. 2006;17:477–489. doi: 10.1016/j.jasms.2005.11.021. [DOI] [PubMed] [Google Scholar]
- 46.Thevis M, Schänzer W. Mass Spec Rev. 2007;26:79–107. doi: 10.1002/mas.20107. [DOI] [PubMed] [Google Scholar]
- 47.Vial J, Jardy A. Analytical Chemistry. 1999;71(14):2672–2677. [Google Scholar]
- 48.Q2B. Validation of Analytical Procedures: Methodology. Therapeutic Products Programme, Health; Canada, Ottawa: 1999. [Google Scholar]
- 49.Taylor PJ. Clin Biochem. 2005;38:328–334. doi: 10.1016/j.clinbiochem.2004.11.007. [DOI] [PubMed] [Google Scholar]
- 50.Anderson RL. Practical Statistics for Analytical Chemists. Van Nostrand Reinhold Company Inc.; New York: p. 1987. [Google Scholar]
- 51.Liu Z, Kanjo Y, Mizutani S. Sci Total Environ. 2009;407:4975–4985. doi: 10.1016/j.scitotenv.2009.06.001. [DOI] [PubMed] [Google Scholar]
- 52.Tsivou M, Livadara D, Georgakopoulos DG, Koupparis MA, Atta-Politou J, Georgakopoulos CG. Anal Biochem. 2009;388:179–191. doi: 10.1016/j.ab.2009.02.016. [DOI] [PubMed] [Google Scholar]
- 53.Tsivou M, Livadara D, Georgakopoulos DG, Koupparis MA, Atta-Politou J, Georgakopoulos CG. Anal Biochem. 2009;388:146–154. doi: 10.1016/j.ab.2009.02.013. [DOI] [PubMed] [Google Scholar]
- 54.Estill CT. Personal Communications. In: Veterinary Steroid Use Research. Backe W, editor. Corvallis: Jan 11, 2010. Email. [Google Scholar]; Remcho C. In: Veterinary Steroid use. Backe W, editor. Corvallis: Jan 26, 2010. Email. [Google Scholar]
- 55.Jacobsen A, Lorenzen A, Chapman R, Topp E. J Environ Qual. 2005;34:861–871. doi: 10.2134/jeq2004.0331. [DOI] [PubMed] [Google Scholar]
- 56.Lee L, Strock TJ, Sarmah AK, Rao PSC. Environ Sci Technol. 2003;37:4098–4105. doi: 10.1021/es020998t. [DOI] [PubMed] [Google Scholar]
- 57.Yang Y, Borch T, Young RB, Goodridge LD, Davis JG. J Environ Qual. 2010;39:1153–1160. doi: 10.2134/jeq2009.0112. [DOI] [PubMed] [Google Scholar]
- 58.Bricout V, Wright F. Eur J Appl Physiol. 2004;92:1–12. doi: 10.1007/s00421-004-1051-3. [DOI] [PubMed] [Google Scholar]
- 59.Reznik Y, Dehennin L, Coffin C, Mahoudeau J, Leymarie P. J Clin Endocrinol Metab. 2001;86:146–150. doi: 10.1210/jcem.86.1.7100. [DOI] [PubMed] [Google Scholar]
- 60.Khan B, Qiao X, Lee LS. Environ Sci Technol. 2009;43:8827–8833. doi: 10.1021/es902112v. [DOI] [PubMed] [Google Scholar]
- 61.Kim I, Yu Z, Xiao B, Huang W. Environ Toxicol Chem. 2007;26:264–270. doi: 10.1897/06-270r1.1. [DOI] [PubMed] [Google Scholar]
Associated Data
This section collects any data citations, data availability statements, or supplementary materials included in this article.