

Abstract
Cells express many ribosome-interacting factors whose functions and molecular mechanisms remain unknown. Here, we elucidate the mechanism of a newly characterized regulatory translation factor, Energy-dependent Translational Throttle A (EttA), which is an Escherichia coli representative of the ATP-binding cassette F (ABC-F) protein family. Using cryo-EM, we demonstrate that the ATP-bound form of EttA binds to the ribosomal tRNA exit (E) site, where it forms bridging interactions between the ribosomal L1 stalk and the tRNA bound in the peptidyl-tRNA binding (P) site. Using single-molecule fluorescence resonance energy transfer (smFRET), we show that the ATP-bound form of EttA restricts ribosome and tRNA dynamics required for protein synthesis. This work represents the first example, to our knowledge, where the detailed molecular mechanism of any ABC-F family protein has been determined and establishes a framework for elucidating the mechanisms of other regulatory translation factors.
Keywords: protein translation regulation, ABC-F protein family, ribosome, cryo-EM, single-molecule FRET, YjjK
The efficient function of cells requires that ribosome biogenesis and activity be regulated in response to changing environmental and metabolic conditions1. However, the understanding of the molecular mechanism of many of these regulatory processes has remained limited, despite their biological importance. Many ribosome-interacting proteins beyond the canonical translation factors have been identified that are believed to function as regulatory translation factors1,2. Unfortunately, it has only been possible to elucidate the exact physiological role and mechanism of action for a relatively small subset of such regulatory translation factors. The limited progress in this area has impeded the development of atomic-resolution mechanistic models for translation regulation, despite the tremendous progress that has been made over the past two decades in understanding ribosome structure2,3 and many other aspects of protein synthesis. In the current study, we used a combination of biophysical methods to develop such a model for a novel translational regulatory factor called EttA, which is characterized for the first time in Boel et al.4. Close coordination of the work reported in these two papers has provided a unique opportunity to dissect the function and mechanism of EttA, which belongs to the ubiquitously distributed but minimally characterized ABC-F protein family.
Protein synthesis by the ribosome is a highly dynamic molecular process, particularly during the stage of polypeptide chain elongation. This stage involves cyclical execution of three steps2: (i) binding of a cognate aminoacylated tRNA to the mRNA codon at the aminoacyl-tRNA binding (A) site on the ribosome; (ii) synthesis of the next peptide bond in the peptidyl-transferase center (PTC) on the ribosome, a process which results in transfer of the nascent polypeptide chain from the tRNA bound in the peptidyl-tRNA binding (P) site to the newly bound tRNA in the A site; and (iii) translocation of the mRNA and the cognate tRNAs located in both the P and A sites, which moves these tRNAs to the exit (E) and P sites, respectively. Cryo-EM5,6 and smFRET7–11 measurements have been used to characterize the structure and dynamics of the ribosomal pretranslocation (PRE) complex that has completed the first two steps in the elongation cycle, but not the third. These studies demonstrate that the PRE complex exists in a spontaneous equilibrium between two global conformational states, called macrostates I and II (MS-I and MS-II)12 or global states 1 and 2 (GS1 and GS2)11. This equilibrium plays a central role in the translocation of the bound mRNA and tRNAs in the final step of the elongation cycle7–11,13.
Cryo-EM studies of PRE complexes have shown that the MS-I to MS-II transition involves a counterclockwise, ratchet-like rotation of the small ribosomal subunit relative to the large ribosomal subunit (when viewed from the solvent-accessible side of the small subunit)14. This rotation, which is accompanied by movement of the L1 stalk on the large subunit toward the small subunit, is coupled to a reconfiguration of the ribosome-bound tRNAs and moves them into a “hybrid”state in which their acceptor stems are closer to their post-translocation locations6,15. Modulation of the MS-I to MS-II transition by the universally conserved translation factor EF-G is essential for efficient translocation during the elongation cycle8,11. The MS-I to MS-II transition also represents a conceptually attractive point for modulation of the elongation cycle by regulatory translation factors, but, until now, no such regulatory factor has been demonstrated to act via this mechanism.
Deep understanding of the mechanism by which EF-G drives translocation has been achieved by combining insight from three types of studies. First, elegant biochemical studies have demonstrated that the binding and hydrolysis of GTP by EF-G drives efficient directional translocation on the ribosome16. Second, cryo-EM5,6 and X-ray crystal structures17 of EF-G complexes with the ribosome have elucidated the structural basis for this activity, which involves stabilization of the ribosomal PRE complex in the MS-II conformation by GTP-bound EF-G. Finally, smFRET studies have characterized the dynamics of the translocation process, revealing that the ribosome undergoes spontaneous fluctuations between the MS-I and MS-II states prior to EF-G binding8–11.
The essential eukaryotic and archaeal translation factor ABCE1 (or RLI1) provides another example of the power of synergistic structural and functional studies18–21. This protein belongs to the ABC-E family, which represents a different phylogenetic lineage from the ABC-F family within the ATP-binding cassette (ABC) protein superfamily. Cryo-EM studies have shown that ABCE1 (or RLI1) binds near the A site on the ribosome, at the interface between the small and large ribosomal subunits21, consistent with its previously demonstrated biochemical activity dissociating the small and large ribosomal subunits to recycle them from post-termination complexes or stalled ribosomes18,19. Combined with X-ray crystal structures of ABCE122 and model ABC transporter domains, the cryo-EM structures of ribosome-bound ABCE1 have led to an atomic-resolution model for the mechanism of ABCE1-catalyzed ribosome recycling21. ATP binding at the interface between the two ATPase domains in ABCE1 is proposed to drive a mutual rotation of these domains that mechanically pries apart the small and large ribosomal subunits20,21. However, interpretation of ribosome structures with some other translation factors has been impeded by uncertainty as to their exact physiological and biochemical activities, as discussed in the Supplementary Notes.
Boel et al. demonstrate that a protein that they renamed EttA (Energy-dependent Translational Throttle A, formerly known as YjjK) gates the entry of 70S ribosomal initiation complex (70S IC) into the translational elongation cycle via a different interaction in the presence of ATP vs. ADP4. EttA is one of four E. coli paralogs belonging to the ABC-F protein family. This phylogenetically distinct lineage within the ABC protein superfamily has multiple representatives in the vast majority of eubacterial genomes and all eukaryotic genomes, but very limited prior functional characterization. In this study, we set out to characterize the molecular mechanism of EttA. We used cryo-EM and smFRET to characterize the interaction, with ribosomes, of an EttA variant (EttA-EQ2) that is locked in the ATP-bound conformation by mutations in the catalytic bases located in its dual ATPase active sites. Our results demonstrate that ATP-bound EttA-EQ2 binds to the ribosomal E site, and kinetically traps the ribosomal PRE complex in the MS-I state. Therefore, EttA regulates translation by modulating the ribosome and tRNA dynamics required for polypeptide elongation. These studies, which provide the first information on the molecular mechanism of any ABC-F family member, highlight the technical and conceptual advantages of close coordination of functional biochemical experimentation with structural and biophysical studies. This close coordination has provided insight into a sophisticated translational regulatory process at a level of detail and confidence seldom achieved in the past.
RESULTS
The ATP-bound form of EttA binds tightly to the ribosome
We began our structural characterization using the ATPase-deficient mutant of EttA (EttA-EQ2), which traps the protein in the ATP-bound conformation based on extensive evidence summarized in Boel et al.4. Using in vivo Ni2+-nitrilotriacetic acid (NTA) pull-down experiments (Supplementary Fig. 1), we isolated EttA-EQ2-bound 70S ribosomes at an estimated EttA-EQ2:70S ribosome molar ratio of ~1:1 from an E. coli strain overexpressing amino-terminal hexahistidine-tagged EttA-EQ2 (His6-EttA-EQ2). In contrast, 70S ribosomes were not detected in control pull-down experiments using wild-type His6-EttA or untagged EttA (Supplementary Fig. 1). These results immediately suggested that the interaction of EttA-EQ2 with 70S ribosome is sufficiently specific and stable for structural characterization of the EttA-EQ2-bound ribosomal complexes.
Preparation of EttA-EQ2-bound ribosomal PRE complex
We therefore employed cryo-EM23 and single-particle reconstruction methods24 to investigate the structure of EttA-EQ2-bound ribosomal complexes. We used a purified in vitro translation system25 to assemble 70S IC containing N-formylmethionine (fMet) bound tRNAfMet on a model mRNA encoding initiator Met-Phe-Lys residues4 (Supplementary Notes). EttA-EQ2 together with ATP, and Phe-tRNAPhe•EF-Tu•GTP were added sequentially to this 70S IC to produce 70S PRE complex. Translational activity assays were performed in parallel with cryo-EM sample preparation using radiolabeled [35S]fMet-tRNAfMet to enable analysis of the peptide products using electrophoretic thin-layer chromatography (eTLC) assays. These assays included EF-G•GTP and Lys-tRNALys•EF-Tu•GTP to promote translocation and to enable tripeptide synthesis (although these components were omitted from the reactions used to prepare samples for cryo-EM analysis). The translational activity assays yielded ~60% [35S]fMet-Phe dipeptide but only ~10% [35S]fMet-Phe-Lys tripeptide (Supplementary Fig. 2), confirming the translation activity of the ribosomes and also its inhibition by EttA-EQ2 (as characterized in Boel et al.4).
Cryo-EM reconstruction of the EttA-EQ2-bound PRE complex
After single-particle reconstruction and classification (Online Methods, Supplementary Notes and Supplementary Fig. 3), we obtained a major class comprising 70S ribosomal complexes (“Class I”, 36%of the total dataset, 7.5 Å resolution; Supplementary Fig. 3b) containing masses of density at the A and P sites that are attributable to A- and P-site tRNAs, as well as an additional mass at the E site that is too large to be attributable to a bound tRNA (Fig. 1). Based on its size and shape (Fig. 1d, 1e), we assigned this density to monomeric EttA-EQ2. This assignment was confirmed by a standard E-site binding assay26, which demonstrated that a saturating amount of EttA-EQ2 almost completely inhibits the binding of deacylated tRNA to the ribosomal E site (Fig. 2). Based on the aforementioned translational activity assays (Supplementary Fig. 2), the ribosome particles in Class I represent translation-active ribosomal PRE complex stalled by EttA-EQ2, which should contain deacylated tRNAfMet at the P site and fMet-Phe-tRNAPhe at the A site. Thus, we assigned the reconstruction from Class I to the EttA-EQ2-bound PRE complex.
Figure 1.

Cryo-EM 3D reconstruction of EttA-EQ2-bound PRE complex. Overview of the segmented cryo-EM map of EttA-EQ2-bound PRE complex reconstructed from Class I. (a) Back view showing the tRNA exit site; (b) front view showing the tRNA entry site; (c) top view; (d) intersubunit interface view from the 50S side, with 50S subunit computationally removed; (e) intersubunit interface view from the 30S side, with 30S subunit computationally removed. A-tRNA and P-tRNA, short for A-site tRNA and P-site tRNA, respectively. Abbreviations of landmarks: hd, 30S subunit head; bk, 30S subunit beak; sp, 30S subunit spur; h17, helix 17 of 16S rRNA; cp, central protuberance of 50S subunit; st, stalk; H68, H69, Helix 68 and 69 of 23S rRNA, respectively; ABC, ATP-binding cassette domain; PtIM, short for P-site tRNA interaction motif, also called inter-ABC-domain linker of EttA; arm, the arm of EttA, an α-helical ABC1 domain of EttA.
Figure 2.

Ribosome E-site binding assay. Filter-binding assay evaluating the influence of increasing concentration of EttA-EQ2 on the interaction of deacylated [32P]tRNAPhe (0.4 µM) with the E site on 70S ribosomes (0.2 µM) after a 2 minute incubation at 4 °C in 20 mM Tris-HCl (pH 7.4), 100 mM NH4Cl, 10 mM Mg(OAc)2, 0.1 mM Mg-ATP. The graph shows the fraction of ribosomes retaining an E-site tRNA after 3 washes on a nitrocellulose filter with 20 mM Tris-HCl (pH7.4), 100 mM NH4Cl, 20 mM Mg(OAc)2, 1mM EDTA.
The structure of the EttA-EQ2-bound ribosome derived from the Class I density map is similar to a PRE complex in MS-I6,12,27 (Fig. 3). On the other hand, previous cryo-EM studies on PRE complexes captured two classes of 70S ribosomes that were in MS-I and MS-II conformations, respectively, under similar polyamine-containing, low Mg2+-concentration buffer conditions and in the absence of translation factors28. Therefore, our cryo-EM observation that the EttA-EQ2-bound PRE complexes homogenously exhibit only the MS-I conformation suggests that EttA-EQ2 stabilizes 70S ribosome in the MS-I state and prevents the ribosome from advancing to the state required for translocation, an inference validated by smFRET experiments presented below.
Figure 3.

Characterization of the global conformation of EttA-EQ2-bound ribosome. (a, b) Superimposition of the cryo-EM map of the EttA-EQ2-bound PRE complex determined here on that of the 70S•tRNAfMet•MF-tRNAPhe PRE complex in MS-I6,27 (a) or that of the 70S•MFTI-tRNAIle•EF-G•GDPNP complex with puromycin in MS-II6 (b), as viewed from the solvent side of the 30S subunit. (c, d, e) Comparison of EttA’s binding site on 70S ribosome (c) with those of E-site tRNA (d) and EF-P (e), as viewed from the 30S subunit side of the intersubunit interface. The 30S subunit and A-site tRNA are not shown, to provide clear visualization of the factors and P-site tRNAs. The labels used here are defined in the legend for Fig. 1. (e) A map calculated from the X-ray crystal structure of the T. thermophilus 70S ribosome complex with elongation factor EF-P50, displayed in the same manner and orientation as the cryo-EM structures of the E. coli ribosomal complexes in (c, d). (f) Comparison of the positions of the L1 stalk in the 70S•EttA-EQ2 and 70S PRE complex, showing superposition of the cryo-EM maps in the boxed regions in (c) and (d). The maps are colored the same as in (a).
Fitting the structure of the EttA-EQ2-bound PRE complex
To gain more insights into the detailed interactions between EttA-EQ2 and the bound ribosomal complex, we fitted the atomic structure of the EttA-EQ2-bound PRE complex into the Class I density map using molecular dynamics flexible fitting (MDFF)29. We first built a structural model of monomeric EttA in the ATP-bound conformation using the crystal structure of nucleotide-free EttA24. The two ABC domains in EttA (ABC1 and ABC2) were superimposed onto those in the crystal structure of a homologous ABC domain that crystallizes in the form of an ATP-bound homodimer (PDB ID: 2PZE30). Alignment was performed separately in the F1-like ATP-binding core and the α-helical subdomain of each of the two ABC domains in EttA, in order to account for the subdomain rotation that occurs upon ATP binding to ABC domains4,31 (Online Methods and Fig. 4). After rigid-body fitting of the resulting ATP-bound EttA model into the isolated cryo-EM density corresponding to EttA-EQ2, we were able to unambiguously assign the two protrusions in the density to unique structural features in EttA relative to other ABC proteins4. One of these, the arm (residues 95–139), is an α-helical hairpin extending from the surface of the α-helical subdomain in ABC1, while the other, the inter-ABC-domain linker (residues 242–322, named the PtIM below), contains a long α-helical extension at the C-terminus of ABC1 (Fig. 4). The fact that the similarity of the cryo-EM map is substantially higher to the modeled ATP-bound conformation of EttA than to the conformation observed in its nucleotide-free crystal structure, measured by cross-correlation coefficient, strongly supports the inference that EttA-EQ2 binds to the ribosome in the standard ATP-bound conformation observed for other ABC domains (Online Methods).
Figure 4.

Modeling of ATP-bound EttA monomeric structure and comparison with EttA cryo-EM density map. (a, b, c) Modeling of ATP-bound EttA monomeric structure. (a) The crystallographic structure of EttA2 (PDB ID: 4FIN4) was cut in half at the inter-ABC-domain linker region (between residues 277 and 278) to generate a monomeric apo-EttA structure model. (b) Each of the subdomains of the apo-EttA model was aligned to the head-to-tail homodimer structure of ATP-bound CFTR NBD1 (PDB ID: 2PZE30), then the missing links were complemented by Phyre2 search hits, yielding a monomeric ATP-bound EttA model shown in (c). Blue, mechanical coupling subdomain; tan, ATP binding core; lighter and darker colors indicate ABC1 and ABC2, respectively. Purple, inter-ABC-domain linker, named PtIM in this paper; Grey, the other half of EttA2 crystallographic structure; green, Mg-ATP. (d, e, f) Comparison of apo-EttA model (d) and ATP-bound EttA model (f) with isolated EttA-EQ2 cryo-EM map (e). In (d) and (f) the cryo-EM map of EttA-EQ2 was rendered transparent.
After positioning the ATP-bound model of EttA into the Class I density map, we used MDFF to fit into that map the composite atomic structure of the complex containing the 70S ribosome, A-site and P-site tRNAs, and EttA (Supplementary Fig. 4 and Online Methods). In the resulting structure (Fig. 5), the ABC1 and ABC2 domains of EttA lie close to the 50S and 30S subunits, respectively. ABC1 contacts helices 68 and 77 of 23S ribosomal RNA (rRNA), as well as ribosomal proteins L1 and L33 on the 50S subunit. ABC2 contacts helices 41–42 of 16S rRNA, as well as ribosomal proteins L5 and L33 on the 50S subunit and ribosomal protein S7 on the 30S subunit (Fig. 5b, 5d and Supplementary Table 1). The N-terminus of EttA is solvent-exposed, consistent with the ability to pull down EttA-EQ2-bound ribosomes via an N-terminal His6 tag on EttA (Supplementary Fig. 1). Notably, the regions of the ABC domains flanking the two nucleotide-binding sites in EttA are also solvent-accessible, suggesting that EttA should be able to undergo nucleotide exchange while bound to the 70S ribosomal complex.
Figure 5.

MDFF-fitted EttA-EQ2-bound PRE complex structure. (a) Top view; (b) close-up of the boxed region in (a). (c, d, e) Stepwise close-up of the boxed region in the previous panel viewing from the 50S side of the intersubunit interface. Color scheme is the same as Fig. 1. Blue and orange ribbons, ribosomal proteins of 50S and 30S subunit, respectively. Cryo-EM map is rendered as mesh contour. The starred region in (d) indicates the protrusion formed by the CpU bulge of P-site tRNAfMet. Residues involved in possible interactions between EttA and P-site tRNAfMet or 23S rRNA are represented as sticks in (e).
The arm region of EttA interacts extensively with the L1 stalk of the 50S ribosomal subunit, burying ~1400 Å2 of surface area on EttA that would otherwise be solvent-accessible (Fig. 3e and Supplementary Table 1). This structural interaction is likely to contribute to the tight binding that is observed between EttA-EQ2 and the PRE complex, and to the putative stabilization of the PRE complex in the MS-I conformation. These inferences are supported by the observation that E. coli strains expressing an EttA-EQ2 variant lacking the arm (EttA-Δarm-EQ2) do not exhibit the strong trans-dominant toxicity phenotype observed in E. coli strains expressing full-length EttA-EQ24. The conformation of the L1 stalk observed in the EttA-EQ2-bound ribosome is more open than that previously observed in the MS-I conformation of PRE complexes containing an E-site tRNA6,27 (Fig. 3f). In comparing these structures, the L1 stalk pivots ~14° around the hinge region at the base of helix 76 in 23S rRNA, as viewed from the 30S subunit. Moreover, the L1 stalk conformation observed in the EttA-EQ2-bound PRE complex is similar to the most open L1 stalk conformation that has been observed in the MS-I conformation of PRE complexes lacking an E-site tRNA (Class 2 in ref. 32).
EttA-EQ2 contacts identity elements on the P-site tRNAfMet
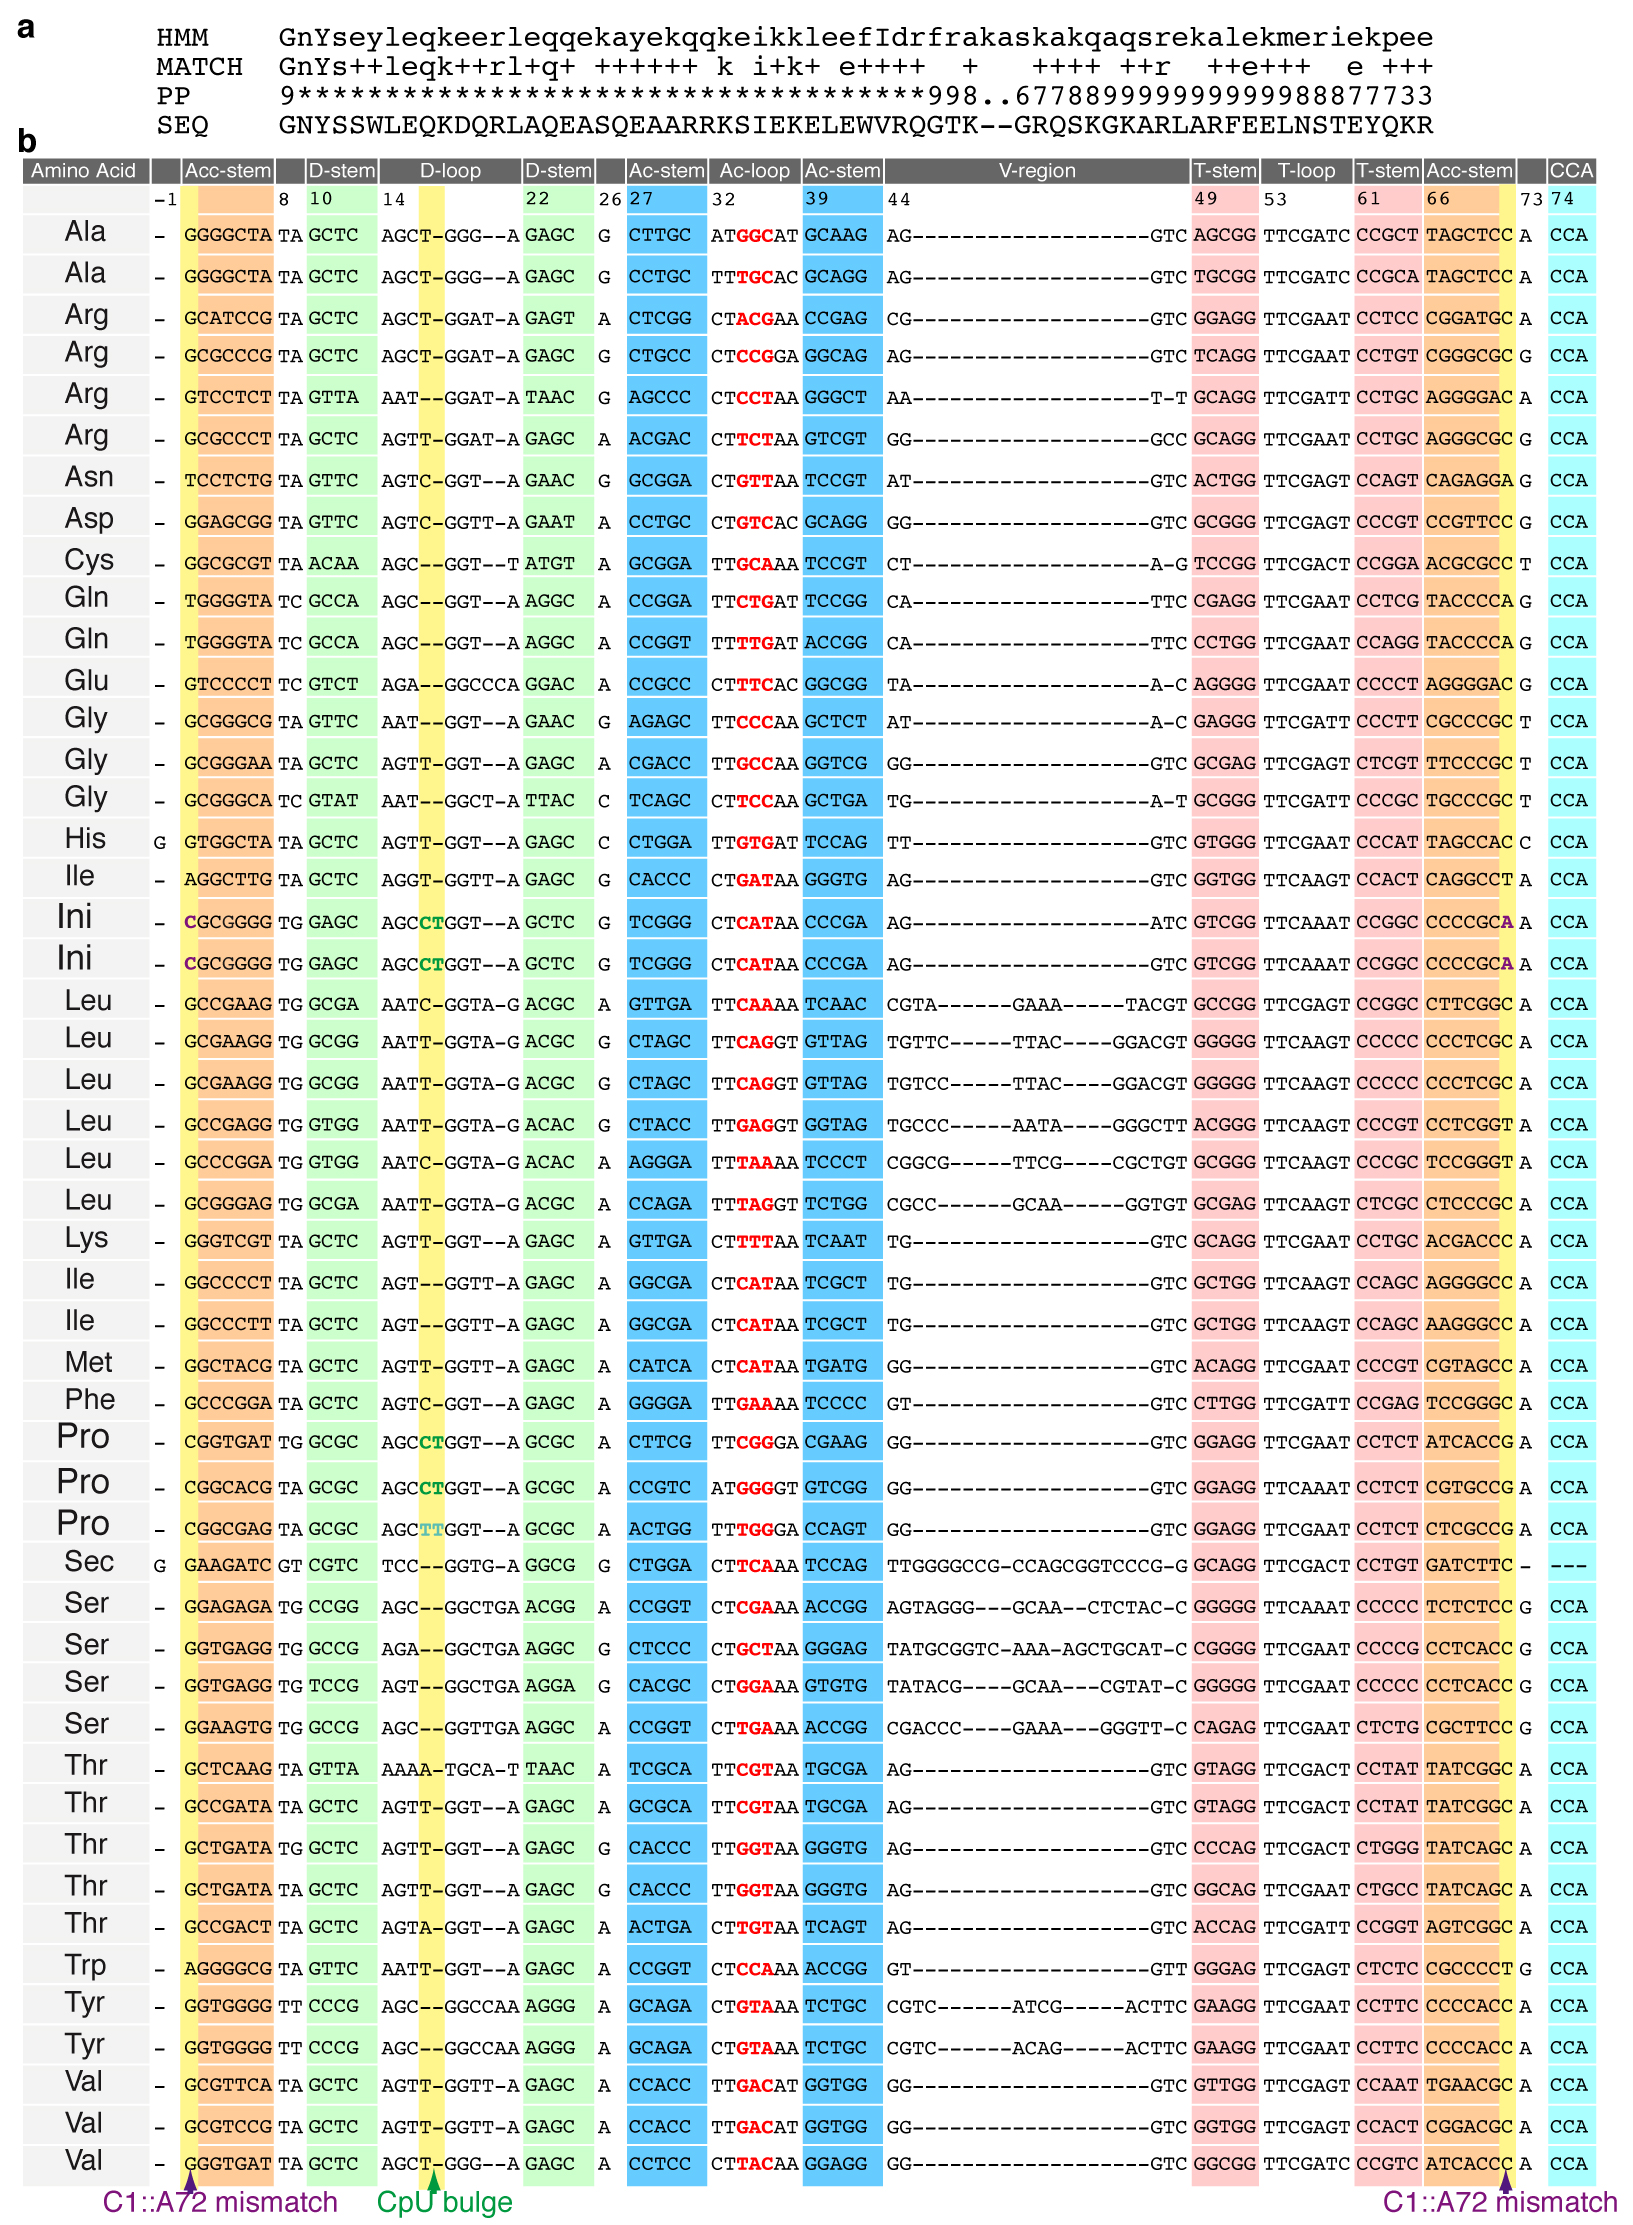
EttA-EQ2 bound to the PRE complex has direct access to structural elements in the P-site tRNA that distinguish initiator tRNAfMet from most elongator tRNAs, namely the C1::A72 mismatch (based on tRNA numbering following ref. 33) and the so-called C17pU17a bulge or “CpU bulge” (see below). The cryo-EM density map (Fig. 1d) shows that the side of EttA-EQ2 facing the P site exhibits a shape that is complementary to the P-site tRNA. The atomic model produced by MDFF fitting of this density map shows direct contact between the inter-ABC-domain linker of EttA-EQ2 and the aminoacyl acceptor stem of the P-site tRNA. Notably, the PFAM database34 identifies the first 70 of the 80 residues in the inter-ABC-domain linker (residues 242–312) as a conserved domain in its own right, which is called PF12484. On this basis, we have designated the inter-ABC-domain linker of EttA as the P-site tRNA interaction motif, or PtIM (Supplementary Fig. 5a). Some of the conserved residues in the PtIM interact directly with helices 68, 69 and 74 in 23S rRNA as well as with the P-site tRNAfMet (Supplementary Table 1), which seem likely to stabilize the observed conformation of the PtIM. Analysis of the Class III cryo-EM map, obtained from ribosome particle classification, support this hypothesis. Class III map contains density for EttA but not for tRNA molecules in either the P or A site on the ribosome (Supplementary Fig. 6 and Supplementary Notes). In these tRNA-free particles, the EttA density is substantially weaker in the region of the PtIM connected to ABC2 compared to the density in the same region of EttA in Class I map, which has tRNA molecules bound in both the A and the P site (compare Fig. 1 to Supplementary Fig. 6). These observations suggest that PtIM makes functionally important, stabilizing interactions with the P-site tRNA, in the absence of which the PtIM fails to adopt a well-defined conformation when EttA is bound to ribosomes.
The C1::A72 mismatch at the end of the aminoacyl acceptor stem is a structural feature that distinguishes initiator tRNAfMet from most elongator tRNAs35 (Supplementary Fig. 5b). In the MDFF-fitted structure of the EttA-EQ2-bound PRE complex, the aminoacyl acceptor stem of tRNAfMet interacts with several positively charged residues at the distal end of the PtIM (residues 275–286), including R277 and K281 (Fig. 5e and Supplementary Table 1). Another distinguishing feature of tRNAfMet is the CpU bulge within the dihydrouridine loop (D-loop)33, which comprises bases C17 and U17a (where ‘17a’ refers to an additional nucleotide between 17 and 18). This feature is present in both of two isoforms of initiator tRNAfMet as well as two of three isoforms of tRNAPro in E. coli, but absent from all other elongator tRNAs (Supplementary Fig. 5b). The two bases of the CpU bulge are flipped out of the elbow region of the tRNA in crystal structures of E. coli tRNAfMet either alone36 or bound at the P site of the T. thermophilus 70S ribosome37. In the Class I density map, this bulge is prominent in the P-site tRNA but missing in the A-site tRNA (Figs. 1d and 5d), consistent with the assignment of tRNAfMet at the P site and tRNAPhe at the A site. Several residues in EttA-EQ2, including residues 299–302 in PtIM and a region on the surface of ABC2, may interact with the CpU bulge of tRNAfMet (Supplementary Table 1). Taken together, the interactions of EttA-EQ2 with the aminoacyl acceptor stem and the CpU bulge of tRNAfMet suggest that EttA is capable of interacting more strongly with ribosomes bearing tRNAfMet rather than elongator tRNAs in the P site, consistent with biochemical assays presented in Boel et al. showing that EttA interacts preferentially with the 70S IC compared to ribosomes that have entered the elongation cycle4.
EttA-EQ2 binding restricts ribosome and tRNA dynamics
To explore the mechanism through which EttA’s interactions with the 70S ribosome and the P-site tRNA regulate protein synthesis, we turned to smFRET experiments (Fig. 6). These experiments have been used extensively to characterize how translation factors modulate the dynamics of 70S ribosomal complexes as part of the mechanisms through which they regulate translation8,10,11,38,39. Initial experiments were conducted using a previously developed smFRET signal between the L1 stalk and a deacylated P-site tRNAPhe (smFRETL1-tRNA)11 in a ribosomal PRE complex analog with an empty A site (PRE-APhe). Control smFRETL1-tRNA experiments recorded in the absence of EttA-EQ2 exhibited fluctuations between FRET states centered at a FRET efficiency (EFRET) = 0.15, associated with MS-I, and EFRET = 0.74, associated with MS-II (Supplementary Fig. 7, Supplementary Table 2, Online Methods). In contrast, smFRETL1-tRNA experiments recorded in the presence of 1.8 µM EttA-EQ2 and 2 mM ATP showed a dramatic shift in the MS-I⍰ MS-II equilibrium of the PRE-APhe complex to a FRET state centered at EFRET = 0.15, consistent with stabilization of the ribosome in MS-I by EttA-EQ2 in the presence of ATP.
Figure 6.

EttA-mediated regulation of the open L1 stalk ↔ closed L1 stalk equilibrium of a PRE-AfMet complex as observed using smFRETL1-L9. (a) Cartoon diagram of the conformational equilibrium of the PRE-AfMet complex between the MS-I conformation harboring an open L1 stalk (ribosomal complex on left) and the MS-II conformation harboring a closed L1 stalk (ribosomal complex on right). 30S subunit, tan cartoon; 50S subunit, blue cartoon; tRNAfMet, green ribbon,; mRNA, black curve; Cy3 FRET donor fluorophore, green circle; and Cy5 FRET acceptor fluorophore, red circle. (b, c, d) smFRETL1-L9 experiments recorded in the presence of 2 mM ATP and in (b) the absence of EttA, (c) the presence of 6 µM EttA, or (d) the presence of 6 µM EttA-EQ2. 1st row: Representative Cy3 and Cy5 fluorescence intensity (Fluor. int.) vs. time trajectories. The fluorescence intensities are plotted in arbitrary units (a.u.) with the Cy3 fluorescence intensity plotted in green and the Cy5 fluorescence intensity plotted in red. 2nd row: The corresponding EFRET vs. time trajectories. The EFRET at each time point was calculated using EFRET = ICy5 / (ICy3 + ICy5), where ICy3 and ICy5 are emission intensities of Cy3 and Cy5, respectively, and is plotted in blue. 3rd row: Surface contour plots of the time evolution of the population FRET. The contour plots were generated by superimposing individual EFRET vs. time trajectories, and colored from white (lowest-populated) to red (highest-populated). n denotes the number of EFRET vs. time trajectories used to construct each contour plot.
To more sensitively and directly investigate the conformational dynamics of the L1 stalk, we next employed a previously described smFRET signal between the apical tip and the base of the L1 stalk (smFRETL1-L9)10 in a PRE-A complex harboring a deacylated P-site tRNAfMet and an empty A site (PRE-AfMet) (Fig. 6, Supplementary Table 2, Online Methods). Control experiments recorded in the absence of EttA or EttA-EQ2 exhibited fluctuations between FRET states centered at EFRET = 0.56, associated with the open L1 stalk in MS-I, and EFRET = 0.35, associated with the closed L1 stalk in MS-II. In contrast, smFRETL1-L9 experiments recorded in the presence of 6 µM EttA (i.e., the wild-type protein) and 2 mM ATP showed exclusive population of the FRET state centered at EFRET = 0.56, demonstrating that EttA shifts the conformational equilibrium of the ribosome towards the MS-I state with an open conformation of the L1 stalk. Experiments recorded in the presence of 6 µM EttA-EQ2 and 2 mM ATP demonstrated an even stronger effect, shifting the open L1 stalk ↔ closed L1 stalk equilibrium towards a FRET state centered at EFRET = 0.62 that is even higher than the EFRET observed for the open L1 stalk in MS-I. This result suggests that EttA-EQ2 stabilizes a conformation of the L1 stalk in which the mean separation between the labeling positions on ribosomal proteins L1 and L9 is slightly shorter than what is observed for the open L1 stalk in MS-I, consistent with the results from our cryo-EM studies.
DISCUSSION
Based on the work reported here and in Boel et al.4, we propose a model for the regulation of translation by EttA at the start of the elongation cycle (Fig. 7). ATP-bound EttA docks initially to the E site of a 70S IC. Upon accommodation of an aminoacylated tRNA in the A site of this complex, the ATP-bound form of EttA stimulates peptide-bond formation4 by modulating the conformation of the PTC on the ribosome, resulting in formation of a 70S PRE complex, which is stabilized in the MS-I state by EttA. Modulation of the conformation of the PTC is mediated by the interactions of EttA with ribosomal proteins, rRNA, and the acceptor stem of the P-site tRNA, which is proximal to the PTC. The ATPase activity assays presented in Boel et al.4 suggest that these EttA-ribosome interactions reciprocally stimulate ATP hydrolysis by EttA. ATP hydrolysis by EttA is hypothesized to drive its two ABC domains apart40 into a conformation that is no longer compatible with ribosome binding, thereby triggering release of EttA. After EttA’s dissociation, the PRE complex regains the capability to undergo MS-I↔ MS-II transitions, thereby permitting EF-G binding and translocation to occur and completing the process by which EttA gates entry of the 70S IC into the translational elongation cycle. In contrast, the ATPase-deficient EttA-EQ2 mutant protein, which is trapped in the ATP-bound conformation, remains bound to the PRE complex and keeps it stalled in MS-I.
Figure 7.

Schematic model of the influence of EttA, in the presence of ATP, on the early steps in protein synthesis on the ribosome. For simplicity, not all intermediate steps in translation are shown; see text for more details. Tan, 30S; navy, 50S; orange, EF-Tu. Abbreviations: 70S IC, 70S ribosomal initiation complex; TC, aminoacyl-tRNA•EF-Tu•GTP ternary complex. Three yellow dots in tandem represent the heading peptide excluding the two most recently added amino acids (red circles). Blue arrow indicates the propensity of PRE complexes for spontaneous ratchet-like intersubunit rotation. Red stop sign symbolizes the inhibition of the MS-I↔MS-II dynamics by the binding of the ATP-bound form of EttA to the ribosomal E site. EttA-mediated translation regulation in the presence of ADP, described in the companion paper by Boel et al4, is not represented in this schematic.
The cryo-EM structure shows that the arm and the toe of EttA -- structural elements found in EttA and other ABC-F proteins, but not other ABC superfamily proteins -- both contact structural elements of the large ribosomal subunit within the 70S PRE complex (Fig. 5b, 5d and Supplementary Table 1). Specifically, the arm of EttA makes extensive contacts with the L1 stalk of the large ribosomal subunit, while the toe of EttA contacts the ribosomal protein L5. The functional importance of the observed interaction of EttA’s arm with the L1 stalk of the ribosome is supported by genetic complementation experiments presented in Boel et al.4. The cryo-EM structure reported here verifies the inference in Boel et al.4, based on the crystal structure of EttA, that these structural elements unique to ABC-F proteins mediate contact with some functional interaction partner. The crystal structure of EttA reported in Boel et al.4 shows that these structural elements are inserted at the sites at which ABC domains contact the transmembrane domains in ABC transporters41–43. Notably, a chromodomain inserted in the equivalent loop in the second ABC domain of eEF3 mediates interaction with a different region of the ribosome44.
Based on the peripheral, solvent-exposed location of the ATP-binding sites in EttA in the ribosome-bound structure reported here, nucleotide exchange on EttA should be able to occur while EttA remains bound to the ribosome. The monomer structure fit to the cryo-EM map shows closure of the interface between ABC1 and ABC2 compared to the nucleotide-free crystal structure of EttA4, yielding a conformation in which the two ABC domains interact in a geometry equivalent to that observed in a wide variety of other ATP-bound ABC proteins (including that in the crystal structure of the E-to-Q mutant of MJ0796)40,43,45,46. This structural observation supports the inference made in Boel et al.4, based on results obtained with a wide variety of ABC proteins, that the EQ2 mutations trap EttA in an ATP-bound conformation.
Specific structural interactions between EttA and the P-site tRNA visualized in the cryo-EM structure reported in this paper could contribute to the specificity of EttA for the 70S IC, compared to elongating ribosomes4. The PtIM and ABC2 domains of EttA interact with two distinguishing structural features of initiator tRNAfMet, the C1::A72 mismatch and the CpU bulge, the first of which does not occur in any other tRNA and the second of which only occurs in some isoforms of tRNAPro. Notably, there are several parallels between the mechanism proposed here for EttA and that previously proposed for the elongation factor EF-P47. Both EF-P47 and EttA4 have been proposed to modulate the conformation of the PTC to control the peptidyl-transferase activity of the ribosome when a tRNA containing the CpU bulge is bound in the P site, as discussed in the Supplementary Notes.
Boel et al. also present evidence that, in the presence of ADP, EttA stabilizes the 70S IC in a hibernating state that prevents synthesis of the first peptide bond on the ribosome4. The cryo-EM structure reported here helps guide development of an integrated model for this activity and the functional interaction of EttA with 70S IC. The global conformation of the ribosome in the hibernating state stabilized by EttA in the presence of ADP is likely to be similar to that of the EttA-EQ2-bound PRE complex in the presence of ATP reported in this paper, but it must have important local conformational differences in the vicinity of the PTC to inhibit, rather than promote, peptide-bond formation. The lifetime of this hibernating state is likely to be longer than the lifetime of the state stabilized by EttA in the presence of ATP, because in the latter state, ATP hydrolysis by EttA presumably promotes a conformational change of EttA accelerating its release from the ribosome. In the absence of this driving force produced by ATP hydrolysis, EttA in the presence of ADP presumably remains bound to the ribosome longer. Our cryo-EM structure suggests that nucleotide-exchange could take place on EttA while it remains bound to the ribosome. Upon binding ATP, ribosome-bound EttA should drive peptide-bond formation. EttA is then rapidly released from the ribosome upon ATP hydrolysis (Fig. 7), which induces escape of the ribosome from the hibernating state stabilized by EttA in the presence of ADP. In contrast, under conditions of energy depletion, which results in an elevated concentration of ADP compared to ATP48,49, competition of ADP with ATP for interaction with the ATPase active sites in ribosome-bound EttA could perpetuate the hibernating state and prevent the ribosome from entering the translation elongation cycle. This model for the mechanism of nucleotide-exchange and ATP hydrolysis by ribosome-bound EttA, while consistent with the biochemical results presented by Boel et al.4 and the cryo-EM structure presented here, must be critically evaluated in future research on this system.
In conclusion, the research reported in this paper demonstrates that the ATP-bound form of EttA interacts with the E site of the 70S ribosome in the MS-I state and modulates the MS-I to MS-II transition of the translating ribosome. This molecular mechanism employed by EttA is novel among all the known translational regulatory factors. Future work is needed to validate EttA’s specificity for ribosomes with an initiator tRNAfMet in the P site and to provide more details on the mechanism of ATP hydrolysis on the ribosome-bound EttA. The methods used to characterize EttA in this paper and Boel et al.4 provide a paradigm to evaluate whether translation is modulated in a related manner by other established and putative translation factors, including the many uncharacterized proteins in the ABC-F protein family (e.g., Uup, YbiT, and YheS in E. coli).
ONLINE METHODS
Pull-down of 70S ribosome with His6-EttA-EQ2
These methods are described in the Supplementary Notes.
smFRET experiments on PRE-AfMet and PRE-APhe complexes
smFRET experiments were performed using a laboratory-built total internal reflection fluorescence (TIRF) microscope as previously described10,11,51 in a Tris-Polymix Buffer containing 50 mM Tris acetate (pH 7.0 at 25 °C), 100 mM KCl, 5 mM NH4OAc, 15 mM Mg(OAc)2, 0.5 mM Ca(OAc)2, 0.1 mM EDTA, 10 mM 2-mercaptoethanol, 5 mM putrescine dihydrochloride and 1 mM spermidine free base that was supplemented with an oxygen-scavenging system (2.5mM 3,4-dihydroxybenzoic acid (PCA), 25nM protocatechuate 3,4-dioxygenase (PCD), and 1% (w/v) β-D-glucose).
The PRE-APhe complex used for the smFRETL1-tRNA experiments was prepared using a ribosome labeled with a Cy5 FRET acceptor fluorophore at ribosomal protein L1 and a P-site tRNAPhe labeled with a Cy3 FRET donor fluorophore at the central-fold domain as previously described (Ref. 11, where it was designated as the PRE-2 complex). We note that tRNAPhe, rather than tRNAfMet, was used for these experiments because the labeling position within the central-fold domain of tRNAPhe provides an smFRETL1-tRNA signal that has greater dynamic range, and therefore greater sensitivity, than the smFRETL1-tRNA signal corresponding to the labeling position in the central-fold domain of tRNAfMet 10.
The PRE-AfMet complex used for the smFRETL1-L9 experiments was prepared using ribosomes labeled with a Cy5 FRET acceptor fluorophore at ribosomal protein L1 within the apical tip of the L1 stalk and with a Cy3 FRET donor fluorophore at ribosomal protein L9 protein within the base of the L1 stalk as previously described (Ref. 51, where it was designated as the PRE-AfMet1 complex).
smFRETL1-tRNA experiments were performed by preparing samples containing either: (i) 100 pM PRE-AfMet complex; (ii) 100 pM PRE-AfMet, complex, 1.8 µM wild type EttA, and 0.8mM Mg-ATP; or (iii) 100 pM PRE-AfMet, 1.8 µM ATPase-deficient mutant EttA-EQ2, and 0.8 mM Mg-ATP in Tris-Polymix Buffer, incubating each sample for 2 min at 25°C, loading each sample into an imaging flow cell, and imaging each flow cell as previously described11. smFRETL1-l9 experiments were performed by preparing samples containing either: (i) 100 pM PRE-AfMet complex; (ii) 100 pM PRE-AfMet, complex, 6 µM wild type EttA, and 2mM Mg-ATP; or (iii) 100 pM PRE-AfMet, 6 µM ATPase-deficient mutant EttA-EQ2, and 2 mM Mg-ATP in Tris-Polymix Buffer, incubating each sample for 2 min at 25°C, loading each sample into an imaging flow cell, and imaging each flow cell as previously described51.
The fractional populations of MS-I and MS-II, equilibrium constants governing the MS-I⍰MS-II equilibrium, and the transition rates between MS-I and MS-II reported for the PRE-AfMet and PRE-APhe complexes in Supplementary Table 2 were calculated following previously described protocols10,11,51.
Cryo-EM sample preparation and peptide formation assay
The pT7gp32 mRNA, containing the first four codons AUG-UUU-AAA-GAA (Met-Phe-Lys-Glu), was produced as describe by Fei et al.25. The pT7gp32.1-20 plasmid was used as a template for the mRNA. This plasmid is derivate from the pT7gp32.1-224 plasmid and has a stop codon after residue 20.
Peptide formation assay
All the components and proteins for the in vitro translation were prepared and purified exactly as described in the method of Fei et al.25. The [35S]fMet-tRNAfMet was prepared with the same protocol, but with the methionine replaced by 3 µM of [35S]Methionine (Perkin Elmer) and quenched 5 min after the beginning of the reaction with 16 µM of cold methionine. Estimation of aminoacylation to formylation yields was assessed by hydrophobic interaction chromatography25. The translation was done in polymix buffer with 3.5 mM Mg(OAc)2 (50 mM Tris acetate (pH 6.9), 100 mM KCl, 5 mM NH4OAc, 3.5 mM Mg(OAc)2, 0.5 mM Ca(OAc)2, 0.1 mM EDTA, 1 mM spermidine, 5 mM putrescine, 6 mM 2-mercaptoethanol) containing 0.5 mM Mg-ATP. Reactions were done all at 37°C except otherwise indicated with the following concentration: mRNA (1.7 µM), [35S]fMet-tRNAfMet (0.3 µM), 70S ribosome (0.45 µM), the initiation factors (IF1, IF2 and IF3, ~ 0.5 µM each), the corresponding aminoacyl-tRNA (0.7 µM) and the elongation factors (EF-Tu 2 µM, EF-Ts 1 µM, EF-G 1.5 µM). The 70S IC was assembled by incubating 70S ribosome with IF1, IF2, IF3, and GTP in polymix buffer with 3.5 mM Mg(OAc)2 for 10 min, then with the mRNA for 10 min, then with [35S]fMet-tRNAfMet for 10 min. After that the 70S IC was kept on ice for at least 10 min before being used for the elongation reactions. EF-G and ternary complexes (Phe-tRNAPhe •EF-Tu•GTP and Lys-tRNALys•EF-Tu•GTP) were prepared with the GTP regenerating buffer as described by Fei et al. 25. The reaction is assembled in sequential order: The 70S IC was first incubated for 1 min with either polymix buffer with 3.5 mM Mg(OAc)2 containing 0.5 mM Mg-ATP, or EttA-EQ2 (6 µM) with Mg-ATP (0.5 mM), then for 1 min with ternary complex, then for indicated reaction time with EF-G. After hydrolysis of the product with 0.2 M of KOH, reaction products were separated by electrophoretic thin layer chromatography (eTLC) described by Youngman et al.52, and quantified by phosphor imaging. Specifically, 0.5 µl of each sample was spotted onto TLC-cellulose (EMD Chemicals) plates, dried, and separated by electrophoresis in pyridine acetate buffer, pH 2.8 (20%glacial acetic acid and 0.06%pyridine) at 1200 V for 20 min.
Cryo-EM sample preparation
The cryo-EM sample was prepared the same way as the peptide formation assay, with minor modifications. 70S IC complex was assembled as described above but the [35S]fMet-tRNAfMet was replace by the same amount of fMet-tRNAfMet. The 70S IC complex was incubated with EttA-EQ2 (6 µM) at 37 °C for 1 min, then with Phe-tRNAPhe •EFTu•GTP ternary complex (0.67 µM) at 37 °C for 1 min. The mixture was then kept at room temperature (~ 25 °C) and diluted ten-fold using polymix buffer containing 3.5 mM Mg-ATP right before (within 1 min) preparing the cryo-EM grids, as described by Grassucci et al.23. Specifically, the diluted sample was applied on a hydrophilic Quantifoil (Jena, Germany) R2/4 300 mesh Cu EM grid, incubated for 30 sec at 4 °C and 100% relative humidity, then plunge-frozen in liquid ethane (~−183 °C) using VitrobotTM Mark IV (FEI, Hillsboro, Oregon).
Cryo-EM data collection, single-particle reconstruction and classification
Cryo-EM data collection
The cryo-EM data were collected, as previously described23, in low-dose mode on an FEI (Hillsboro, Oregon) Tecnai F20 TEM at 200kV extraction voltage and about 80,000× magnification using the automatic image collection program Leginon53. Micrographs were recorded on a Gatan UltraScan 4000 CCD camera binned by 2× with effective CCD magnification of 110,637× and pixel size of 2.71 Å on the object scale.
Single-particle reconstruction
For reference-based single-particle reconstruction using SPIDER24,54, a total of 2,390 CCD micrographs were selected, which have visible particles and round Thon rings. These micrographs were separated evenly into 40 defocus groups with total defocus range of −3.5 µm to −1.2 µm. Using as reference a cryo-EM map of the empty ribosome27, low-pass filtered to 15 Å resolution, 108,691 ribosome particles were chosen via automatic particle picking55 followed by visual verification. The 3D reconstruction from this total dataset was iteratively refined using SPIDER54 to 8.2 Å resolution (FSC = 0.5 criterion) and subjected to amplitude correction56. Cryo-EM map of the total dataset revealed a 70S ribosome containing densities at the A and P sites that were attributable to A- and P-site tRNAs, as well as additional density at the E site that was not attributable to an E-site tRNA (visually similar to Fig. 1).
Computational classification
The cryo-EM map of the total dataset revealed weaker densities for the A- and P-site tRNAs relative to 23S rRNA of the 50S subunit, indicating heterogeneity in the total dataset, i.e. ribosome particles being in different conformations and/or containing different components. Therefore we used the RELION57,58 program in a stepwise hierarchical classification (Supplementary Fig. 3a), using methods described in the Supplementary Notes).
Resolution measurement using gold-standard FSC59
For each data set, the RELION 3D auto-refine program was used to independently refine, from randomly split half datasets, the two unfiltered half-volumes, with resolution reported by the gold-standard criterion. To eliminate peripheral noise and re-calculate the resolution, we also used SPIDER commands to multiply these two unfiltered half-volumes with a soft Gaussian mask, having 0.5 fall-off at 3 pixels (8.1 Å) outside the ribosomal complex, and calculated the Fourier Shell Correlation (FSC) between the two masked half-volumes. The FSC versus spatial frequency curves were plotted (Supplementary Fig. 3b). The resolution of each map was then determined using the FSC = 0.143 criterion. The gold-standard resolutions, before (i.e., reported by RELION 3D auto-refine) / after applying the soft Gaussian mask, for each 70S ribosome class are: Class I, 8.5 Å/ 7.5 Å; Class II, 10.1 Å/ 9.1 Å; Class III, 8.7 Å/ 7.7 Å .
Molecular dynamics flexible fitting (MDFF) of EttA-bound 70S ribosome complex
Modeling of ATP-bound EttA monomeric structure (Fig. 4)
First, we generated a monomeric apo-EttA structure model by combining residues 1–277 of one protomer and residues 278–542 of the other protomer in the apo-EttA2 crystallographic structure4. Second, we matched this apo-EttA model to the ATP-bound head-to-tail homodimer crystallographic structure of cystic fibrosis transmembrane conductance regulator (CFTR) nucleotide binding domain 1 (NBD1) (PDB ID: 2PZE30), an ABC transporter homologous to EttA4, by separately aligning the core and the helical sub-domains, as previously described60, to account for the subdomain rotation in ABC domains31. Third, we complemented the secondary structures of missing links in the aligned EttA model with Protein Homology / analogY Recognition Engine (Phyre 2) server61 search hits. Specifically, the missing residues of EttA arm (residues 132–140), inter-ABC-domain linker helices (residues 243–279, which we call PtIM) and missing residues of C-terminal helix (residues 543–555) were modeled based on parts of PDB ID: 1UO0, 1ABZ and 2BBM, respectively. Cross-correlation coefficient (CCC) to the EttA-EQ2 isolated density map in Class I was calculated in UCSF Chimera62 using simulated maps from atomic structures filtered to 7 Å resolution. CCC value is 0.91 for ATP-bound EttA monomer model versus 0.83 for nucleotide-free EttA monomer model, indicating the ribosome-bound EttA-EQ2 is in the ATP-bound conformation.
MDFF of EttA-bound 70S ribosome complex
The initial system for MDFF29 was prepared using VMD63 and consisted of the E. coli 70S ribosome (PDB ID: 3R8O, 3R8T64), an mRNA coding for Met-Phe with 12 nucleotides of 5’untranslated region (a combination of PDB ID: 3R8O64 and 3FIH65), P-site tRNAfMet and A-site tRNAPhe (PDB ID: 2WDG37, with amino acids on tRNAs computationally removed), and ATP-bound monomeric EttA structure model.
Because of the different conformation of the L1 stalk in our reconstruction compared to the E. coli 70S X-ray structure in the initial system, a short in vacuo MDFF run was first performed on the initial system lacking EttA structure model, to bring the L1 stalk to the widely open conformation observed in our cryo-EM reconstruction. For this in vacuo run, the density map used was the Class I map with the EttA density computationally removed using SPIDER. This initial system lacking EttA was first rigid-body fitted into the Class I map using the FIT IN MAP module implemented in Chimera62. Starting from this initial fit, the intermolecular steric clashes were fixed by manually adjusting some of the side chains of proteins and nitrogenous bases of RNAs using PyMOL 66. The system was minimized for 1000 steps in NAMD67 followed by MDFF29, which applies a potential to the systems based on the cryo-EM density map. The run was stopped after 300ps, when the L1-stalk stabilized in the open conformation. We call the obtained model open-L1 70S, comprising E. coli 70S ribosome, A-site tRNAPhe, P-site tRNAfMet and an mRNA.
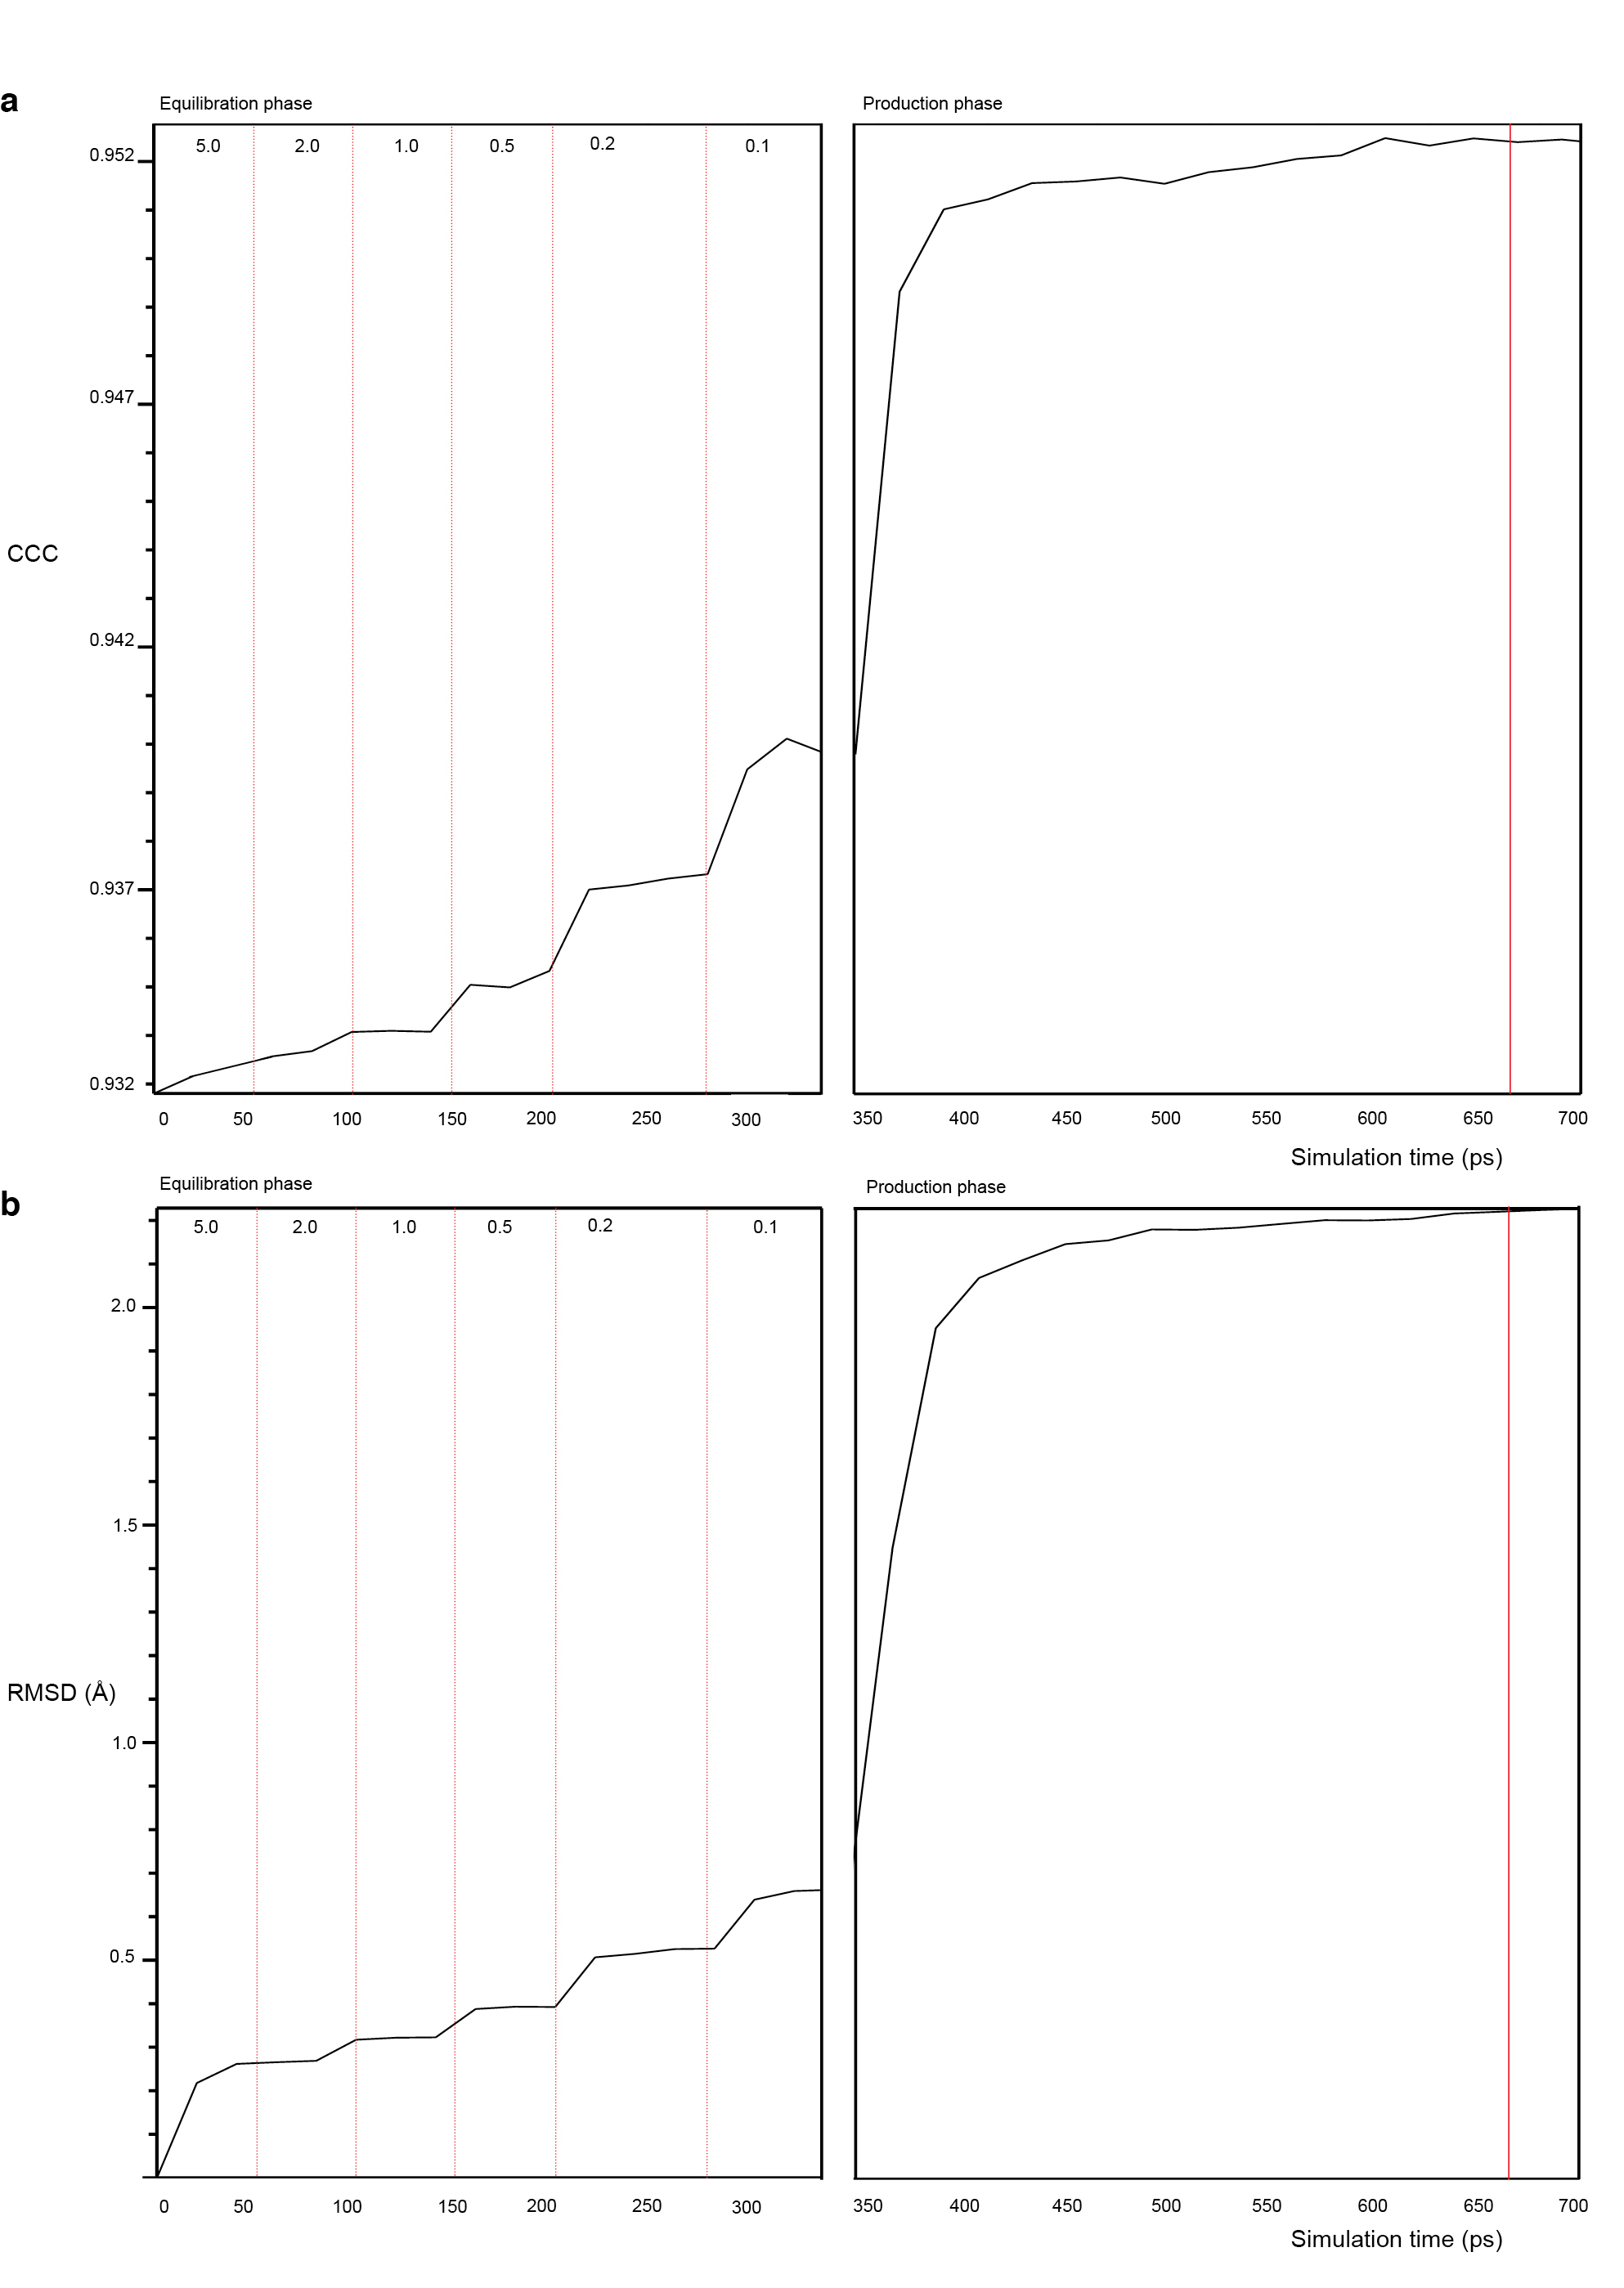
Next, the open-L1 70S and ATP-bound EttA structure model were rigid-body fitted into the Class1 cryo-EM map, with EttA model binding to the E site, using the FIT IN MAP module in Chimera. The intermolecular steric clashes were fixed manually using PyMOL. The whole system was then minimized for 1000 steps in NAMD, followed by in vacuo MDFF in NAMD for 300 ps to relax the system in the presence of EttA. In order to have a better representation of the inter/intra molecular interaction, the whole system was then embedded in a solvent box of TIP3P water molecules with an extra 12 Å padding in each direction, and negative charges of the ribosome complex were neutralized with potassium ions with an excess amount of ~0.2 M KCl. The whole system was then minimized for 3000 steps in NAMD, followed by MDFF. The in-solvent MDFF was equilibrated over 350ps by applying harmonic positional constraints staring at 5.0 kcal/(mol* Å) and decreasing progressively till 0.1 kcal/(mol* Å) upon starting the trajectories production phase with no harmonic constraints. The run was stopped at 700 ps of simulation time, after the whole system converged as estimated by the root-mean-squared deviation (RMSD) and cross-correlation coefficient (CCC) values (Supplementary Fig. 4). All the simulated systems were prepared using CHARMM68,69 force field parameters (Combining CHARMM All-Hydrogen Topology File for CHARMM22 Proteins and CHARMM27 Lipids).
Solvent-accessible surface area was measured using PyMol66. Density map of X-ray structure was converted using UCSF Chimera62. Figures were generated using UCSF Chimera62 and PyMol66.
E site binding competition assay
Deacylated [32P]tRNAPhe synthesis70,71
34 µM of tRNAPhe (Sigma-Aldrich) was incubated with 50 mM of Glycine (pH 9), 10 mM MgCl2, 360 Ci/mmol [α-32P]ATP (Perkin Elmer), 0.05 mM sodium pyrophosphate and 0.03 mg/ml of nucleotidyl transferase. The reaction was incubated 5 min at 37°C. Radioactively labeled tRNA was purified by phenol/chloroform extraction followed by an ethanol precipitation and resuspended in milliQ water and filtered through a P6 column (Bio-Rad) pre-equilibrated with milliQ water in order to remove unincorporated radioactivity.
E site binding filter assay
The assay was based on the original assay of Grajevskaja et al.26 used to discover the E site. The 70S ribosomes used for the assay were prepared as for the minimal in vitro purified translation assay4. 70S ribosomes (0.2 µM) were incubated in the presence of increasing concentration of EttA-EQ2 (0, 0.2, 0.4, 0.8, 1.0, and 1.2 µM) and deacylated [32P]tRNAPhe (0.4 µM) for 2 min at 4 °C in 0.1 mM ATP, 10 mM Mg(OAc)2, 100 mM NH4Cl, 20 mM Tris-HCl (pH 7.4) in a 20 µl reaction. 5 µl of each reaction were spotted on a nitrocellulose filter (25 mm, 0.45 µm, nitrocellulose, disc filters, Millipore) installed on a Sampling Manifold (Millipore) under constant vacuum. After 3 washes with 2 ml of 20 mM Mg(OAc)2, 100 mM NH4Cl, 1 mM EDTA, 20 mM Tris-HCl (pH 7.4), the filters were immersed in scintillation liquid (Ultima Gold, PerkinElmer) and counted on a scintillation counter (Beckman LS6500). 5 µl of each reaction was also counted without being spotted on a nitrocellulose filter or washed, to give the total radioactivity in each reaction. The ratio of radioactivity retained on the filter versus total were calculated and adjusted to the mole of ribosome in each reaction.
Curve fitting and analysis
EttA-EQ2 was used to drive displacement of deacylated tRNA from the ribosomal E site in the absence of A-site tRNA (Fig. 2 in the main text). The binding affinity of this mutant variant of EttA for the ribosome in the presence of Mg-ATP was inferred from the resulting data based on the following competitive-binding model:
In this chemical equation, the species in the middle represent the free forms of the interaction partners, while those on the left and right represent the two competing E-site complexes. The dissociation constants for the competing complexes are given by the following expressions:
This binding model yields the following equation describing the fractional concentration of tRNA remaining bound to the ribosome (Y) in the presence of a given total concentration of EttA ([EttAtotal]) compared to that bound prior to initiating the titration ([ribosome•tRNA]0):
The parameter [tRNAtotal] represents the total concentration of the deacylated tRNA included in the assay (400 nM). The value of Kd-tRNA under assay conditions was determined to be 111 nM based on quantification of the radioactive tRNA bound to ribosomes compared to the total amount of radioactive tRNA prior to adding any EttA, which was used to calculate the free and bound concentrations of tRNA and ribosome. The last equation above was used to fit the data in Fig. 2 in the main text after including appropriate factors to scale it to the experimental data:
In this equation, R([EttAtotal]) represents the measured fraction of ribosomes with tRNA bound in the presence of a given total concentration of EttA compared to that bound in the absence of EttA, B is the background level, and Δ a linear scale factor normalizing for the fraction of ribosomes bound in the absence of EttA. Curve-fitting was performed using the algorithm of Marquardt and Levenberg as implemented in the program PRISM (version 5.0c for Mac OS X, GraphPad Software, San Diego CA USA, www.graphpad.com), constraining the parameter B to be greater than or equal to zero. The best-fit values ± standard error are: Kd-EttA = 47 ± 12 nM, B = 0, and Δ = 0.72 ± 0.05.
Supplementary Material
ACKNOWLEDGEMENTS
This work was supported by Howard Hughes Medical Institute and US National Institutes of Health (US NIH) grants (R01 GM29169 and GM55440) to J.F.; a US NIH grant (2U54 GM074958) and a US National Science Foundation (US NSF) grant (0424043) to J.F.H.; a Burroughs Wellcome Fund Career Awards in the Biomedical Sciences (CABS 1004856), a US NSF CAREER Award (MCB 0644262), and a US NIH National Institute of General Medical Sciences grant (R01 GM084288) to R.L.G.. The authors thank R. A. Grassucci for assistance with cryo-EM data collection, and M. Thomas and C. Kinz-Thompson for assistance with the preparation of illustrations. We thank members of the Frank, Hunt and Gonzalez laboratories for advice and technical assistance.
Footnotes
Accession Codes. The electron microscopy (EM) maps have been deposited in the EMBL-European Bioinformatics Institute EM Data Bank under accession codes EMD-5784, EMD-5785 and EMD-5786 (Class I, Class II, Class III maps, respectively). Coordinates of EM-based model for Class I have been deposited in the RCSB Protein Data Bank under accession numbers 3J5S.
Note: Supplementary information is available on the Nature Structural &Molecular Biology website.
AUTHOR CONTRIBUTIONS
G.B., B.C., J. Fei, J.F.H., R.L.G., and J.F. designed the experiments. G.B. performed biochemical studies and prepared the biological samples for cryo-EM. B.C. collected cryo-EM data and performed 3D reconstruction. Y.H., B.C., and C.W. performed the modeling, fitting and analysis. W.N., and J. Fei collected and analyzed smFRET data. B.C., G.B., Y.H., W.N., R.L.G., J.F.H., and J.F. wrote the manuscript; all authors approved the final manuscript.
COMPETING FINANCIAL INTERESTS
The authors declare no competing financial interests.
REFERENCES
- 1.Wilson DN, Nierhaus KH. The weird and wonderful world of bacterial ribosome regulation. Crit. Rev. Biochem. Mol. Biol. 2007;42:187–219. doi: 10.1080/10409230701360843. [DOI] [PubMed] [Google Scholar]
- 2.Schmeing TM, Ramakrishnan V. What recent ribosome structures have revealed about the mechanism of translation. Nature. 2009;461:1234–1242. doi: 10.1038/nature08403. [DOI] [PubMed] [Google Scholar]
- 3.Steitz TA. A structural understanding of the dynamic ribosome machine. Nat. Rev. Mol. Cell Biol. 2008;9:242–53. doi: 10.1038/nrm2352. [DOI] [PubMed] [Google Scholar]
- 4.Boël G, et al. The ABC-F protein EttA gates ribosome entry into the translation elongation cycle. Nat. Struct. Mol. Biol. 2013 doi: 10.1038/nsmb.2740. [DOI] [PMC free article] [PubMed] [Google Scholar]
- 5.Agrawal RK, Heagle AB, Penczek P, Grassucci RA, Frank J. EF-G-dependent GTP hydrolysis induces translocation accompanied by large conformational changes in the 70S ribosome. Nat. Struct. Biol. 1999;6:643–647. doi: 10.1038/10695. [DOI] [PubMed] [Google Scholar]
- 6.Valle M, et al. Locking and unlocking of ribosomal motions. Cell. 2003;114:123–134. doi: 10.1016/s0092-8674(03)00476-8. [DOI] [PubMed] [Google Scholar]
- 7.Blanchard SC, Kim HD, Gonzalez RL, Puglisi JD, Chu S. tRNA dynamics on the ribosome during translation. Proc. Natl. Acad. Sci. U. S. A. 2004;101:12893–12898. doi: 10.1073/pnas.0403884101. [DOI] [PMC free article] [PubMed] [Google Scholar]
- 8.Cornish PV, Ermolenko DN, Noller HF, Ha T. Spontaneous intersubunit rotation in single ribosomes. Mol. Cell. 2008;30:578–588. doi: 10.1016/j.molcel.2008.05.004. [DOI] [PMC free article] [PubMed] [Google Scholar]
- 9.Cornish PV, et al. Following movement of the L1 stalk between three functional states in single ribosomes. Proc. Natl. Acad. Sci. U. S. A. 2009;106:2571–2576. doi: 10.1073/pnas.0813180106. [DOI] [PMC free article] [PubMed] [Google Scholar]
- 10.Fei J, et al. Allosteric collaboration between elongation factor G and the ribosomal L1 stalk directs tRNA movements during translation. Proc. Natl. Acad. Sci. U. S. A. 2009;106:15702–15707. doi: 10.1073/pnas.0908077106. [DOI] [PMC free article] [PubMed] [Google Scholar]
- 11.Fei J, Kosuri P, MacDougall DD, Gonzalez RL. Coupling of ribosomal L1 stalk and tRNA dynamics during translation elongation. Mol. Cell. 2008;30:348–359. doi: 10.1016/j.molcel.2008.03.012. [DOI] [PubMed] [Google Scholar]
- 12.Frank J, Gao H, Sengupta J, Gao N, Taylor DJ. The process of mRNA-tRNA translocation. Proc. Natl. Acad. Sci. U. S. A. 2007;104:19671–19678. doi: 10.1073/pnas.0708517104. [DOI] [PMC free article] [PubMed] [Google Scholar]
- 13.Kim HD, Puglisi JD, Chu S. Fluctuations of transfer RNAs between classical and hybrid states. Biophys. J. 2007;93:3575–3582. doi: 10.1529/biophysj.107.109884. [DOI] [PMC free article] [PubMed] [Google Scholar]
- 14.Frank J, Agrawal RK. A ratchet-like inter-subunit reorganization of the ribosome during translocation. Nature. 2000;406:318–322. doi: 10.1038/35018597. [DOI] [PubMed] [Google Scholar]
- 15.Agrawal RK, et al. Visualization of tRNA movements on the Escherichia coli 70S ribosome during the elongation cycle. J. Cell Biol. 2000;150:447–460. doi: 10.1083/jcb.150.3.447. [DOI] [PMC free article] [PubMed] [Google Scholar]
- 16.Spirin AS. Ribosomal translocation: facts and models. In: Waldo EC, Kivie M, editors. Prog. Nucleic Acid Res. Mol. Biol. Vol. 32. Academic Press; 1985. pp. 75–114. [DOI] [PubMed] [Google Scholar]
- 17.Gao Y-G, et al. The structure of the ribosome with elongation factor G trapped in the posttranslocational state. Science. 2009;326:694–699. doi: 10.1126/science.1179709. [DOI] [PMC free article] [PubMed] [Google Scholar]
- 18.Pisarev AV, et al. The role of ABCE1 in eukaryotic posttermination ribosomal recycling. Mol. Cell. 2010;37:196–210. doi: 10.1016/j.molcel.2009.12.034. [DOI] [PMC free article] [PubMed] [Google Scholar]
- 19.Khoshnevis S, et al. The iron-sulphur protein RNase L inhibitor functions in translation termination. EMBO Reports. 2010;11:214–219. doi: 10.1038/embor.2009.272. [DOI] [PMC free article] [PubMed] [Google Scholar]
- 20.Barthelme D, et al. Ribosome recycling depends on a mechanistic link between the FeS cluster domain and a conformational switch of the twin-ATPase ABCE1. Proc. Natl. Acad. Sci. U. S. A. 2011;108:3228–3233. doi: 10.1073/pnas.1015953108. [DOI] [PMC free article] [PubMed] [Google Scholar]
- 21.Becker T, et al. Structural basis of highly conserved ribosome recycling in eukaryotes and archaea. Nature. 2012;482:501–506. doi: 10.1038/nature10829. [DOI] [PMC free article] [PubMed] [Google Scholar]
- 22.Karcher A, Schele A, Hopfner K-P. X-ray structure of the complete ABC enzyme ABCE1 from Pyrococcus abyssi . J. Biol. Chem. 2008;283:7962–7971. doi: 10.1074/jbc.M707347200. [DOI] [PubMed] [Google Scholar]
- 23.Grassucci RA, Taylor D, Frank J. Visualization of macromolecular complexes using cryo-electron microscopy with FEI Tecnai transmission electron microscopes. Nat. Prot. 2008;3:330–339. doi: 10.1038/nprot.2007.474. [DOI] [PMC free article] [PubMed] [Google Scholar]
- 24.Frank J. Three-dimensional electron microscopy of macromolecular assemblies: visualization of biological molecules in their native state. USA: Oxford University Press; 2006. [Google Scholar]
- 25.Fei J, et al. A highly purified, fluorescently labeled in vitro translation system for single-molecule studies of protein synthesis. Methods Enzymol. 2010;472:221–259. doi: 10.1016/S0076-6879(10)72008-5. [DOI] [PMC free article] [PubMed] [Google Scholar]
- 26.Grajevskaja RA, Ivanov YV, Saminsky EM. 70-S ribosomes of Escherichia coli have an additional site for deacylated tRNA binding. Eur. J. Biochem. 1982;128:47–52. doi: 10.1111/j.1432-1033.1982.tb06929.x. [DOI] [PubMed] [Google Scholar]
- 27.Valle M, et al. Incorporation of aminoacyl-tRNA into the ribosome as seen by cryo-electron microscopy. Nat. Struct. Biol. 2003;10:899–906. doi: 10.1038/nsb1003. [DOI] [PubMed] [Google Scholar]
- 28.Agirrezabala X, et al. Visualization of the hybrid state of tRNA binding promoted by spontaneous ratcheting of the ratcheting ribosome. Mol. Cell. 2008;32:190–197. doi: 10.1016/j.molcel.2008.10.001. [DOI] [PMC free article] [PubMed] [Google Scholar]
- 29.Trabuco LG, Villa E, Mitra K, Frank J, Schulten K. Flexible fitting of atomic structures into electron microscopy maps using molecular dynamics. Structure. 2008;16:673–683. doi: 10.1016/j.str.2008.03.005. [DOI] [PMC free article] [PubMed] [Google Scholar]
- 30.Atwell S, et al. Structures of a minimal human CFTR first nucleotide-binding domain as a monomer, head-to-tail homodimer, and pathogenic mutant. Protein Eng. Des. Sel. 2010;23:375–384. doi: 10.1093/protein/gzq004. [DOI] [PubMed] [Google Scholar]
- 31.Karpowich N, et al. Crystal structures of the MJ1267 ATP binding cassette reveal an induced-fit effect at the ATPase cctive site of an ABC transporter. Structure. 2001;9:571–586. doi: 10.1016/s0969-2126(01)00617-7. [DOI] [PubMed] [Google Scholar]
- 32.Agirrezabala X, et al. Structural characterization of mRNA-tRNA translocation intermediates. Proc. Natl. Acad. Sci. U. S. A. 2012;109:6094–6099. doi: 10.1073/pnas.1201288109. [DOI] [PMC free article] [PubMed] [Google Scholar]
- 33.Steinberg S, Misch A, Sprinzl M. Compilation of tRNA sequences and sequences of tRNA genes. Nucleic Acids Res. 1993;21:3011–3015. doi: 10.1093/nar/21.13.3011. [DOI] [PMC free article] [PubMed] [Google Scholar]
- 34.Finn RD, et al. The Pfam protein families database. Nucleic Acids Res. 2010;38:D211–D222. doi: 10.1093/nar/gkp985. [DOI] [PMC free article] [PubMed] [Google Scholar]
- 35.Laursen BS, Sorensen HP, Mortensen KK, Sperling-Petersen HU. Initiation of protein synthesis in bacteria. Microbiol. Mol. Biol. Rev. 2005;69:101–123. doi: 10.1128/MMBR.69.1.101-123.2005. [DOI] [PMC free article] [PubMed] [Google Scholar]
- 36.Barraud P, Schmitt E, Mechulam Y, Dardel F, Tisné C. A unique conformation of the anticodon stem-loop is associated with the capacity of tRNAfMet to initiate protein synthesis. Nucleic Acids Res. 2008;36:4894–4901. doi: 10.1093/nar/gkn462. [DOI] [PMC free article] [PubMed] [Google Scholar]
- 37.Voorhees RM, Weixlbaumer A, Loakes D, Kelley AC, Ramakrishnan V. Insights into substrate stabilization from snapshots of the peptidyl transferase center of the intact 70S ribosome. Nat. Struct. Mol. Biol. 2009;16:528–533. doi: 10.1038/nsmb.1577. [DOI] [PMC free article] [PubMed] [Google Scholar]
- 38.Marshall RA, Aitken CE, Puglisi JD. GTP hydrolysis by IF2 guides progression of the ribosome into elongation. Mol. Cell. 2009;35:37–47. doi: 10.1016/j.molcel.2009.06.008. [DOI] [PMC free article] [PubMed] [Google Scholar]
- 39.Sternberg SH, Fei J, Prywes N, McGrath KA, Gonzalez RL. Translation factors direct intrinsic ribosome dynamics during translation termination and ribosome recycling. Nat. Struct. Mol. Biol. 2009;16:861–868. doi: 10.1038/nsmb.1622. [DOI] [PMC free article] [PubMed] [Google Scholar]
- 40.Smith PC, et al. ATP binding to the motor domain from an ABC transporter drives formation of a nucleotide sandwich dimer. Mol. Cell. 2002;10:139–149. doi: 10.1016/s1097-2765(02)00576-2. [DOI] [PMC free article] [PubMed] [Google Scholar]
- 41.Davidson AL, Dassa E, Orelle C, Chen J. Structure, function, and evolution of bacterial ATP-binding cassette systems. Microbiol. Mol. Biol. Rev. 2008;72:317–364. doi: 10.1128/MMBR.00031-07. [DOI] [PMC free article] [PubMed] [Google Scholar]
- 42.Dawson RJ, Locher KP. Structure of a bacterial multidrug ABC transporter. Nature. 2006;443:180–185. doi: 10.1038/nature05155. [DOI] [PubMed] [Google Scholar]
- 43.Oldham ML, Chen J. Crystal structure of the maltose transporter in a pretranslocation intermediate state. Science Signaling. 2011;332:1202. doi: 10.1126/science.1200767. [DOI] [PubMed] [Google Scholar]
- 44.Andersen CBF, et al. Structure of eEF3 and the mechanism of transfer RNA release from the E-site. Nature. 2006;443:663–668. doi: 10.1038/nature05126. [DOI] [PubMed] [Google Scholar]
- 45.Hopfner K-P, et al. Structural biology of Rad50 ATPase: ATP-driven conformational control in DNA double-strand break repair and the ABC-ATPase superfamily. Cell. 2000;101:789–800. doi: 10.1016/s0092-8674(00)80890-9. [DOI] [PubMed] [Google Scholar]
- 46.Vergani P, Lockless SW, Nairn AC, Gadsby DC. CFTR channel opening by ATP-driven tight dimerization of its nucleotide-binding domains. Nature. 2005;433:876–880. doi: 10.1038/nature03313. [DOI] [PMC free article] [PubMed] [Google Scholar]
- 47.Doerfel LK, et al. EF-P is essential for rapid synthesis of proteins containing consecutive proline residues. Science. 2013;339:85–88. doi: 10.1126/science.1229017. [DOI] [PubMed] [Google Scholar]
- 48.Buckstein MH, He J, Rubin H. Characterization of nucleotide pools as a function of physiological state in Escherichia coli. J. Bacteriol. 2008;190:718–726. doi: 10.1128/JB.01020-07. [DOI] [PMC free article] [PubMed] [Google Scholar]
- 49.Chapman AG, Fall L, Atkinson DE. Adenylate energy charge in Escherichia coli during growth and starvation. J. Bacteriol. 1971;108:1072–1086. doi: 10.1128/jb.108.3.1072-1086.1971. [DOI] [PMC free article] [PubMed] [Google Scholar]
- 50.Blaha G, Stanley RE, Steitz TA. Formation of the first peptide bond: the structure of EF-P bound to the 70S ribosome. Science. 2009;325:966–970. doi: 10.1126/science.1175800. [DOI] [PMC free article] [PubMed] [Google Scholar]
- 51.Fei J, Richard AC, Bronson JE, Gonzalez RL. Transfer RNA-mediated regulation of ribosome dynamics during protein synthesis. Nat. Struct. Mol. Biol. 2011;18:1043–1051. doi: 10.1038/nsmb.2098. [DOI] [PMC free article] [PubMed] [Google Scholar]
- 52.Youngman EM, Brunelle JL, Kochaniak AB, Green R. The active site of the ribosome is composed of two layers of conserved nucleotides with distinct roles in peptide bond formation and peptide release. Cell. 2004;117:589–599. doi: 10.1016/s0092-8674(04)00411-8. [DOI] [PubMed] [Google Scholar]
- 53.Suloway C, et al. Automated molecular microscopy: The new Leginon system. J. Struct. Biol. 2005;151:41–60. doi: 10.1016/j.jsb.2005.03.010. [DOI] [PubMed] [Google Scholar]
- 54.Shaikh TR, et al. SPIDER image processing for single-particle reconstruction of biological macromolecules from electron micrographs. Nat. Prot. 2008;3:1941–1974. doi: 10.1038/nprot.2008.156. [DOI] [PMC free article] [PubMed] [Google Scholar]
- 55.Rath BK, Frank J. Fast automatic particle picking from cryo-electron micrographs using a locally normalized cross-correlation function: a case study. J. Struct. Biol. 2004;145:84–90. doi: 10.1016/j.jsb.2003.11.015. [DOI] [PubMed] [Google Scholar]
- 56.Gabashvili IS, et al. Solution structure of the E. coli 70S ribosome at 11.5 Å resolution. Cell. 2000;100:537–549. doi: 10.1016/s0092-8674(00)80690-x. [DOI] [PubMed] [Google Scholar]
- 57.Scheres SHW. A Bayesian view on cryo-EM structure determination. J. Mol. Biol. 2012;415:406–418. doi: 10.1016/j.jmb.2011.11.010. [DOI] [PMC free article] [PubMed] [Google Scholar]
- 58.Scheres SHW. RELION: Implementation of a Bayesian approach to cryo-EM structure determination. J. Struct. Biol. 2012;180:519–530. doi: 10.1016/j.jsb.2012.09.006. [DOI] [PMC free article] [PubMed] [Google Scholar]
- 59.Scheres SH, Chen S. Prevention of overfitting in cryo-EM structure determination. Nat. Methods. 2012;9:853–854. doi: 10.1038/nmeth.2115. [DOI] [PMC free article] [PubMed] [Google Scholar]
- 60.Lewis HA, et al. Structure and dynamics of NBD1 from CFTR characterized using crystallography and Hydrogen/Deuterium exchange mass spectrometry. J. Mol. Biol. 2010;396:406–430. doi: 10.1016/j.jmb.2009.11.051. [DOI] [PubMed] [Google Scholar]
- 61.Kelley LA, Sternberg MJE. Protein structure prediction on the Web: a case study using the Phyre server. Nat. Prot. 2009;4:363–371. doi: 10.1038/nprot.2009.2. [DOI] [PubMed] [Google Scholar]
- 62.Pettersen EF, et al. UCSF Chimera—A visualization system for exploratory research and analysis. J. Comput. Chem. 2004;25:1605–1612. doi: 10.1002/jcc.20084. [DOI] [PubMed] [Google Scholar]
- 63.Humphrey W, Dalke A, Schulten K. VMD: visual molecular dynamics. J. Mol. Graph. 1996;14:33–38. doi: 10.1016/0263-7855(96)00018-5. [DOI] [PubMed] [Google Scholar]
- 64.Dunkle JA, et al. Structures of the bacterial ribosome in classical and hybrid states of tRNA binding. Science. 2011;332:981–984. doi: 10.1126/science.1202692. [DOI] [PMC free article] [PubMed] [Google Scholar]
- 65.Villa E, et al. Ribosome-induced changes in elongation factor Tu conformation control GTP hydrolysis. Proc. Natl. Acad. Sci. U. S. A. 2009;106:1063–1068. doi: 10.1073/pnas.0811370106. [DOI] [PMC free article] [PubMed] [Google Scholar]
- 66.DeLano WL. The PyMOL user’s manual. California: DeLano Scientific, San Carlos; 2002. [Google Scholar]
- 67.Phillips JC, et al. Scalable molecular dynamics with NAMD. J. Comput. Chem. 2005;26:1781–1802. doi: 10.1002/jcc.20289. [DOI] [PMC free article] [PubMed] [Google Scholar]
- 68.Brooks BR, et al. CHARMM: A program for macromolecular energy, minimization, and dynamics calculations. J. Comput. Chem. 1983;4:187–217. [Google Scholar]
- 69.MacKerell AD, et al. CHARMM: The energy function and its parameterization with an overview of the program. In: Schleyer PvR, et al., editors. The Encyclopedia of Computational Chemistry. Vol. 1. Chichester: John Wiley & Sons; 1998. pp. 271–277. [Google Scholar]
- 70.Ledoux S, Uhlenbeck OC. [3′-32P]-labeling tRNA with nucleotidyltransferase for assaying aminoacylation and peptide bond formation. Methods. 2008;44:74–80. doi: 10.1016/j.ymeth.2007.08.001. [DOI] [PMC free article] [PubMed] [Google Scholar]
- 71.Wolfson AD, Uhlenbeck OC. Modulation of tRNAAla identity by inorganic pyrophosphatase. Proc. Natl. Acad. Sci. U. S. A. 2002;99:5965–5970. doi: 10.1073/pnas.092152799. [DOI] [PMC free article] [PubMed] [Google Scholar]
Associated Data
This section collects any data citations, data availability statements, or supplementary materials included in this article.