

Abstract
Purpose
2-Deoxy-2-[18F]fluoro-d-glucose (FDG) is the most commonly used positron emission tomography (PET) tracer for oncological and neurological imaging, but it has limitations on detecting tumor or inflammation in brain gray matter. In this study, we describe the development of 2-deoxy-2-[18F]fluorosorbitol (18F-FDS) and its possible application in lesion detection around brain area.
Procedures
18F-FDS was obtained by reduction of FDG using NaBH4 (81±4% yield in 30 min). Cell uptake/efflux experiments in cell culture and small animal PET imaging on tumor and inflammation models were performed.
Results
Despite the low accumulation in cell culture, 18F-FDS had good tumor uptake and contrast in the subcutaneous U87MG tumor model (4.54%ID/g at 30 min post-injection). Minimal uptake in the normal mouse brain facilitated good tumor contrast in both U87MG and GL-26 orthotopic tumor models. 18F-FDS also had increased uptake in the inflamed foci of the TPA-induced acute inflammation model.
Conclusions
Because of the ease of synthesis and favorable in vivo kinetics, 18F-FDS may have potential applications in certain cases where FDG is inadequate (e.g., brain tumor).
Keywords: Positron emission tomography (PET), 2-Deoxy-2-[18F]fluoro-sorbitol (18F-FDS), 2-Deoxy-2-[18F]fluoro-d-glucose (FDG), Brain tumor, Inflammation
Introduction
During the past two decades, 2-deoxy-2-[18F]fluoro-d-glucose (FDG) has been widely used to assess glucose uptake in patients with various diseases [1–4]. Like glucose and its analog, 2-deoxyglucose, FDG is transported into the cell by specific glucose transporters and phosphorylated by the enzyme hexokinase type II. Once inside the cell, the phosphorylated tracer analog is not metabolized further. Hence, FDG is a trapped tracer, and its accumulation has the potential of tracing glucose uptake, although it cannot trace the metabolic fate of glucose inside the cell [5].
FDG-positron emission tomography (PET) is clinically useful for detecting high-grade gliomas, cerebral lymphomas, and in some cases, unexpected brain metastases in whole-body PET examinations [6, 7]. As an adjunct to computed tomography and magnetic resonance imaging (MRI), FDG-PET can make stereotactic radiosurgery more precise in targeting primary or secondary brain cancers and can differentiate necrotic fibrosis from viable cancer tissue during follow-up in cases of abnormal or equivocal MRI results [8]. FDG-PET is effective in differentiating recurrent tumor from radiation necrosis for high-grade tumors but has limited value in defining the extent of tumor involvement and recurrence of low-grade lesions [9]. Nevertheless, normal biodistribution of FDG includes intense physiologic uptake in the brain gray matter, the highest consumer of glucose in humans. The high background, therefore, makes it difficult to detect nonphysiologic foci with elevated glucose metabolism, which may correspond to malignant lesions.
Thus, there is an urgent need to develop new PET tracers for detecting certain lesions where FDG is inadequate or fails. Unlike FDG, the introduction of 2-deoxy-2-[18F]fluorosorbitol (18F-FDS) for imagining lesions around the brain area may be advantageous because FDS does not utilize glucose transporters, and little normal brain uptake is expected [10]. Moreover, because of the structural similarity with FDG, 18F-FDS might be obtained from the widely available FDG by simply reducing the aldehyde group to hydroxyl group. In this report, we provided the procedure for the synthesis of 18F-FDS and assessed this new agent in cell culture and in small animal models for its possible application in tumor and inflammation imaging around the brain area.
Materials and Methods
Materials
All chemicals were of analytical grade and were obtained commercially without further purification. Sodium borohydride (NaBH4), FDG and 12-O-tetradecanoyl-phorbol-13-acetate (TPA) were purchased from Aldrich (St. Louis, MO, USA). Sep-Pak cartridges were obtained from Waters. 18F-FDG was produced by the cyclotron team at Stanford University. 1H NMR spectra were obtained using the INOVA-400 MHz spectrometer (Palo Alto, CA, USA) at the Chemistry Department, Stanford University. Radio thin-layer chromatography (TLC) was obtained on PeakSimple chromotography data system SRI-202. Water and all buffers were passed through Chelex 100 column before use in radiolabeling procedures to ensure heavy-metal-free conditions.
2-Deoxy-2-fluoro-sorbitol
Sodium borohydride (NaBH4, 10 mg, 0.265) was added to a solution of 2-deoxy-2-fluoro-d-glucose (12 mg, 0.066 mmol) in 1 ml water, and the resulting mixture was stirred at 35°C for 15 min. After quenching the reaction, the mixture was adjusted to a pH of 7.4 and filtered through an Alumina-N Sep-Pak cartridge. The filtrate showed only a single spot on silica TLC plate (Rf=0.34, 80% acetonitrile with 20% water as eluent. Rf=0.55 for FDG). The filtrate was lyophilized, and the title product was obtained in 90% yield: 1H-NMR (D2O), δ 4.00–3.86 (m, 1H), 3.82–3.72 (m, 1H), 3.72–3.60 (m, 4H), 3.58–3.46 (m, 2H); MALDI-TOF-MS, m/z=207.01 for [MNa]+, C6H13FO5Na (calculated molecular weight, 207.06).
2-Deoxy-2-[18F]fluorosorbitol(18F-FDS)
NaBH4 (2 mg, 0.053 mmol) was added to a solution of FDG (555 MBq) in saline, and the resulting mixture was stirred at 35°C for 15 min. After quenching the reaction, the mixture was adjusted to a pH of 7.4 and filtered through an Alumina-N Sep-Pak cartridge. With only one peak based on radio-TLC reader with Rf=0.33 (80% acetonitrile with 20% water as eluent, Rf=0.54 for FDG), 370±28 MBq (n=5) of activity was obtained. The filtrate was then reconstituted in saline and passed through a 0.22-μm Millipore filter into a sterile multidose vial for in vitro and in vivo experiments.
Cell Uptake and Efflux Assay
For the cell uptake experiment, the plastic plates (12 wells) were seeded with 8×10⁵ U87MG cells/well for 16 h, and the adherent cells were then washed with glucose-free medium. FDG and 18F-FDS were diluted in glucose-free medium (0.75 MBq/ml) and incubated with cells for 10, 15, 30, 60, and 180 min. The cell monolayer was washed three times with glucose-free medium and then lysed with NaOH–sodium dodecyl sulfate (SDS; 0.2 M NaOH, 1% SDS) for γ-counting (Packard, Meriden, CT). For the time-dependent efflux experiment, the plastic plates (12 wells) were seeded with 8×10⁵ U87MG cells/well for 16 h, and the adherent cells were then washed with glucose-free medium. FDG and 18F-FDS were diluted in glucose-free medium (0.75 MBq/ml) and then incubated with cells for 180 min. The medium was removed and recultured with glucose-free medium for 15, 30, 60, 120, and 180 min. The cell monolayer was washed with glucose-free medium three times, and the cells were lysed with NaOH–SDS (0.2 M NaOH, 1% SDS) for γ-counting. For the glucose and insulin dependence of cell uptake experiment, the plastic plates (12 wells) were seeded with 8×10⁵ U87MG cells/well for 16 h, and the adherent cells were then washed with glucose-free medium. FDG and 18F-FDS were diluted in glucose-free medium (0.75 MBq/ml) and incubated with cells for 15 min in the presence of different concentrations of glucose or insulin (0, 100, 1,000, and 2,000 μg glucose/ml medium or 0, 1, 10, and 100 μg insulin/ml). The cell monolayer was washed three times with glucose-free medium, and the cells were then lysed with NaOH–SDS (0.2 M NaOH, 1% SDS) for γ-counting.
Animal Models
Animal procedures were performed according to a protocol approved by the Stanford University Institutional Animal Care and Use Committee. The subcutaneous U87MG tumor model was generated by injection of 5×10⁶ cells into the front leg of female athymic nude mice (Harlan, Indianapolis, IN, USA). The mice were used for microPET imaging studies when the tumor volume reached 200–400 mm3 (3–4 weeks after inoculation of the cancer cells). An orthotopic U87MG human brain tumor model was obtained by intracranial injection of U87MG cells in the right frontal lobe of athymic nude mice at coordinates 2 mm lateral and 0.5 mm anterior to the bregma, and 2.5 mm intraparenchymal [11]. Each mouse was injected with 1×10⁵ U87MG cells suspended in 5 μl of phosphate-buffered saline. Tumor cells were allowed to engraft for 6–7 weeks, at which point microPET imaging experiments were conducted. An orthotopic GL-26 murine glioma model was obtained by intracranial injection of GL-26 cells similar to that of the U87MG model except that C57BL/6 mice were used for the murine tumor model and subjected to microPET imaging studies 25–30 days after tumor inoculation.
To induce acute inflammation, 20 μl of TPA solution (100 μg/ml in acetone) was topically applied to the inner and outer surfaces of the right ear of BALB/c mice. Edematous ear swelling was observed after a single dose TPA challenge. The ear thickness increased from 0.24±0.01 to 0.61±0.10 mm within 6 h, at which time the mice were subjected to FDG or 18F-FDS imaging studies.
PET Imaging and Autoradiography
PET imaging and image analysis was performed on a microPET R4 rodent model scanner (Siemens Medical Solutions USA) as described earlier [12, 13]. Each mouse was injected with about 3.7 MBq of the radiopharmaceuticals (18F-FDS or FDG) under isoflurane anesthesia. For each microPET scan, 3D region of interests (ROIs) were drawn over the tumor, liver, kidneys, and muscle on decay-corrected whole-body coronal images. The average radioactivity concentration within a tumor or an organ was obtained from mean pixel values within the ROI volume, which were converted to counts per milliliter per minute by using a conversion factor. Assuming a tissue density of 1 g/ml, the counts per milliliter per minute were converted to counts per gram per minute and then divided by the injected dose (ID) to obtain an imaging ROI-derived percent injected dose per gram of tissue (%ID/g).
For the inflammation model, autoradiography was performed using a Packard Cyclone Storage Phosphor Screen system (Downers Grove, IL, USA). The ears were harvested immediately after the microPET scans at 1 h post-injection (p.i.) for 18F-FDS or 18FFDG. After measuring the radioactivity of each ear with a γ-counter (Packard), the ears were taped to a chilled autoradiography cassette containing a super resolution screen (Packard) and stored overnight at −20°C. Screens were laser-scanned with the Packard Cyclone.
Statistical Analysis
Quantitative data were expressed as mean ± SD. Means were compared using one-way analysis of variance and Student's t test. P values <0.05 were considered statistically significant.
Results
Chemistry and Radiochemistry
Cold FDS was obtained through the reduction of cold FDG (Fig. 1). The same method to reduce FDG also provided 18F-FDS in high yield. No unreacted FDG or other side product was observed. The radio-TLC result correlated well with the cold reaction TLC stained with KMnO4 (under the same TLC strip, the cold compound had Rf=0.34, and the radio peak gave Rf= 0.33). The total synthesis time of 18F-FDS was about 30 min, with a decay-corrected yield of 81±4%. Part of the activity was trapped on the cartridge because of passive binding, which accounted for the major loss of the activity. The specific radioactivity of 18F-FDS was determined to be about 100– 200 TBq/mmol based on the labeling agent 18F-FDG.
Fig. 1.

a Synthetic route for making 18F-2-fluorodeoxysorbitol (18F-FDS) from 2-18F-2-fluorodeoxyglucose (18F-FDG). b Comparison of Rf value for 18F-FDG, 19F-FDG, 19F-FDS, and 18F-FDS on silica TLC plate [eluent, MeCN (80%)/water (20%)].
Cell Uptake and Efflux Assay
In the cell uptake experiment, 18F-FDS behaved very differently from FDG (Fig. 2a). 18F-FDS had only 0.1% uptake in U87MG cells compared with up to 40% cell uptake for FDG. Moreover, FDG had a lower efflux percentage especially at early time points, whereas the efflux for 18F-FDS flattened quickly (Fig. 2b). We also found that the cell uptake of 18F-FDS was not dependent on the concentration of glucose or insulin (Fig. 2c, d). FDG uptake, on the other hand, was significantly decreased with glucose competition and increased with insulin (data not shown). Based on these cell uptake and efflux results, we propose that, unlike FDG, 18F-FDS may not be involved in metabolic pathway or otherwise significantly taken up by cells because of the low cell uptake and little retention of the radioactivity.
Fig. 2.

a Cell uptake assay of 18F-FDG and 18F-FDS on U87 MG tumor cells in glucose-free medium. b18F-FDG and 18F-FDS efflux from U87 MG tumor cells in glucose free medium. c Cell uptake of 18F-FDS on U87 MG tumor cells in different glucose concentration. d Cell uptake of 18F-FDS on U87 MG tumor cells in different insulin concentration (for all the data shown, n=3, means ± SD).
Small Animal PET Imaging of Tumor-Bearing Mice and Inflammation Mice
Dynamic microPET scans were first performed on the subcutaneous U87MG xenograft model, and selected coronal images at different time points after injection of 18F-FDS were shown in Fig. 3a. The tumor was clearly visible with high contrast to contralateral background as early as 5 min p.i. Quantitation of tumor and major organ activity accumulation in microPET scans was performed by measuring ROIs encompassing the entire tumor and organs in the coronal orientation. The U87MG tumor uptake of 18F-FDS was calculated to be 2.43%ID/g at 15 min p.i. in this animal model. The tumor to major organ ratios were also calculated at 30 min p.i., and the results were shown in Fig. 3b. The high tumor to brain ratio (up to 13.6) made 18F-FDS a promising tracer for detecting lesions around brain area. Representative microPET images of the orthotopic U87MG tumor model at different time points after 18F-FDS injection were shown in Fig. 4a. Because of the low background activity of normal brain, 18F-FDS uptake within the tumor area was low but could be differentiated from the normal brain. In comparison, 18F-FDG showed high uptake in both normal and tumor-bearing mouse brains (Fig. 4b), which limited its ability to delineate the tumor. We also compared 18F-FDS with FDG in the orthotopic GL-26 tumor model (Fig. 4c). Unlike FDG, the tumor could be clearly viewed by 18F-FDS, and the uptake could be as high as 6.38%ID/g at 40 min. Similar to U87MG model, FDG is unable to separate the high normal brain uptake from the tumor in GL-26 tumor mice. 18F-FDS is cleared more slowly in this GL-26 tumor model because a 60-min dynamic scan was carried out.
Fig. 3.

a Decay-corrected whole-body coronal microPET images of athymic female nude mice bearing U87 MG tumor at 5, 15, 30, and 60 min p.i. of 3.7±0.3 MBq of 18F-FDS. Tumor positions are indicated by arrows. b Tumor to brain, muscle, heart, kidney, liver, and intestine ratio of 18F-FDS for athymic female nude mice bearing U87 MG tumor (30 min p.i., n=3, means ± SD).
Fig. 4.

a Decay-corrected coronal and sagittal microPET images of the normal nude mice brain and the brain of an orthotopic U87 MG tumor model at 30 and 60 min p.i. of 3.7±0.3 MBq of 18F-FDS. b Decay-corrected coronal and sagittal microPET images of a normal nude mouse brain and the brain of an orthotopic U87 MG tumor model at 30 and 60 min p.i. of 3.7± 0.3 MBq of 18F-FDG. c Decay-corrected coronal and sagittal microPET brain images of an orthotopic GL-26 tumor model at 5, 15, 30, and 60 min p.i. of 3.7±0.3 MBq of 18F-FDS and 18F-FDG. Tumor positions are indicated by arrows.
18F-FDS was also successful in visualizing the TPA-induced inflammation model (Fig. 5a). The tracer uptake in the inflamed ear was four times higher than the control ear based on γ-counting results (Fig. 5c). Both 18F-FDS and FDG gave good inflamed ear to normal ear ratios on autoradiography (Fig. 5b) and gamma-counting (Fig. 5c), although the absolute uptake for 18F-FDS was only one fifth of that for FDG. However, the inflamed ear was harder to detect for FDG on microPET because of high brain activity (Fig. 5a).
Fig. 5.

a Decay-corrected whole-body coronal microPET images of balb/c mice with right-ear inflammation at 5, 10, 20, 30, and 60 min p.i. of 3.7±0.3 MBq of 18F-FDS and 18F-FDG. Note that the last picture for 18F-FDS at 60 min is 2%ID/g scale (asterisk). Inflammation positions are indicated by arrows. b The autoradiography of the ears on inflammation model for 18F-FDS and 18F-FDG at 1 h p.i. c The γ-counting result of 18F-FDS and 18F-FDG for ear inflammation model at 1 h p.i. (n=3, means ± SD). The contrast for 18F-FDS (right-ear uptake/left-ear uptake) is 4.21±1.33, and the contrast for 18F-FDG is 3.44±0.25.
Discussion
FDG-PET has been shown to effectively detect many types of primary tumors and metastases. However, it has a limited role in the diagnosis of prostate cancer and brain tumors because of the high background. In our experimental settings, we found that 18F-FDS, a PET tracer obtained by reducing FDG with NaBH4, has good tumor to background ratios in both subcutaneous nonbrain regions and orthotopic brain tumor xenograft models. This tracer might also be useful for detecting inflammation near brain area.
The aldose reductase sorbitol (ARS) pathway [14] consists of two enzymes, aldose reductase (ALR) and sorbitol dehydrogenase (SDH):
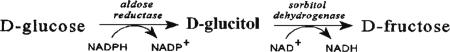 |
The 19F-NMR study of FDG in the ARS pathway in rat brain identifies up to five metabolites, namely, 2-fluoro-2-deoxy-d-sorbitol (FDS), 5-fluoro-5-deoxy-L-sorbose (nFDSS), 5-fluoro-5-deoxy-L-sorbose 1-phosphate (FDSS-1-PO4), 2-fluoro-2-deoxy-L-glyceraldehyde (FDGA), and 2-fluoro-2-deoxyglycerol (FDGL) [15]. A recent study on the catalysis mechanism of these enzymes showed that ALR (first step) has broad substrate specificity, and FDG is a good substrate for it [10]. In contrast, SDH has a more discriminating pattern of substrate specificity (second step). The 2-hydroxyl group of sorbitol is a critical functional group that acts as a hydrogen bond donor to an active site of SDH [15]. FDS, with substitution by fluorine at the 2-position of d-glucitol, completely abrogated the recognition by SDH [10, 16]. Our cell uptake and efflux studies also support the observations by the 19F-NMR spectroscopy and enzymatic assays described above.
Intracellular accumulation of FDG is mediated by two different mechanisms: transport and endocytosis [17]. The fact that cellular uptake of FDG is effectively inhibited in the presence of high concentrations of glucose suggests its transport into brain tumor cells via specific glucose transport proteins. On the other hand, 18F-FDS exhibited very poor diffusion into cells and low intracellular retention (Fig. 2a). Because the 2-position of sorbitol was substituted by 18F, SDH-mediated retention of 18F-FDS is likely abrogated in U87MG tumor cells. Without the trapping mechanism found for cell retention, cellular uptake of 18F-FDS might be based on passive diffusion and, thereby, driven by the concentration gradient between extra- and intracellular compartments. Because of the hydrophilic character of 18F-FDS, it does not penetrate the plasma membrane and is, thus, not retained in the cell.
Despite the low cellular uptake of 18F-FDS in culture, this tracer showed good tumor/muscle contrast in the subcutaneous U87MG tumor model. The U87MG cell uptake of 18F-FDS in culture is about two log orders of magnitude lower than that of 18F-FDG; whereas the U87MG tumor uptake of 18F-FDS in subcutaneous U87MG xenograft model is only three- to fourfold lower than that of FDG. It is also of note that the tumor uptake of FDG increases, whereas that of 18F-FDS decreases with time. All these observations suggest that 18F-FDS has the characteristics of a blood flow agent [18, 19]. And if this is true, the tumor contrast resulting from 18F-FDS imaging is more likely attributed to the accumulation of tracer in the interstitial tumor space (in the extracellular fluid or in the blood that has found its way into the interstitial space because of leaky vasculature). However, more assays or measures for 18F-FDS metabolites need to be carried out to further understand the tracer before a conclusion is drawn. We also tested the relative rates of excretion of 18F-FDS and FDG into the urinary bladder. The activity concentration in urine was determined to be 38.2±6.9 mBq/g for 18F-FDS and 7.2±0.2 mBq/g for FDG at 15 min p.i. of 3.7 MBq of 18F-FDS or FDG. The results showed that 18F-FDS clears more than five times faster than 18F-FDG. The slower clearance rate for FDG might be caused by kidney GLUTs in conserving glucose.
The most striking difference between FDG and 18F-FDS in vivo is the behavior in orthotopic brain tumor models. Although both tracers have good hydrophilicity and small molecular weight, FDG exhibits high and persistent uptake in the normal mouse brain, whereas 18F-FDS has virtually no uptake in normal brain. FDG was unable to differentiate tumor from normal brain in both orthotopic U87MG and GL-26 tumor models. 18F-FDS, however, shows excellent tumor/brain contrast as the brain had minimal activity accumulation. Whether such finding can be translated into clinic for imaging brain tumor patients has yet to be determined.
FDG is not a cancer-specific agent and is known to accumulate in cases of acute inflammation in granulomatous diseases and in autoimmune diseases [20–22]. Under such conditions, the suggestion is that 18F-FDG is taken up by infiltrating cells such as macrophages, lymphocytes, and granulocytes. In our TPA-induced acute inflammation model, 18F-FDG showed markedly increased uptake in TPA-treated mouse ear as compared to the untreated control ear, presumably because of the uptake by infiltrating macrophages. Similar contrast (but lower absolute uptake) was also observed for 18F-FDS. However, the mechanism for the inflammation contrast derived from 18F-FDS could be very different from FDG. Acute inflammation causes vessel dilation and, thus, increased blood flow to the areas of inflammation. Increased blood flow and leaky vasculature might allow 18F-FDS to escape the bloodstream and enter inflamed tissues; the net result may lead to increased uptake of 18F-FDS by the inflamed foci.
Although we have demonstrated that 18F-FDS can be efficiently obtained and applied for imaging brain tumor and inflammation in mice, it is still not confirmative how the 18F-FDS transport across the blood–brain barrier and tumor cell membranes, as well as the mechanism of 18F-FDS for brain tumor imaging. More assays and measures for 18F-FDS metabolites in tumor, brain blood, or urine will be needed in the future to help understand the mechanism for the uptake of this compound in vivo.
Conclusions
We successfully synthesized 18F-FDS by reducing FDG. 18F-FDS, lacking appropriate transporters and/or enzymes for specific cell uptake and retention, has been applied to image brain tumor and inflammation in mice. 18F-FDS, with low uptake in the normal brain, might be suitable for glioma imaging. The robustness of the tracer synthesis starting from readily available FDG, as well as excellent brain tumor imaging characteristics, warrants further testing of this new compound in preclinical and eventually clinical applications.
Acknowledgments
This work was supported by the National Cancer Institute (NCI; R01 CA119053, R21, CA121842, R21 CA102123, ICMIC P50 CA114747, CCNE U54 CA119367, and R24 CA93862), Department of Defense (DOD; W81XWH-07-1-0374, W81XWH-04-1-0697, W81XWH-06-1-0665, W81XWH-06-1-0042, and DAMD17-03-1-0143).
References
- 1.Gambhir SS, Czernin J, Schwimmer J, Silverman DH, Coleman RE, Phelps ME. A tabulated summary of the FDG PET literature. J Nucl Med. 2001;42:1S–93S. [PubMed] [Google Scholar]
- 2.Shields AF. Positron emission tomography measurement of tumor metabolism and growth: its expanding role in oncology. Mol Imaging Biol. 2006;8:141–150. doi: 10.1007/s11307-006-0039-2. [DOI] [PubMed] [Google Scholar]
- 3.Ghesani M, Depuey EG, Rozanski A. Role of 18F-FDG positron emission tomography (PET) in the assessment of myocardial viability. Echocardiography. 2005;22:165–177. doi: 10.1111/j.0742-2822.2005.04032.x. [DOI] [PubMed] [Google Scholar]
- 4.Cizek J, Herholz K, Vollmar S, Schrader R, Klein J, Heiss WD. Fast and robust registration of PET and MR images of human brain. Neuroimage. 2004;22:434–442. doi: 10.1016/j.neuroimage.2004.01.016. [DOI] [PubMed] [Google Scholar]
- 5.Smith TA. The rate-limiting step for tumor [18F]fluoro-2-deoxy-D-glucose (FDG) incorporation. Nucl Med Biol. 2001;28:1–4. doi: 10.1016/s0969-8051(00)00177-3. [DOI] [PubMed] [Google Scholar]
- 6.Benard F, Romsa J, Hustinx R. Imaging gliomas with positron emission tomography and single-photon emission computed tomography. Semin Nucl Med. 2003;33:148–162. doi: 10.1053/snuc.2003.127304. [DOI] [PubMed] [Google Scholar]
- 7.Rajendran JG, Mankoff DA, O'Sullivan F. Hypoxia and glucose metabolism in malignant tumors: evaluation by [18F]fluoromisonidazole and [18F]fluorodeoxyglucose positron emission tomography imaging. Clin Cancer Res. 2004;10:2245–2252. doi: 10.1158/1078-0432.ccr-0688-3. [DOI] [PubMed] [Google Scholar]
- 8.Talbot JN, Kerrou K, Gault N, et al. PET and malignant cerebral tumors. Presse Med. 2006;35:1347–1353. doi: 10.1016/s0755-4982(06)74818-7. [DOI] [PubMed] [Google Scholar]
- 9.Hustinx R, Pourdehnad M, Kaschten B, Alavi A. PET imaging for differentiating recurrent brain tumor from radiation necrosis. Radiol Clin North Am. 2005;43:35–47. doi: 10.1016/j.rcl.2004.09.009. [DOI] [PubMed] [Google Scholar]
- 10.Scott ME, Viola RE. The use of fluoro- and deoxy-substrate analogs to examine binding specificity and catalysis in the enzymes of the sorbitol pathway. Carbohydr Res. 1998;313:247–253. doi: 10.1016/s0008-6215(98)00266-3. [DOI] [PubMed] [Google Scholar]
- 11.Hsu AR, Hou LC, Veeravagu A, Tse V, Chen X. In vivo near-infrared fluorescence imaging of integrin avb3 in an orthotopic glioblastoma model. Mol Imaging Biol. 2006;8:315–323. doi: 10.1007/s11307-006-0059-y. [DOI] [PubMed] [Google Scholar]
- 12.Cai W, Zhang X, Wu Y, Chen X. A thiol-reactive 18F-labeling agent, N-[2-(4–18F-fluorobenzamido)ethyl]maleimide (18F-FBEM), and the synthesis of RGD peptide-based tracer for PET imaging of avb3 integrin expression. J Nucl Med. 2006;47:1172–1180. [PMC free article] [PubMed] [Google Scholar]
- 13.Zhang X, Cai W, Cao F, et al. 18F-labeled bombesin analogs for targeting GRP receptor-expressing prostate cancer. J Nucl Med. 2006;47:492–501. [PubMed] [Google Scholar]
- 14.Jeffery J, Jornvall H. Enzyme relationships in a sorbitol pathway that bypasses glycolysis and pentose phosphates in glucose metabolism. Proc Natl Acad Sci U S A. 1983;80:901–905. doi: 10.1073/pnas.80.4.901. [DOI] [PMC free article] [PubMed] [Google Scholar]
- 15.Trikha M, Zhou Z, Timar J, et al. Multiple roles for platelet GPIIb/IIIa and avb3 integrins in tumor growth, angiogenesis, and metastasis. Cancer Res. 2002;62:2824–2833. [PubMed] [Google Scholar]
- 16.Pauly TA, Ekstrom JL, Beebe DA, et al. X-ray crystallographic and kinetic studies of human sorbitol dehydrogenase. Structure. 2003;11:1071–1085. doi: 10.1016/s0969-2126(03)00167-9. [DOI] [PubMed] [Google Scholar]
- 17.Deichen JT, Prante O, Gack M, Schmiedehausen K, Kuwert T. Uptake of [18F]fluorodeoxyglucose in human monocyte-macrophages in vitro. Eur J Nucl Med Mol Imaging. 2003;30:267–273. doi: 10.1007/s00259-002-1018-8. [DOI] [PubMed] [Google Scholar]
- 18.Studenov AR, Berridge MS. Synthesis and properties of 18F-labeled potential myocardial blood flow tracers. Nucl Med Biol. 2001;28:683–693. doi: 10.1016/s0969-8051(01)00233-5. [DOI] [PubMed] [Google Scholar]
- 19.Okazawa H, Yonekura Y, Fujibayashi Y, et al. Measurement of regional cerebral blood flow with copper-62-PTSM and a three-compartment model. J Nucl Med. 1996;37:1089–1093. [PubMed] [Google Scholar]
- 20.Strauss LG. Fluorine-18 deoxyglucose and false-positive results: a major problem in the diagnostics of oncological patients. Eur J Nucl Med. 1996;23:1409–1415. doi: 10.1007/BF01367602. [DOI] [PubMed] [Google Scholar]
- 21.Shreve PD. Focal fluorine-18 fluorodeoxyglucose accumulation in inflammatory pancreatic disease. Eur J Nucl Med. 1998;25:259–264. doi: 10.1007/s002590050226. [DOI] [PubMed] [Google Scholar]
- 22.Nakamoto Y, Saga T, Ishimori T, et al. FDG-PET of autoimmune-related pancreatitis: preliminary results. Eur J Nucl Med. 2000;27:1835–1838. doi: 10.1007/s002590000370. [DOI] [PubMed] [Google Scholar]