Abstract
Elevated levels of circulating endothelial cells (CECs) occur in response to various pathological conditions including myocardial infarction (MI). Here, we adapted a fluid phase biopsy technology platform that successfully detects circulating tumor cells in blood of cancer patients (HD-CTC assay), to create a High-Definition Circulating Endothelial Cell (HD-CEC) assay for the detection and characterization of CECs. Peripheral blood samples were collected from 79 MI patients, 25 healthy controls and 6 patients undergoing vascular surgery (VS). CECs were defined by positive staining for DAPI, CD146 and von Willebrand Factor and negative staining for CD45. In addition, CECs exhibited distinct morphological features that enable differentiation from surrounding white blood cells. CECs were found both as individual cells and as aggregates. CEC numbers were higher in MI patients compared with healthy controls. VS patients had lower CEC counts when compared with MI patients but were not different from healthy controls. Both HD-CEC and CellSearch® assays could discriminate MI patients from healthy controls with comparable accuracy but the HD-CEC assay exhibited higher specificity while maintaining high sensitivity. Our HD-CEC assay may be used as a robust diagnostic biomarker in MI patients.
1. Introduction
Coronary artery disease is a leading cause of morbidity and mortality worldwide. This condition is characterized by formation of atherosclerotic plaques, which frequently ulcerate or rupture. Such disruptive events can induce clot formation, cut off myocardial blood flow, and thus induce a myocardial infarction (MI). Prior to the acute clinical event, the inflammation within the arterial wall leads to endothelial denudation and the presence of increased numbers of circulating endothelial cells (CECs) in the blood. Accordingly, CECs are a relatively new candidate biomarker to monitor arterial plaque disruption [1-5] and treatment response [3]. More acutely, increased numbers of CECs has been strongly associated with an ongoing MI, and thus could represent a potential diagnostic tool in patients presenting with worrisome symptoms. Currently, there is no method to reliably predict a heart attack since all of the tests for coronary artery disease, such as coronary angiography or exercise with nuclear scintigraphy, are geared to detect the underlying high risk conditions (such as atherosclerotic burden or diminished myocardial blood flow), rather than an imminent significant plaque rupture. The ability to identify individuals at the greatest risk of heart attack before its clinical manifestation is considered the most important unmet need in cardiovascular medicine.
Elevated CEC counts have been reported in multiple diseases including cardiovascular disorders, systemic vasculitis [6] and cancer [7]. To date, these reports have varied greatly, mainly due to different CEC definitions and detection methods used, such as flow cytometry which has the advantage of allowing for cell sorting, but has the disadvantage of not being robust for enumeration of very small populations of cells [8]. The identification of CECs in other instances has relied on adapted immunomagnetic technologies typically used to detect circulating epithelial cells, also known as circulating tumor cells (CTCs). Both CECs and CTCs constitute rare populations relative to the normal nucleated cells in the bloodstream. The majority of CTC capture technologies rely on identifying CTCs using either the cell surface protein EpCAM or the cytokeratin class of intermediate filament proteins to determine epithelial origins and to distinguish these cells from normal blood cells [9-14]. In the analogous case of endothelial cells, these systems have adopted the use of endothelial cell markers such as CD146 and von Willebrand Factor (vWF) to capture and identify CECs [15, 16]. Lack of sensitivity plagues the CTC capture methods whereas a lack of specificity is the more substantial challenge in the CEC identification.
Recent genome-wide association (GWA) studies of acute MI, coronary artery disease, intracranial aneurysm, aortic aneurysm, and stroke have provided unique insights into the genomic underpinnings of various vascular phenotypes [17-20]. The common thread among these aforementioned vascular phenotypes has been the discovery of genes known to affect endothelial function and inflammation. The inability to directly access coronary artery disease tissue, however, has hindered the capacity to gather more information on potential prognostic biomarkers. CECs thus present an opportunity to assess and examine the disease from the very cells that are being shed due to disease [4, 21].
We have recently published a series of papers describing an innovative assay platform called the HD-CTC assay [22] to identify and characterize CTCs at higher sensitivity and higher resolution than that of the currently FDA approved CTC methodology (CellSearch®). Here, we adapted that platform to detect, enumerate and characterize CECs. This HD-CEC non-enrichment rare cell detection system identifies and characterizes CECs using a combination of morphologic criteria and antibodies against vWF, CD146, and CD45. We used this adapted technology to address the hypothesis that patients with recent acute MI have an increased level of CECs as compared to healthy controls as a prerequisite clinical validation to motivate a prospective study to investigate CECs in the pre-MI setting. This assay was applied to a patient sample set previously analyzed by the CellSearch® Circulating Endothelial Cell methodology, and demonstrated improved specificity and integrated high quality imaging for detecting, enumerating, and preserving CECs from patient blood samples.
2. Methods
2.1 Patient selection and blood sample collection
Patients enrolled in this study were recruited at 5 hospitals relatively close to the central laboratory at The Scripps Research Institute: Scripps Green, Scripps Mercy, Sharp Memorial, Sharp Grossmont, and Palomar Pomerado hospitals. Institutional review board (IRB) approval was obtained from all recruiting sites, and all patients gave informed consent. Samples were collected from patients with suspected MI at the time of presentation to the emergency room, and were subsequently destroyed if the patient was shown not to have a MI, or if the patient withheld consent. Samples were also excluded if they did not reach the laboratory within the required time or if the sample was otherwise damaged. The final experimental sample set thus consisted of 79 tubes of blood collected from 79 patients subsequently confirmed to have been experiencing a MI at the time of blood collection according to the eligibility criteria which included the usual clinical parameters (i.e. CK-MB, troponin, ST elevation) as described by Damani et al. [23]. In addition, two control groups were collected for the purpose of comparing CEC levels and morphology to such measures obtained from MI patients. Six samples were obtained from patients undergoing endarterectomy procedures (vascular surgery, VS group) Blood was collected after the procedure. This group consisted of patients who by definition had atherosclerotic vascular disease, as evidenced by their need for endarterectomy, and were undergoing an intervention likely to cause disruption of vascular endothelium, but who were not experiencing a MI. Healthy controls were recruited from the normal blood donor program at The Scripps Research Institute. All subjects were well-characterized via self-report. Thirty-four samples were collected from 25 unique healthy donors.
2.2 Blood sample preparation for CEC evaluation
Half of the whole blood volume obtained from 55 subjects enrolled in the study was analyzed in parallel with the HD-CTC assay and the CellSearch® system (Veridex). Peripheral arterial or venous blood analyzed with the HD-CTC assay was drawn into anti-coagulant blood collection tubes (BCT) (EDTA or Streck Cell-Free DNA™). Blood analyzed with the CellSearch® system was drawn into CellSave® tubes (Veridex) and shipped via courier to a central lab. All samples were collected into the corresponding BCT according to the manufacturer's SOP for collection of specimens and stored at room temperature for up to 48 hours before processing.
EDTA or Streck tubes were rocked for 5 minutes before obtaining a white blood cell (WBC) count using a HemoCue® WBC device (Hemocue, Ängelhom, Sweden). The WBC count was used to determine the amount of blood required to plate a consistent loading volume of nucleated cells per slide following the procedures described in Marrinucci et al. [22]. Based upon the WBC count, a volume of blood was subjected to erythrocyte lysis (ammonium chloride solution). After centrifugation, nucleated cells were re-suspended in PBS and attached as a monolayer on custom made glass slides with a proprietary coating that allows maximal retention of live cells. Each slide can hold approximately 3 million nucleated cells, thus the number of cells plated per slide depended on the patients WBC count. The technical validation of this protocol was previously published [22] and it was demonstrated that the fluid biopsy assay is reproducible and robust across multiple operators and duplicate samples. Cells were fixed with 2% paraformaldehyde, permeabilized with cold methanol, and non-specific binding sites were blocked with 10% goat serum. Slides were subsequently incubated with a cocktail of three primary antibodies consisting of a rabbit derived anti- von Willebrand Factor (vWF; 1:200; Sigma, St. Louis, MO), a mouse-derived anti-CD146 (1:500; Millipore, Billerica, MA), and an Alexa Fluor® 647 conjugated goat derived anti-CD45 antibody (1:125; AbD Serotec, Oxford, UK). After PBS washes, slides were incubated at 37°C for 20 minutes with a goat anti-mouse Alexa Fluor® 555 and goat anti-rabbit Alexa Fluor® 488 conjugated secondary antibodies targeting the anti-vWF and anti-CD146 primary antibodies, respectively. Cells were counterstained with DAPI for 10 minutes and mounted with a glycerol-based mounting media. Four slides from each blood sample were evaluated as a single test, which resulted in evaluation of 9.5 ± 1.2 million nucleated cells per test. This represents a range of 0.53 to 3.28 ml of whole blood equivalent per test, depending on the total WBC count of the patient at the time of the draw.
2.3 CEC identification and characterization
All four slides from each subject were scanned using a custom made fluorescent scanning microscope equipped with a motorized x/y-stage as previously described [22]. Cells were categorized based on signal intensity of all antibodies, morphologic characteristics of the cytoplasm and nucleus, and the staining patterns of the vWF and CD146 antibodies. Candidate cells were nucleated and negative for the WBC marker CD45. Cells in that category were then analyzed for CD146 and vWF intensity followed by a morphologic assessment. Cells were classified as HD-CECs if they were positive for DAPI, CD45 negative, and positive for both CD146 and vWF. Furthermore, they were required to be morphologically distinct from the surrounding WBCs. CECs that had typical apoptotic features like blebbing or fragmentation of the cytoplasm or nucleus were also tracked, although not counted as CECs. Two or more CEC candidates that appeared to have nuclei and/or cytoplasm touching were scored as a CEC aggregate. Each HD-CEC candidate is presented in a field of view with sufficient surrounding WBCs to allow for contextual comparison between cytomorphologic features of the cell in question versus the background WBCs.
2.4 Statistical analysis
Graphical representation and statistical analysis of CEC counts was performed using GraphPad Prism (GraphPad Software, Inc., La Jolla, CA). Differences between the median of two groups were determined using the unpaired t test with Welch's correction for unequal population variances. Differences between more than two groups were determined using Kruskal-Wallis test followed by Dunn's post tests. Repetitive measurements on a single sample were compared using the Wilcoxon matched-pairs signed-rank test. A receiver-operating characteristic (ROC) curve associated with a classifier based on logistic regression was constructed using GraphPad Prism. Graphical representation of CEC threshold vs. specificity and sensitivity was performed using Microsoft Excel (Microsoft, Redmond, WA).
3. Results
3.1 CEC identification and characterization using the HD-CEC assay
Representative CECs detected with the HD-CEC assay in blood samples of MI patients are shown in figures 1 and 2. The cells were morphologically distinct from the surrounding WBCs. CECs had larger nuclei relative to the other nuclei in the field of view (figure 1a) which were those of WBCs, as confirmed by positive CD45 staining (figure 1b). Staining patterns for CD146 (figure 1c) and vWF (figure 1d) were both found to be cytoplasmic, but distinct from one another; CD146 staining was diffusely cytoplasmic, whereas vWF staining was somewhat diffuse with a punctate pattern consistent with described vWF staining in porcine micro-vascular endothelial cells [24].
Figure 1.
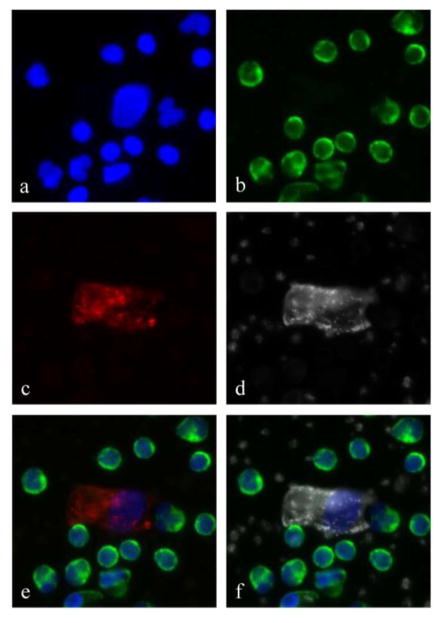
A typical circulating endothelial cell detected with the HD-CEC assay. The panels show a) a DAPI positive, large nucleus surrounded by numerous smaller nuclei of WBCs, b) CD45 positivity on white blood cells only, c) a CD146 positive cytoplasm, and d) von Willebrand factor positive cytoplasm with a staining pattern that is distinct from the CD146. Notice that surrounding platelets are also positive for vWF. Panel e) is the composite image of DAPI, CD45 and CD146 and panel f) is the composite image of DAPI, CD45 and vWF.
Figure 2.
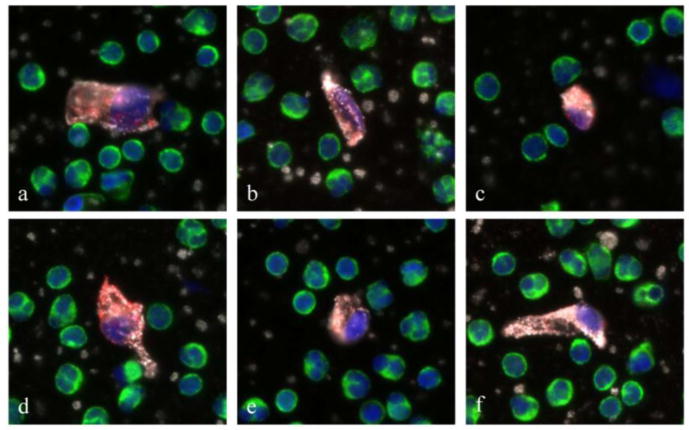
Gallery of representative circulating endothelial cells (CECs) found in MI patients. These cells are characterized by a large DAPI positive nucleus (blue), no CD45 staining (green), and double positive CD146 (red) and vWF (white) staining of cytoplasm. Despite heterogeneity in size and shape, CECs are morphological distinct from surrounding white blood cells.
Visual inspection of individual fluorescent CEC images revealed that the morphologies of CECs isolated from MI patients were markedly heterogeneous in appearance (figure 2 a-f). Different shapes and sizes could be observed. In addition, the nuclei of CECs from MI patients tended to be larger and aberrantly shaped when compared to those detected in control subjects.
3.2 CEC Enumeration
We collected and analyzed 79 peripheral blood draws from 79 MI patients; 28 blood samples were drawn into Streck BCT and 51 into EDTA BCT. We also collected a total of 34 blood samples from 25 healthy controls; 14 samples were drawn into Streck BCT and 20 were drawn into EDTA BCT (table 1).
Table 1.
Breakdown of sample size by study group and blood collection tube (BCT). Mean and median values, as well as lower and upper quartiles are listed for each subject group in the study.
| Study subjects | BCT | # of blood draws | Mean CEC/ml | Median CEC/ml | Quartiles lower | CEC/ml upper |
|---|---|---|---|---|---|---|
| Myocardial Infarction | EDTA | 51 | 50.3 | 20.5 | 6.3 | 53.1 |
| Myocardial Infarction | Streck | 28 | 23.0 | 4.4 | 1.5 | 24.6 |
| Myocardial Infarction | ALL | 79 | 40.6 | 13.7 | 2.9 | 39.4 |
| Healthy control | EDTA | 20 | 0.2 | 0.0 | 0 | 0 |
| Healthy control | Streck | 14 | 0.4 | 0.2 | 0 | 0.5 |
| Healthy control | ALL | 34 | 0.3 | 0.0 | 0 | 0.5 |
| Vascular Surgery | EDTA | 6 | 0.00 | 0.0 | 0 | 0 |
CEC counts detected in MI patients whose blood was drawn into EDTA and Streck tubes were not different (p>0.05, unpaired t test with Welch's correction). The same pattern was observed in healthy controls. Therefore, we continued data analysis pooling CEC counts from both tube types used.
CEC counts in MI patients were significantly elevated when compared to healthy controls (table 1 and figure 4, p=3.19×10⁻¹⁴, Kruskal-Wallis test with Dunn's post test). Patients that underwent vascular surgery had lower CEC counts when compared to MI patients but were not significantly different from healthy controls.
Figure 4.
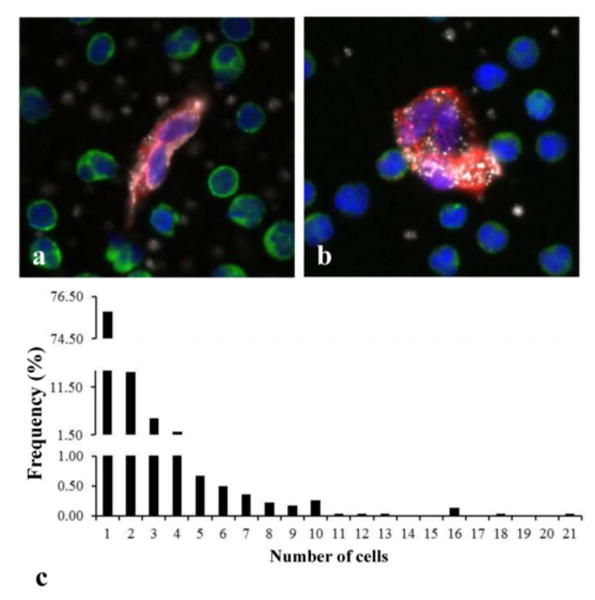
CEC aggregates found in MI patients. a) and b) are representative aggregates of 2 and 3 cells, respectively, with DAPI positive nucleus (blue), no CD45 staining (green), and double positive CD146 (red) and vWF (white) staining of cytoplasm. c) Frequency histogram showing the distribution of CEC aggregates found in all MI patients. Detected CEC aggregates consisted of up to 21 CECs but aggregates containing 2–4 cells were more frequently found.
We also repeated CEC enumeration in 6 randomly selected healthy controls at 2 consecutive visits separated by an 8-week time frame. CEC count per ml blood over the course of the draw schedule did not change (p=0.5, Wilcoxon matched-pairs signed rank test, data not shown), suggesting CEC values remain stable over time in healthy controls.
3.3 CEC Aggregates
CECs were not only found as individual cells. Many of the CEC images from MI patients often contained several nuclei (blue) associated with one cell body indicated by a continuous double positive CD146 (red) and vWF (white) staining of cytoplasm (figures 4 a-b). These images most likely represent aggregates of injured cells released into circulation during plaque rupture.
We detected 2 or more CECs in 65 out of 79 MI patients; 53 of which (81.5%) were found to have CEC aggregates, i.e. two or more cells that appeared to have nuclei and/or cytoplasm touching. Measurements of the percentage of CECs in aggregates (that is, total number of CECs in aggregates/total number of CECs) found that 46.3% ± 23.1% of MI patient's CECs reside in aggregates. CEC aggregates in MI patients varied greatly in number of CEC per aggregate. Up to 21 CECs were detected in an aggregate but aggregates containing 2–4 cells were more frequently found (figure 4 c).
In control subjects, 5 of 34 blood samples (14.7%) had more than one CEC. Two or 3 individual CECs were detected but none of these samples had detectable CEC aggregates.
3.4 Comparison with CellSearch® enumeration on paired samples
The CellSearch® system isolates enriched populations of CECs from blood using anti-CD146 antibody conjugated magnetic nanoparticles. CD146+ enriched cells are then fluorescently labeled with the nuclear stain DAPI and antibodies against CD105 and CD45. CECs are identified based on three criteria: positive staining for nuclei, positive staining for CD105 (an endothelial cell marker), and negative staining for CD45 [23].
Some of samples analyzed with the HD-CEC assay were collected as part of a larger study that involved split samples from the same phlebotomy. Half of the whole blood volume obtained from these 55 subjects was analyzed separately with the CellSearch® system and described by Damani et al. [23].
We conducted a quantitative comparison of sensitivity and specificity measures of the HD-CEC assay vs. the CellSearch® assay by constructing receiver-operating characteristic (ROC) curves associated with a logistic regression classifier with a 10 fold cross-validation performed for each assay, and by measuring the total area under the ROC curves (figure 5). CellSearch® analysis included CEC/ml counts in 94 samples (44 healthy controls and 55 STEMI patients) as reported by Damani et al. The HD-CEC assay included CEC/ml counts in 34 healthy controls and 79 MI patients (55 patients evaluated by Damani et al. with the CellSearch® assay and 24 additional patients) accounting for a total of 113 samples.
Figure 5. ROC curve for the CellSearch® assay (a) and the HC-CEC assay (b).
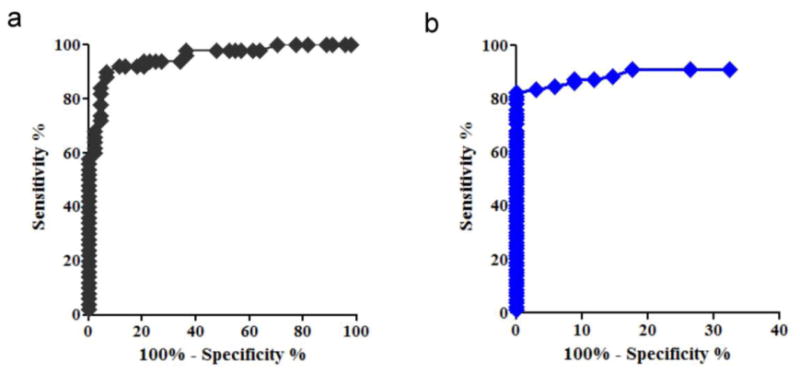
Calculated areas under the curve (AUC) for the HD-CEC assay and the CellSearch® assay data were 93.3% and 95.4%, respectively. An AUC equal to 100% suggests perfect classification (zero false positives and zero false negatives), whereas an AUC of 50% indicates random selection. The AUC determined for the two assays were not statistically different (p>0.05), indicating that both assays have similar overall accuracy in discriminating MI patients from healthy controls. However, considering the cut-off point for discrimination between MI patients and control cases, we found that the HD-CEC assay, as implemented here, had a significantly higher specificity (that is, true controls classified as such) while maintaining the necessary sensitivity (that is, true MI cases classified as such). A classification threshold of 1.5 CECs/ml was associated with 83.5% sensitivity and 97% specificity for correctly classifying an MI case or control.
Figure 6 shows sensitivity and specificity of each assay at different cut-off values of CEC/ml count. Sensitivity performances for both assays overlapped (figure 6 a), whereas specificity performances clearly differed at low CEC/ml cut-off points (figure 6 b).
Figure 6.
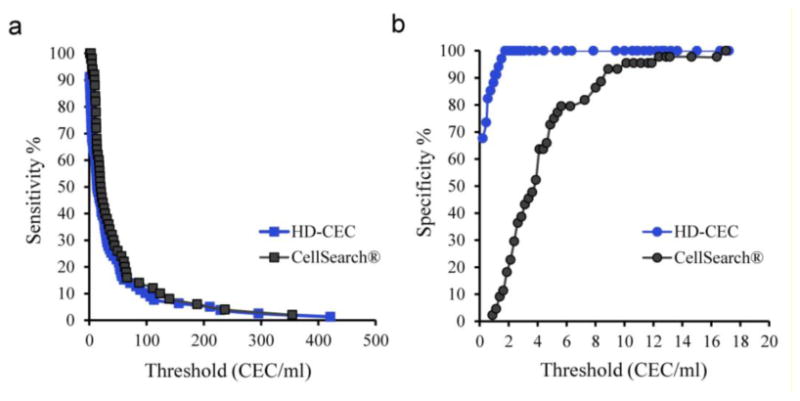
Sensitivity (a) and specificity (b) performances of each assay at different CEC/ml cut-off points. The difference in specificity correlated inversely with the CEC enumeration threshold.
The difference in specificity between the two assays was found to correlate inversely with CEC enumeration threshold. For example at 0.3 CEC/ml count (mean CEC/ml count in control subjects, table 1), the HD-CEC assay demonstrated 70% specificity, while the specificity of the CellSearch® assay for the same count was below 2%. The superior specificity of the HD-CEC assay is due to much lower overlap in CEC/ml enumeration in MI patients and control subjects as compared with the CellSearch® assay (figure 7). The average CEC/ml count in healthy controls detected by the HD-CEC assay (0.26 ± 0.08, SE) was significantly lower than the count according to the CellSearch® assay (4.38 ± 0.48, SE) (p<0.0001, Mann Whitney test).
Figure 7.
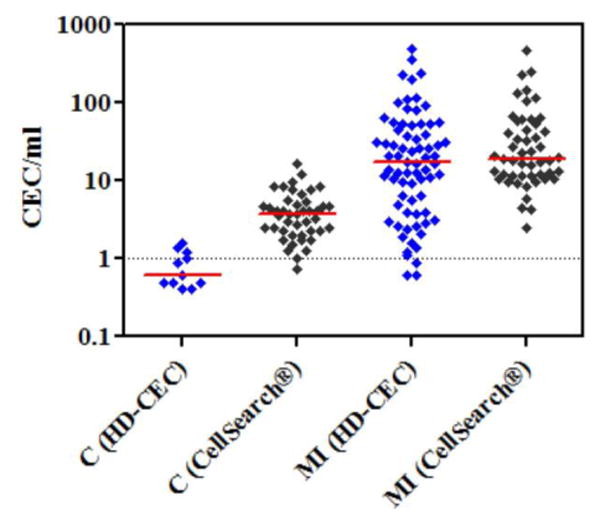
Comparison of the overlap between CEC counts in healthy controls (C) and MI patients as determined by the HD-CEC assay and the CellSearch® assay. Y-axis is in log scale and red lines represent median values.
4. Discussion
The enumeration, characterization, and further study of CECs have a number of potential clinical and research applications. Laboratory markers of endothelial dysfunction and damage are increasingly used in the identification of early stages of cardiovascular disease. Among these novel markers, CECs present in the peripheral blood are of special interest.
Immunomagnetic isolation and fluorescence-activated cell sorting (FACS) are detection techniques that have been widely used to enumerate CECs in peripheral blood with both advantages and pitfalls [25]. Using these approaches, CECs are identified with endothelial antigens (vWF, CD31, CD146) [26].
There is debate about various subcategories of apparently endothelial-derived cells in the circulation, with mixed literature describing cells of varying phenotypes as representing circulating endothelial progenitor cells versus mature circulating endothelial cells [27, 28]. Here we focus on the most straightforward category, those cells representing mature endothelial cells that are identified by a marker routinely used in diagnostic surgical histopathology to identify endothelial cells, vWF, and a fairly universally agreed upon marker in CEC research, CD146. When combined with pan-leukocyte marker CD45 as a negative marker to exclude leukocytes, this protein expression profile enables the definition of HD-CECs. In contrast to the methodology utilized in the CellSearch® system, our assay does not employ CD146-based pre-enrichment, but rather examines each and every nucleated cell on the slide according to vWF/CD146/CD45 expression.
The assay we have developed constitutes a platform with demonstrably superior specificity and routine output of high resolution imagery of CECs. Moreover, positive dual staining for both vWF and CD146 provided higher confidence in the quality of the events than any one marker alone. The overall variation in CEC expression of vWF and CD146 may be a reflection of how the individual cells have reacted to inflammation associated with MI, for example by loss of intracytoplasmic vWF, or of the phenotypic response of CECs to being in circulation compared to being part of an endothelial monolayer.
Our study shows that median CEC counts in MI patients are higher than those found in healthy controls. We also demonstrated that CEC levels remain stable over time in healthy subjects. The endarterectomy patient group served as an interesting comparative population. CEC counts in this group were low and comparable to CEC counts determined in healthy controls. One possibility may be that the carotid artery procedures performed on these patients did not disrupt the vessel endothelium in a way that dislodged individual or small groups of cells that would be detectable in the peripheral blood by this assay. A second hypothesis is that the results are representative of the difference between cells shed acutely during a defined episode of mechanical manipulation, as would occur during endarterectomy, versus cells released over a longer stretch of time due to endothelial dysfunction and damage associated to the development of cardiovascular disease. Also, surgical vascular incisions are generally planned to avoid the areas of most significant atherosclerotic disease – perhaps the endothelium at these sites that are peripheral to the most severe lesions cuts cleanly instead of shedding irregularly.
In MI patients, CECs were detected both as individual cells and as aggregates that resembled the previously characterized CTC aggregates [22, 29]. Overall, little is known about groups of non-blood cells that travel within the bloodstream as aggregates; however, the origin and significance of such aggregates of malignant tumor cells (CTCs) versus benign endothelial cells (CECs) is likely to be different. The in vivo 3D growth geometry of the presumed tissue of origin of clustered CTCs (a malignant tumor) is a rounded nest or gland of invasive malignant tumor; in contrast, the in vivo 3D growth geometry of the tissue of origin of clustered CECs (benign cells that line blood vessels) is a cell monolayer forming a sheet-like lining. Thus, the resultant two-dimensional organization of these groups of cells after deposition onto the assay slide surface is likely to be different. Whether the number and arrangement of CECs present in aggregates may reveal features of the endothelial lesion from which they were shed, remains to be further investigated.
A robust assay could be highly applicable as a diagnostic aid for prompt identification of MI [4] and should ideally yield a binary result (yes/no) regarding the presence or absence of increased CECs. Typical markers of myocardial necrosis that define MI, such as serum levels of cardiac troponins and CK-MB, rise over the hours and days following an arterial disruptive event [5]. This characteristic delay in the confirmation of MI results in many hospital admissions for ‘chest pain, rule out MI’ that end up representing non-cardiac conditions better treated in the outpatient setting. As an adjunct to standard clinical criteria for evaluating chest pain of uncertain etiology or other symptoms indicative of possible MI, such a yes/no answer can provide an additional data point for triaging patients. The ROC analysis demonstrates that CEC counts provide an accurate means for discriminating MI patients from healthy controls. Particularly noteworthy was the fact that when compared with the CellSearch® system, our HD-CEC assay exhibited higher specificity while maintaining high sensitivity. The ideal assay to be incorporated into clinical practice would have high specificity to avoid further increase in unnecessary cardiac work ups for patients who actually have costochondritis or other non-cardiac etiologies for their symptoms. The sensitivity must be ‘sensitive enough’ to not provide false reassurance, although certainly any patient with sufficiently suspicious symptoms would likely be clinically assessed further regardless of CEC count. Although further studies in appropriately large patient groups would be required, the initial evaluation of the assay herein described meets these qualifications.
In addition, HD-CEC here defined may be a potential source of primary endothelial tissue that has previously been inaccessible except in post-mortem scenarios. The methodology used in this study preserves CECs within their contextual environment of WBCs. The cells are retained on the slide and are available for additional downstream testing, and parallel aliquots of cells from the same patient are also available, as only 25% of the sample is used for the initial enumeration process. Studies showing different phenotypes and epigenetic profiles of CECs from various vascular locations in the body have recently been elegantly reviewed [30] with interesting evidence suggesting a purely macrovascular origin of CECs in MI. This assay enables an accurate relocation of individual CECs, which allows for further investigations into the genetic, epigenetic and proteomic analysis of CECs, which could potentially serve as a fluid biopsy of the lining of the vascular system.
In summary, our HD-CEC assay provides a sensitive and specific methodology for CEC enumeration, routine high-resolution imagery for morphologic characterization, and cell preservation for downstream analysis. The assay exhibits high sensitivity to enable the detection of smaller numbers of CECs which may become relevant in the prodromal phase of MI, and higher specificity than the CellSearch® assay. These features bring within reach the eventual clinical goal of using a CEC assay as a robust diagnostic biomarker to determine which patients are at highest or imminent risk of a heart attack.
Figure 3.
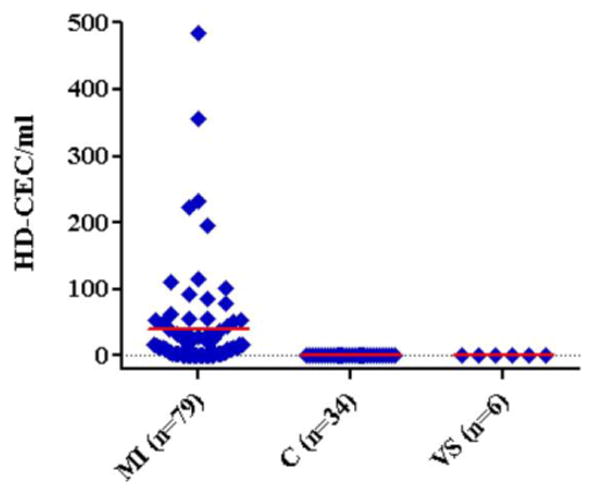
CEC counts in healthy controls (C) and in patients that underwent myocardial infaction (MI) or vascular surgery (VS). Counts are reported as HD-CEC/ml blood with mean values highlighted in red.
Acknowledgments
We thank all the patients that participated in the study and the clinical research staff at Scripps Green, Scripps Mercy, Sharp Memorial, Sharp Grossmont, and Palomar Pomerado hospitals. We thank Dr. Michael Matrone and Dr. Ed Cho for their contribution to the development of the assay, and Dr. Mariam Rodríguez-Lee for scientific editing. The work in this paper was supported by Award Number 3UL1RR025774-02S1 from the National Center for Research Resources and Award Number U54CA143906 from the National Cancer Institute. The content is solely the responsibility of the authors and does not necessarily represent the official views of the National Cancer Institute or the National Institutes of Health. The HD-CTC assay technology described here has been licensed to Epic Sciences. KB, MSL, AK and PK have ownership in Epic Sciences. This is manuscript # 21469 from The Scripps Research Institute.
References
- 1.Boos CJ, Lip GY, Blann AD. Circulating endothelial cells in cardiovascular disease. J Am Coll Cardiol. 2006;48:1538–47. doi: 10.1016/j.jacc.2006.02.078. [DOI] [PubMed] [Google Scholar]
- 2.Boos CJ, Soor SK, Kang D, Lip GY. Relationship between circulating endothelial cells and the predicted risk of cardiovascular events in acute coronary syndromes. Eur Heart J. 2007;28:1092–101. doi: 10.1093/eurheartj/ehm070. [DOI] [PubMed] [Google Scholar]
- 3.Li C, Wu Q, Liu B, Yao Y, Chen Y, Zhang H, Wang C, Cao J, Ge S. Detection and validation of circulating endothelial cells, a blood-based diagnostic marker of acute myocardial infarction. PLoS One. 2013;8:e58478. doi: 10.1371/journal.pone.0058478. [DOI] [PMC free article] [PubMed] [Google Scholar]
- 4.Mutin M, Canavy I, Blann A, Bory M, Sampol J, Dignat-George F. Direct evidence of endothelial injury in acute myocardial infarction and unstable angina by demonstration of circulating endothelial cells. Blood. 1999;93:2951–8. [PubMed] [Google Scholar]
- 5.Quilici J, Banzet N, Paule P, Meynard JB, Mutin M, Bonnet JL, Ambrosi P, Sampol J, Dignat-George F. Circulating endothelial cell count as a diagnostic marker for non-st-elevation acute coronary syndromes. Circulation. 2004;110:1586–91. doi: 10.1161/01.CIR.0000142295.85740.98. [DOI] [PubMed] [Google Scholar]
- 6.Haubitz M, Woywodt A. Circulating endothelial cells and vasculitis. Intern Med. 2004;43:660–7. doi: 10.2169/internalmedicine.43.660. [DOI] [PubMed] [Google Scholar]
- 7.Kraan J, Sleijfer S, Foekens JA, Gratama JW. Clinical value of circulating endothelial cell detection in oncology. Drug Discov Today. 2012;17:710–7. doi: 10.1016/j.drudis.2012.01.011. [DOI] [PubMed] [Google Scholar]
- 8.Clarke LA, Shah V, Arrigoni F, Eleftheriou D, Hong Y, Halcox J, Klein N, Brogan PA. Quantitative detection of circulating endothelial cells in vasculitis: Comparison of flow cytometry and immunomagnetic bead extraction. J Thromb Haemost. 2008;6:1025–32. doi: 10.1111/j.1538-7836.2008.02953.x. [DOI] [PubMed] [Google Scholar]
- 9.Marrinucci D, et al. Case study of the morphologic variation of circulating tumor cells. Hum Pathol. 2007;38:514–9. doi: 10.1016/j.humpath.2006.08.027. [DOI] [PubMed] [Google Scholar]
- 10.Marrinucci D, Bethel K, Lazar D, Fisher J, Huynh E, Clark P, Bruce R, Nieva J, Kuhn P. Cytomorphology of circulating colorectal tumor cells: A small case series. J Oncol. 2010;2010:861341. doi: 10.1155/2010/861341. [DOI] [PMC free article] [PubMed] [Google Scholar]
- 11.Marrinucci D, Bethel K, Luttgen M, Bruce RH, Nieva J, Kuhn P. Circulating tumor cells from well-differentiated lung adenocarcinoma retain cytomorphologic features of primary tumor type. Arch Pathol Lab Med. 2009;133:1468–71. doi: 10.1043/1543-2165-133.9.1468. [DOI] [PMC free article] [PubMed] [Google Scholar]
- 12.Yu M, Stott S, Toner M, Maheswaran S, Haber DA. Circulating tumor cells: Approaches to isolation and characterization. J Cell Biol. 2011;192:373–82. doi: 10.1083/jcb.201010021. [DOI] [PMC free article] [PubMed] [Google Scholar]
- 13.Stott SL, et al. Isolation of circulating tumor cells using a microvortex-generating herringbone-chip. Proc Natl Acad Sci U S A. 2010;107:18392–7. doi: 10.1073/pnas.1012539107. [DOI] [PMC free article] [PubMed] [Google Scholar]
- 14.Stott SL, et al. Isolation and characterization of circulating tumor cells from patients with localized and metastatic prostate cancer. Sci Transl Med. 2010;2:25ra3. doi: 10.1126/scitranslmed.3000403. [DOI] [PMC free article] [PubMed] [Google Scholar]
- 15.Bertolini F, Shaked Y, Mancuso P, Kerbel RS. The multifaceted circulating endothelial cell in cancer: Towards marker and target identification. Nat Rev Cancer. 2006;6:835–45. doi: 10.1038/nrc1971. [DOI] [PubMed] [Google Scholar]
- 16.Blann AD, Balakrishnan B, Shantsila E, Ryan P, Lip GY. Endothelial progenitor cells and circulating endothelial cells in early prostate cancer: A comparison with plasma vascular markers. Prostate. 2011;71:1047–53. doi: 10.1002/pros.21319. [DOI] [PubMed] [Google Scholar]
- 17.Helgadottir A, et al. The same sequence variant on 9p21 associates with myocardial infarction, abdominal aortic aneurysm and intracranial aneurysm. Nat Genet. 2008;40:217–24. doi: 10.1038/ng.72. [DOI] [PubMed] [Google Scholar]
- 18.Helgadottir A, et al. A common variant on chromosome 9p21 affects the risk of myocardial infarction. Science. 2007;316:1491–3. doi: 10.1126/science.1142842. [DOI] [PubMed] [Google Scholar]
- 19.Ikram MA, et al. Genomewide association studies of stroke. N Engl J Med. 2009;360:1718–28. doi: 10.1056/NEJMoa0900094. [DOI] [PMC free article] [PubMed] [Google Scholar]
- 20.Matarin M, Brown WM, Singleton A, Hardy JA, Meschia JF. Whole genome analyses suggest ischemic stroke and heart disease share an association with polymorphisms on chromosome 9p21. Stroke. 2008;39:1586–9. doi: 10.1161/STROKEAHA.107.502963. [DOI] [PMC free article] [PubMed] [Google Scholar]
- 21.Rowand JL, Martin G, Doyle GV, Miller MC, Pierce MS, Connelly MC, Rao C, Terstappen LW. Endothelial cells in peripheral blood of healthy subjects and patients with metastatic carcinomas. Cytometry A. 2007;71:105–13. doi: 10.1002/cyto.a.20364. [DOI] [PubMed] [Google Scholar]
- 22.Marrinucci D, et al. Fluid biopsy in patients with metastatic prostate, pancreatic and breast cancers. Phys Biol. 2012;9:016003. doi: 10.1088/1478-3975/9/1/016003. [DOI] [PMC free article] [PubMed] [Google Scholar]
- 23.Damani S, et al. Characterization of circulating endothelial cells in acute myocardial infarction. Sci Transl Med. 2012;4:126ra33. doi: 10.1126/scitranslmed.3003451. [DOI] [PMC free article] [PubMed] [Google Scholar]
- 24.Ando H, Kubin T, Schaper W, Schaper J. Cardiac microvascular endothelial cells express alpha-smooth muscle actin and show low nos iii activity. Am J Physiol. 1999;276:H1755–68. doi: 10.1152/ajpheart.1999.276.5.H1755. [DOI] [PubMed] [Google Scholar]
- 25.Erdbruegger U, Dhaygude A, Haubitz M, Woywodt A. Circulating endothelial cells: Markers and mediators of vascular damage. Current stem cell research & therapy. 2010;5:294–302. doi: 10.2174/157488810793351721. [DOI] [PubMed] [Google Scholar]
- 26.Lampka M, Grabczewska Z, Jendryczka-Mackiewicz E, Holynska-Iwan I, Sukiennik A, Kubica J, Halota W, Tyrakowski T. Circulating endothelial cells in coronary artery disease. Kardiol Pol. 2010;68:1100–5. [PubMed] [Google Scholar]
- 27.Mund JA, Case J. The ontogeny of endothelial progenitor cells through flow cytometry. Curr Opin Hematol. 2011;18:166–70. doi: 10.1097/MOH.0b013e328345a16a. [DOI] [PubMed] [Google Scholar]
- 28.Yoder MC. Endothelial progenitor cell: A blood cell by many other names may serve similar functions. J Mol Med (Berl) 2013;91:285–95. doi: 10.1007/s00109-013-1002-8. [DOI] [PMC free article] [PubMed] [Google Scholar]
- 29.Cho EH, et al. Characterization of circulating tumor cell aggregates identified in patients with epithelial tumors. Phys Biol. 2012;9:016001. doi: 10.1088/1478-3975/9/1/016001. [DOI] [PMC free article] [PubMed] [Google Scholar]
- 30.Aird WC. Endothelial cell heterogeneity. Cold Spring Harb Perspect Med. 2012;2:a006429. doi: 10.1101/cshperspect.a006429. [DOI] [PMC free article] [PubMed] [Google Scholar]


