

Abstract
Green fluorescent protein (GFP) and its derivatives revolutionized the study of proteins. Spinach is a recently reported in vitro evolved RNA mimic of GFP, which as genetically encoded fusions, makes possible live-cell, real-time imaging of biological RNAs, without resorting to large RNA-binding protein-GFP fusions. To elucidate the molecular basis of Spinach fluorescence, we have solved its co-crystal structure bound to its cognate exogenous chromophore, revealing that Spinach activates the small molecule by immobilizing it between a base triple, a G-quadruplex, and an unpaired guanine. Mutational and NMR analyses indicate that the G-quadruplex is essential for Spinach fluorescence, is also present in other fluorogenic RNAs, and may represent a general strategy for RNAs to induce fluorescence of chromophores. The structure has guided the design of a miniaturized 'Baby Spinach', and provides the foundation for structure-driven design and tuning of fluorescent RNAs.
INTRODUCTION
Green fluorescent protein (GFP) has transformed the study of proteins in experiments ranging from single molecules to whole organisms1,2. GFP is uniquely versatile because it can be genetically encoded3, and because its fluorescence properties have been amenable to structure-guided engineering4,5. Only recently has an analogous tool for the study of RNA, the fluorogenic aptamer Spinach6, become available. Spinach is a 97-nucleotide (nt) RNA selected in vitro to bind to DFHBI (Fig. 1a), a small-molecule mimic of the intrinsic chromophore7 of GFP. In isolation, DFHBI is not fluorescent, but exhibits fluorescence comparable to that of GFP upon binding to the RNA8. Although the fluorescence of several other small molecules is enhanced upon RNA binding9,10, those dyes exhibit high background fluorescence and cytotoxicity, limiting biological applications6. In contrast, DFHBI is cell-permeable and non-cytotoxic, and its fluorescence is activated selectively by its cognate RNAs (ref. 6). Spinach has been used to visualize RNAs in live cells using fluorescence microscopy6,8,11, leading to new biological insights8. Also analogous to GFP, Spinach fusions have been used to engineer live-cell fluorescent reporters for small molecules12,13, enabling real-time imaging of the intracellular concentrations of metabolites14–16. To elucidate the mechanism of action of this powerful tool for RNA biology, we have now determined the co-crystal structure of Spinach bound to DFHBI (Supplementary Fig. 1), revealing a chromophore binding site of unprecedented architecture. The structure immediately provides the basis for miniaturization, allowing us to generate 'Baby Spinach', a 51 nt aptamer with fluorescence comparable to that of the parental RNA. Moreover, sequence and nuclear magnetic resonance (NMR) spectroscopy analyses suggest that G-quadruplexes are widespread in other RNA mimics of GFP. Thus, this structural motif may be uniquely suited to construct fluorogenic RNAs.
Figure 1.

Structure of the Spinach-DFHBI complex. (a) Chemical structures6,22 of cis-DFHBI and cis-DBrHBI. (b) Sequence and secondary structure of Spinach-DFHBI. Thin lines denote chain connectivity; Leontis-Westhof symbols38, non-canonical base pairs. Numbering scheme for Spinach1.2 (ref. 8) is used throughout. (c) Cartoon representation, color-coded as in b. Purple spheres represent K+.
RESULTS
Overall structure of Spinach-DFHBI
To reveal the mechanism of fluorescence activation by Spinach, we crystallized a Spinach-DFHBI complex (Supplementary Fig. 1a) and determined its structure by single-wavelength anomalous dispersion (SAD) at a resolution of 2.8 Å (Table 1). The experimental electron density maps (Supplementary Fig. 1b) were of high quality, allowed unambiguous tracing of the RNA chain (Supplementary Fig. 1c), and immediately revealed the location of the chromophore (Supplementary Fig. 1d). Spinach folds into a single coaxial helical stack of contour length ~110 Å (Fig. 1b,c), comprised of three canonical A-form duplexes (paired regions P1, P2 and P3) separated by two irregular junctions (J1-2 and J2-3). SAXS analyses (Supplementary Fig. 1e and Supplementary Table 1) indicate that, in solution, Spinach has a maximum molecular dimension of ~115 Å, in good agreement with our co-crystal structure. Moreover, scattering profiles back-calculated from our co-crystal structure closely approximate the experimental SAXS profiles (Supplementary Fig. 1f). Kratky analysis of Spinach SAXS data free and bound to DFHBI (Supplementary Fig. 1g) suggests that the RNA is largely pre-folded in the absence of chromophore.
Table 1.
Crystallographic statistics
| Crystal I | Crystal II | Crystal III | Crystal IV | |
|---|---|---|---|---|
| Data collection | ||||
| Space group | P212121 | P212121 | P212121 | P212121 |
| Cell dimensions | ||||
| a, b, c (Å) | 39.8, 49.5, 186.3 | 39.9, 49.4, 188.4 | 37.9, 47.2, 173.9 | 53.0, 60.6, 203.4 |
| α, β, γ (°) | 90.0, 90.0, 90.0 | 90.0, 90.0, 90.0 | 90.0, 90.0, 90.0 | 90.0, 90.0, 90.0 |
| Resolution (Å) | 93.1–2.50 (2.60 – 2.50)* | 50.0–2.88 (3.04 – 2.88) | 47.2–3.08 (3.25 – 3.08) | 50.0–4.80 (4.88 – 4.80) |
| Rmerge | 0.075 (0.504) | 0.054 (0.530) | 0.095 (0.260) | 0.113 (0.386) |
| <I>/<σI)> | 19.0 (0.4) | 23.9 (2.8) | 14.8 (2.5) | 21.6 (3.0) |
| Completeness (%) | 99.0 (92.9) | 99.6 (99.5) | 98.0 (97.1) | 89.6 (89.7) |
| Redundancy | 11.9 (6.2) | 5.1 (5.2) | 6.7 (3.9) | 8.0 (5.4) |
| Refinement | ||||
| Resolution (Å) | 50.0 – 2.80 (2.87 – 2.80) | 50.0 – 2.88 (2.96 – 2.88) | ||
| No. reflections | 9193 (658) | 8415 (580) | ||
| Rwork / Rfree | 20.6 (44.7) / 23.9 (51.5) | 21.5 (46.8) / 25.7 (56.2) | ||
| No. atoms | ||||
| RNA | 1932 | 1922 | ||
| Chromophore | 18 | 18 | ||
| Ligand/ion† | 103 | 27 | ||
| Water | 15 | 5 | ||
| B - factors | ||||
| RNA | 90.7 | 117.4 | ||
| Chromophore | 59.6 | 73.4 | ||
| Ligand/ion† | 110.5 | 128.9 | ||
| Water | 71.0 | 99.1 | ||
| r.m.s deviations | ||||
| Bond lengths (A) | 0.007 | 0.006 | ||
| Bond angles (°) | 1.80 | 1.80 | ||
Values in parentheses are for highest-resolution shell. One crystal was used for each data set.
Ligand/ion does not include the chromophore.
A three-tetrad quadruplex17, comprised of two G-quartets18 stacked above a mixed sequence tetrad and stabilized by two K+ ions (MA and MB), forms the core of J2-3 (Fig. 1c and Supplementary Fig. 1b). DFHBI binds this element of complex tertiary structure. The secondary structure of Spinach differs drastically from that originally proposed on the basis of computational prediction6 (Supplementary Fig. 2a), but is fully compatible with all functional Spinach sequences (Supplementary Fig. 2b).
Chromophore-binding site architecture
The Spinach chromophore, which adopts a conformation with coplanar imidazolone and phenyl rings, is sandwiched between G26 and G65 of the top G-quartet, and the Hoogsteen-paired U61 and A64 of the base triple of J2-3 (Fig. 2a,b). DFHBI also interacts extensively on the plane of its rings. First, the imidazolone is hemmed in by the RNA. The unpaired G31 of Spinach hydrogen bonds to the DFHBI carbonyl oxygen and is in van der Waals contact with the bridging benzylidene carbon. On the other flank, the 2'-OH of A64 hydrogen bonds to N3 of DFHBI. Second, the phenolate oxygen of DFHBI hydrogen bonds with the 2'-OH of G26 and a water. Third, the fluorine atoms ortho to the phenolic oxygen each coordinate two waters.
Figure 2.

The Spinach chromophore binding site contains a G-quadruplex. (a) Green mesh depicts a portion of the |Fo|-|Fc| electron density map, calculated prior to addition of DFHBI to the crystallographic model, contoured at 4 s.d. (b) Water and K+ bind the difluorohydroxyphenyl ring of DFHBI. (c) Connectivity and stereochemistry of the Spinach G-quadruplex. Light and dark shades denote anti and syn conformations, respectively. Empty and filled circles denote C3'-endo and C2'-endo puckers, respectively (G68 is O4'-endo). (d) The two G-quartets and cation MA. Green and black dashes represent cation coordination and hydrogen bonds, respectively. (e) The mixed tetrad, lower G-quartet, and cation MB.
Density functional theory calculations on the anionic form of the GFP chromophore show that negative charge concentrates on the phenolate oxygen and on the O5 carbonyl oxygen of the imidazolone19. The interaction of G31 with DFHBI in the Spinach chromophore-binding site (Fig. 2a) is therefore consistent with the well-documented propensity20 of the N1 imine of guanines to bind to anions.
Seven RNA phosphates that lie within a ~8 Å radius surround the phenolic oxygen of DFHBI (Fig. 2b). Such a concentration of negative charge would both attract diffuse counterions and provide specific cation binding sites21. Two K+ ions can be located crystallographically in this part of the complex, where they bridge RNA functional groups, waters, and DFHBI. One of these (MC) appears to occupy a particularly favorable cation binding site, as it is also clearly visible at lower resolution (Supplementary Fig. 3). Coordinated cations likely play an important role in the selectivity6 of Spinach for the anionic form of DFHBI.
Binding of alternate ligands to the chromophore binding site
It was shown previously that Spinach binds to DBrHBI (Fig. 1a) with minimally reduced affinity (KD for DBrHBI and DFHBI are 950 and 530 nM, respectively) and fluoresces 70% as much as the DFHBI complex22. Presumably, the larger atomic radius of bromine is accommodated by slight expansion of the binding pocket and outward displacement of the halogen-bound water molecules. In the in vitro selection experiment from which Spinach was isolated, DFHBI was presented to the RNA pool immobilized through a linker attached to the N1 of the imidazolone. Consistent with this, Spinach does not interact with the methyl group attached to N1 in DFHBI, and the only nucleotide that approaches closely (A69) is part of a loop that projects away from the body of the RNA, which is unlikely to be conformationally restrained in the absence of crystal contacts. Chromophore variants with modifications at N1 bind to Spinach with affinities reduced only modestly, to ~2 μM 22. In contrast, modification of N3 of the imidazolone by addition of a hydroxyl group resulted in a drastic loss of affinity22, and a large reduction in RNA-binding induced fluorescence, which underscores the functional importance of the hydrogen bond donated to it by the 2'-OH of A64 of Spinach.
The Spinach core is a G-quadruplex of novel topology
Although comprised of only three tetrads, the Spinach G-quadruplex is formed by guanine residues distant in sequence, and has an exceptionally intricate architecture with a non-parallel folding topology that is unprecedented17 for RNA G-quadruplexes (Fig. 2c). Half of the guanines are nonconsecutive. As a result, there are five connecting loops of at least one nt each; the longest is a remarkable 34 nt (ref. 23). Two pairs of adjacent guanines in the 5' half of Spinach (G25,G26 and G29,G30) are arranged in parallel and adopt the conventional anti conformation. G65, G68, G70 and G72 form the 3' side of the G-quadruplex; three of these adopt syn and one anti conformations, and each lies above or below a guanine of opposite strand polarity. Of the two K+ ions (Fig. 2d,e) coordinated at the center of the three-tetrad quadruplex, MA is octacoordinate and equidistant from the planes of the two G-quartets, while MB lies between the lower G-quartet and the mixed tetrad and is heptacoordinate. The two K+ ions are separated by 3.8 Å, as previously seen in other G-quadruplexes24,25. The complex topology required for the Spinach G-quadruplex to connect to flanking duplexes on both sides may explain the folding difficulties exhibited by some Spinach sequences8,26,27.
Transitions from G-quadruplex to duplexes
Reminiscent of what was observed previously28 in a 36-nt G-quadruplex RNA that binds to the fragile X mental retardation protein (FMRP), the mixed tetrad of Spinach serves as an adaptor to connect the four-stranded, mixed-polarity G-quadruplex in J2-3 to the canonical antiparallel P2 duplex. Unlike the FMRP-binding RNA, in which the quadruplex abruptly narrows to duplex through its mixed tetrad, Spinach employs additional non-canonical base pairs gradually to taper from quadruplex to P2 duplex (Supplementary Fig. 4). The mean width (diagonal C1' to C1' distance) of the two G-quadruplex tiers is 16.3 Å, and reduces to 13.8 Å for the mixed tetrad. This is followed by the single-hydrogen bond A24•A75 pair, the doubly hydrogen-bonded A23•G76 pair, the canonical G22-C77 pair, and finally the doubly hydrogen-bonded U21•U78 pair. The G-quartets themselves also taper subtly, such that the bases of the lower G-quartet are somewhat crowded and exhibit propeller twist, while those of the top G-quartet are essentially flat (Supplementary Fig. 1b). Also unlike the FMRP-binding RNA, in which the G-quadruplex is located at one of the ends of the molecule, the G-quadruplex of Spinach is connected to antiparallel A-form duplexes on both sides. The base triple atop DFHBI (Fig 1 and Fig 2a) allows transition from the upper side of the quadruplex to the duplex P3.
Comparison to green fluorescent protein
Spinach-bound DFHBI is partially accessible to bulk solvent (Fig. 3a and Supplementary Fig. 3c,d), unlike the deeply buried chromophore of GFP (Fig. 3b)4,5. Both macromolecules hydrogen bond to all available polar atoms of their respective chromophores (Fig. 3c,d). Three differences reflect the different chemical natures of RNA and protein. First, unlike Spinach, which stacks planar heterocycles on each face of DFHBI, GFP relies on van der Waals contacts with aliphatic moieties to conformationally restrain the chromophore, thereby inducing fluorescence1,29. Hence, there is little potential for π-π interactions between the chromophore and the protein. Second, GFP employs buried, ionizable amino acids to interact with its chromophore, both in ground and excited states29. In contrast, Spinach binds DFHBI with formally neutral moieties, supplemented with cations close to the chromophore. Thus, the fluorescence of Spinach can be modulated by soluble cations (Supplementary Fig. 3e,f). Third, waters interact with both chromophores, but those in GFP are in a buried pocket29, while those in Spinach are accessible from the outside (Fig. 3). Therefore, DFHBI and its associated ions and waters can more readily exchange with bulk solvent, consistent with the photophysical properties of Spinach6,26,27.
Figure 3.

Comparison of GFP and Spinach. (a) Molecular surface of Spinach-DFHBI showing the imidazolone ring and the 'gateway' A69. (b) Cartoon and molecular surface of GFP. The chromophore is green. (c) Interior molecular surface surrounding the Spinach chromophore in gray. (d) Surface of the chromophore binding pocket of enhanced GFP (PDB: 4EUL; ref. 39) in gray.
Comparison of the photophysics of Spinach and GFP
The fluorescence intensity and spectra of Spinach-DFHBI and GFP are comparable6, but other aspects of their photophysics are not. Spinach is swiftly photobleached, but recovers rapidly in the presence of excess DFHBI (ref. 6,26,27). GFP does not photobleach as readily, but once bleached does not recover27. Previous studies6,26,27 suggested that cis-trans photoisomerization of the Spinach-bound DFHBI accompanies rapid fluorescence loss upon illumination, and that the recovery of Spinach fluorescence results from ejection of the photoisomerized chromophore, due to the low affinity of Spinach for trans-DFHBI, followed by rapid rebinding to excess cis-DFHBI present in solution. Our co-crystal structure indicates that the trans isomer would sterically clash and also form fewer hydrogen bonds with the chromophore binding site of Spinach (Supplementary Figs. 5a–c). It is likely that in solution, residue A69 (Figs. 1c and 2a) would be mobile, functioning as a portal allowing easy egress of quenched trans-DFHBI from, and ingress of cis-DFHBI to the pre-organized (Supplementary Fig. 1g) RNA. Moreover, easy access by external water (and dissolved oxygen) to the bound DFHBI (Fig. 3a and Supplementary Fig. 3c,d) may also facilitate permanent photochemical destruction of the RNA-bound chromophore.
Miniaturization and fluorescent tuning of Spinach
Mutagenesis corroborates the functional importance of the observed DFHBI-Spinach interactions (Fig. 4a). Disruption of the G-quartets (G29C, G30C) reduces fluorescence to background, underscoring their critical role in chromophore binding and fluorescence activation. Mutation of the base triple atop DFHBI (U32A, A64U) reduces fluorescence by 90%, while also inducing a 45 nm blueshift of the excitation maximum. This suggests DFHBI fluorescence is tightly coupled to the electronic properties of the nucleobases sandwiching it, and represents a promising avenue for spectral tuning. The critical importance of the interaction between the Watson-Crick face of G31 and DFHBI is demonstrated by the G31C mutation, which abrogates fluorescence.
Figure 4.
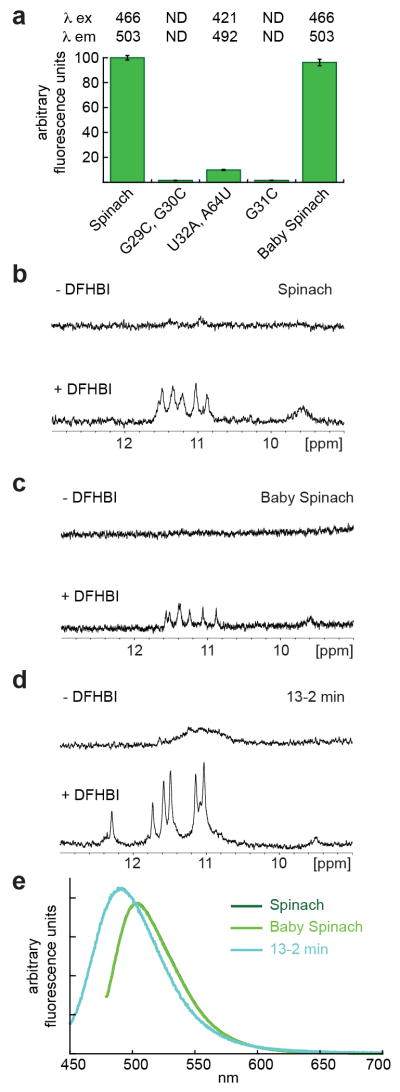
G-quadruplexes in Spinach and other fluorogenic RNAs. (a) Fluorescence of mutant Spinach RNAs in excess DFHBI, normalized to Spinach fluorescence. Error bars represent standard errors of the mean. N.D., not detected. (b-d) Imino region of the proton NMR spectra of Spinach, Baby Spinach and '13-2 min' RNAs, in the presence and absence of DFHBI. (e) Fluorescence emission spectra of Spinach, Baby Spinach, and 13–2 min bound to DFHBI, normalized by peak absorbance. The spectra of Spinach and Baby Spinach superimpose exactly.
Our co-crystal structure indicates that interactions between Spinach and DFHBI are restricted to J2-3. This prompted us to generate the miniaturized Baby Spinach consisting solely of J2-3 flanked by A-form duplexes (Supplementary Fig. 5d). In solution, G-quadruplexes exhibit imino resonances between 10.5–12.5 ppm that do not readily exchange with bulk solvent30. NMR analyses demonstrate that both Spinach and Baby Spinach, when in complex with DFHBI, exhibit these resonances (Fig. 4b,c). Baby Spinach retains ~95% of Spinach fluorescence intensity (Fig. 4a). Thus, J2-3 alone is responsible for essentially all the fluorogenic activity of the RNA. The compact size of Baby Spinach, only half as large as the parental RNA, is likely to further reduce6 the possibility of live-cell artifacts when fused to biological RNAs.
G-quadruplexes in RNA mimics of GFP
Although mixed sequence base quadruples are frequently observed31,32,33,34,35, G-quadruplexes are not highly represented among structurally characterized RNAs. The discovery of a G- quadruplex in the core of Spinach is unexpected because its sequence does not contain any canonical G-quadruplex sequence motifs36 nor is unusually G-rich. Our analysis suggests that a G-quadruplex is well suited for an RNA that induces fluorescence of a chromophore like DFHBI by simultaneously restricting it to a planar conformation and also hydrogen bonding to functional groups on its edges. The symmetry of a G-quartet18, and its stabilization by an axially coordinated cation17,37, leads to a stable, flat and hydrophobic surface. In contrast, nucleobases forming conventional Watson-Crick base pairs or base triples are often not coplanar, exhibiting a degree of propeller twist. Equally important, the surface of a G-quartet is large enough to accommodate not only DFHBI, but also additional RNA moieties on the same plane, poised to hydrogen bond to the chromophore. Thus, G31 and DFHBI, which form functionally critical hydrogen bonds, are kept strictly coplanar (Fig. 2a).
Since Spinach was selected from 5 x 10¹³ random sequence RNAs based on function6, its architecture may indicate that G-quadruplexes represent an optimal strategy for RNAs to induce fluorescence from a small-molecule chromophore. Reappraisal of the sequences of other RNAs selected to bind GFP-derived chromophores6 shows that guanine tracts are unusually common. We examined by NMR '13-2 min', a particularly guanine-enriched fluorogenic RNA (ref. 6). We found that it too exhibits resonances characteristic of G-quadruplexes (Fig. 4d), although its NMR and fluorescence (Fig. 4e) spectra imply a different structure from that of Spinach or Baby Spinach. All three RNAs examined have imino protons that are not well protected from exchange with solvent in the absence of the chromophore, suggesting stabilization or occlusion of their chromophore binding sites by DFHBI binding.
DISCUSSION
We have determined the first structure of an RNA that can induce fluorescence of a GFP-like chromophore, revealing that the DFHBI binding site contains a G-quadruplex of unprecedented topology. Although Spinach is the first known example of a fluorogenic RNA with a G-quadruplex in its chromophore binding site, our analysis suggests that this nucleic acid structural motif is generally well suited to activate the fluorescence of bound small molecules. The structure of Spinach demonstrates how a single polynucleotide chain can fold such that it flanks a four-stranded G-quadruplex on both sides with canonical antiparallel A-form duplexes, and suggests how G-quadruplexes may be inserted into other intricately folded RNAs without interrupting helical stacking. The Spinach structure has already allowed dramatic minimization of Spinach without changes in fluorescence properties, yielding Baby Spinach. As demonstrated by the spectral changes induced by mutations and cation replacement (Fig. 4a and Supplementary Fig. 3e,f), the fluorescence properties of Spinach can be readily tuned, and our co-crystal structure now opens the way for structure-guided molecular engineering of the next generation of fluorogenic tools for RNA biology.
ONLINE METHODS
DFHBI and DBrHBI synthesis
The syntheses of (Z)-4-(3,5-difluoro-4-hydroxybenzylidene)-1,2-dimethyl-1H-imidazol-5(4H)-one and (Z)-4-(3,5-dibromo-4-hydroxybenzylidene)-1,2-dimethyl-1H-imidazol-5(4H)-one (DFHBI and DBrHBI, respectively, Fig. 1a) have been described6,22.
Design of crystallization constructs
Crystallization constructs comprised of two strands ('Split Spinach') were prepared by deleting a stem-loop that has been shown to be functionally dispensable, since it can be deleted6,40 or replaced with aptamers to various metabolites or proteins without affecting fluorescence14,15,41. Bound to DFHBI, Split Spinach constructs (Supplementary Table 2) exhibit the same fluorescence as the parental single-chain RNA (Supplementary Fig. 1a).
RNA preparation
The thirteen RNA constructs used in this study are listed in Supplementary Table 2. RNAs 1-12 were prepared by in vitro transcription from PCR templates, essentially as described42. RNA 13 was purchased from Dharmacon. RNAs were purified by electrophoresis on 8-12% polyacrylamide, 1x TBE, 8 M urea gels (29:1 acrylamide:bisacrylamide), electroeluted, desalted by ultrafiltration using Amicon centrifugal concentrators (Millipore), and stored at 4°C. RNA for crystallization or SAXS was washed once with 1 M KCl prior to desalting.
Crystallization and diffraction data collection
An equimolar mixture of two RNA strands (Crystals I, II, IV: RNAs 1 and 2; Crystal III: RNAs 2 and 13), corresponding to one Split Spinach complex, was heated to 95°C for 2 min in HEPES-KOH pH 7.3 and KCl and cooled on ice for 2 min. BaCl2 or MgCl2 was added to 5 mM, DFHBI or DBrHBI in DMSO was added to 250 μM, and DEPC-treated water was added to adjust the final concentration of RNA, HEPES, and KCl. The solution was heated to 65°C for 5 min and cooled to 25°C at a rate of 0.1°C per second. Final concentrations were 30 mM HEPES-KOH pH 7.3, 10 mM KCl, 2.5% (v/v) DMSO, and 200 μM each RNA (Crystals I and II) or 250 μM each RNA (Crystal III) or 146 μM each RNA (Crystal IV). For crystallization by the hanging-drop vapor diffusion method, the RNA-chromophore complex was mixed 1:1 with a reservoir solution consisting of 0.1 M succinate-KOH pH 7, NaCl (Crystal I: 0.25 M; Crystals II, III, IV: 0.5 M), PEG3350 (Crystal IV: 18%; Crystals I, II, III: 20%) MgCl2 (Crystals II, III, IV: 5 mM) or BaCl2 (Crystal I: 5 mM), and sucrose (Crystal I: 15%; Crystal II: 10%; Crystal III: 6%). Crystals grew in 1–8 weeks to maximum dimensions of 400 x 400 x 400 μm3, and fluoresced intensely above background when illuminated with ultraviolet light (not shown). Crystals I, II, and III were vitrified by mounting in nylon loops and plunging directly into liquid nitrogen. Crystal IV was briefly washed with mother liquor supplemented with 10% (v/v) ethylene glycol before mounting and vitrification. Crystals I, II, and III contain one Spinach-DFHBI complex per crystallographic asymmetric unit (a.u.); crystal IV contains two Spinach-DBrHBI complexes per a.u. Single-wavelength anomalous dispersion (SAD) data from crystal I were collected at 100K using 1.5498 Å X-radiation at beamline 5.0.2 of the Advanced Light Source (ALS). Crystal I data were initially integrated, scaled and merged with HKL2000 (ref. 43) and later reintegrated using iMosflm (ref. 44,45) and rescaled and remerged with AIMLESS (ref. 46). The space group assignment was confirmed using POINTLESS (ref. 47). Non-anomalous and anomalous data from Crystals II and III, respectively, were collected at 100 K using 0.9792 Å and 1.9074 Å X-radiation, respectively, at beamline 24-ID-C of the Advanced Photon Source (APS). Data from crystals II and III were indexed, integrated, and scaled using the NE-CAT RAPD pipeline, which uses XDS (ref. 48) and SCALA (ref. 47). Data from crystal IV were collected at 100K using 0.9063 Å X-radiation at beamline 11-1 of the Stanford Synchrotron Radiation Lightsource (SSRL) and processed with HKL2000 (ref. 43). Data collection statistics are summarized in Table 1.
Structure determination and refinement
The anomalous signal for crystal I was weak (<|ΔF|/σ(ΔF)> = 1.14). After data preparation with SHELXC (ref. 49), SHELXD (ref. 50) was run with resolution cut-offs ranging from 3.3 Å to 4.7 Å, searching for 4 to 24 anomalous scatters as the substructure. Each run comprised a million tries. The best substructure was obtained with default parameters, a resolution cut-off of 3.6 Å, and searching for 24 marker atoms. SHELXE (ref. 49) was run for 120 cycles of density modification, keeping seven of the marker atoms as the heavy atom substructure. The resulting electron density map (Supplementary Fig. 1b) allowed initial tracing of the RNA chain using COOT (ref. 51). Iterative rounds of manual rebuilding were interspersed with rigid-body, simulated-annealing, and individual isotropic B-factor refinement against crystal I data using CNS (ref. 52), yielding a near-complete model. Further rounds of manual rebuilding were interspersed with maximum likelihood restrained refinement using SAD data with Refmac5 (ref. 53). TLS refinement was applied in the last rounds prior to placement of DFHBI and nearby ions. ERRASER (ref. 54) was also employed prior to addition of DFHBI to improve RNA geometry. Ba2+ and K+ ions were identified by inspection of anomalous difference Fourier syntheses. The heavy atom substructure of Crystal I employed for SAD phasing consisted of seven Ba2+ ions, but all but one were later replaced with K+, on the basis of coordination geometry, B-factors, and magnitude of the imaginary component of the anomalous scattering factor. The sequence register was confirmed by inspection of an anomalous difference Fourier synthesis of Crystal III, which contained a site-specific uracil to 5-iodouracil substitution of nucleotide 18 (Supplementary Fig. 1c). The orientation of the bound chromophore was corroborated by inspection of an anomalous difference Fourier synthesis of Crystal IV, which contained DBrHBI in place of DFHBI (Supplementary Fig. 1d). The Ba2+ co-crystal structure (Crystal I) consists of 91 RNA residues, one DFHBI molecule, 10 K+ and 1 Ba2+ ions, and 4 sucrose and 15 water molecules, and was refined at 2.8 Å. The structure of Crystal II was solved by molecular replacement with PHASER (ref. 55) using a partial model built with Crystal I data as a search model (TFZ = 10.0, LLG = 1993). Refinement was carried out as above, but with non-anomalous Crystal II structure factor amplitudes. This co-crystal structure consists of 91 RNA residues, one DFHBI molecule, 3 K+ and 1 Mg2+ ions, and 5 water molecules, and was refined at 2.9 Å. The anomalous difference Fourier synthesis for Crystal III amplitudes was calculated using phases derived from a molecular replacement55 solution obtained using a partial model of Crystal I as a search model (TFZ = 14.2, LLG = 439), and following a single round of refinement56. Phases for the anomalous difference Fourier synthesis for Crystal IV amplitudes were generated from a molecular replacement55 solution obtained using two copies of a partial model of Crystal I as a search model (TFZ = 13.2, LLG = 185), and a single round of refinement56. Refinement statistics are summarized in Table 1. Except where noted, structural figures were prepared using PyMol (Schrödinger), and the refined Crystal I structure. The molecular surface of the chromophore binding pockets of GFP and Spinach (Fig. 3c,d) were generated using HOLLOW (ref. 57).
Fluorescence spectroscopy
RNA corresponding to one Spinach complex (Spinach: RNAs 3 and 4; Baby Spinach: RNA 9; G29C, G30C: RNA 5; U32A, A64U: RNA 7; G31C: RNA 8; ion experiments: RNAs 3 and 4) was heated to 95°C for 2 min in Tris-HCl pH 7.5 and KCl (if present) and cooled on ice for 2 min. BaCl2, MgCl2 or LiCl (if present) was added, DFHBI was added to 10 μM, and DEPC-treated water was added to adjust final concentration of RNA, HEPES, and KCl. The solution was heated to 65°C for 5 min and cooled to 25°C over 15 min. Final concentration for Spinach and Spinach mutants were 40 mM Tris-HCl pH 7.5, 125 mM KCl, 5 mM MgCl2, 1 μM RNA and 10 μM DFHBI. Final concentrations for cation experiments were 40 mM Tris-HCl pH 7.5, 1 μM RNA, 10 μM DFHBI, and cation concentrations as listed in Supplementary Fig. 3e,f. Ionic strength was kept consistent across all conditions. Fluorescence spectra were collected in technical triplicate using a PTI fluorimeter at 293 K. Fluorescence was normalized to that of 1 μM Spinach (RNAs 3 and 4) in 40 mM Tris-HCl pH 7.5, 125 mM KCl, 5 mM MgCl2, and 10 μM DFHBI. When spectra of multiple samples are compared, they have been normalized to peak absorbance.
SAXS
RNA 12 in 1x SAXS buffer (50 mM HEPES-KOH pH 7.3, 50 mM KCl, 5 mM MgCl2, 2.5% DMSO) was purified by size-exclusion chromatography (Superdex 200, GE Life Sciences). RNA samples were then exhaustively exchanged into buffer (1x SAXS or 1x SAXS supplemented with 100 μM DFHBI) using Amicon centrifugal microconcentrators (Millipore). RNA samples were diluted to a final concentration of 0.5 g/L. SAXS experiments were performed at beamline 12-ID-C of the APS. Scattering data were reduced to a one-dimensional scattering plot using IGOR PRO (WaveMetrics). Rg values were calculated from a Guinier plot in the q-range such that qmax x Rg ~ 1.3. PRIMUS (ref. 58) was used to generate the pair probability distributions [P(r)]. Kratky and P(r) plots are presented normalized to I0. CRYSOL (ref. 59) was used to calculate the expected scattering profile for the refined Crystal I structure. SAXS analyses are summarized in Supplementary Table 1.
NMR
RNA corresponding to an aptamaer complex (RNAs 3 and 4; RNA 9; RNA 10) was heated to 95°C for 2 min in HEPES-d18-KOH pH ~7–8 and KCl and cooled on ice for 2 min. MgCl2 was added to 5 mM, DFHBI in DMSO-d6 was added to 1.2× final RNA concentration, and DEPC-treated water was added to adjust final concentration of RNA, HEPES, and KCl. The solution was heated to 65°C for 5 min and cooled to 25°C over 15 min. Final concentrations were 30 mM HEPES-d18-KOH pH ~7–8, 100 mM KCl, and 400 – 500 μM RNA. The RNA solution was flash frozen in liquid nitrogen and lyophilized to dryness. Immediately prior to spectrum acquisition, each RNA sample was dissolved in 500 μL of 2.5 % DMSO-d6 in D2O. One-dimensional proton spectra were collected on a Bruker Avance 600 MHz spectrometer equipped with a triple resonance probe and triple axis gradient coils. All NMR spectra were acquired at 298 K with 1024 scans and 16384 complex points. The recycle delay was 1.5 s and the spectral width was 12019 Hz.
Supplementary Material
Acknowledgments
We thank the staff at beamlines 5.0.2 of the ALS, 24-ID-C of APS, and 11-1 of the SSRL for crystallographic data collection, G. Piszczek (U.S. National Heart, Lung and Blood Institute, NHLBI) for fluorescence spectroscopy, X. Fang (U.S. National Cancer Institute) and the staff of APS 12-ID-C for SAXS, D.-Y. Lee (NHLBI) for mass spectrometry, X. Wu (NHLBI) for fluorescence microscopy, N. Tjandra for NMR, J. Grimmett and T. Darling for MRC Laboratory of Molecular Biology computer cluster support, respectively, and N. Baird, P. Emsley, C. Jones, F. Long, G. Murshudov, R. Nicholls, K. Perry, M. Lau, A. Roll-Mecak, M. Warner, K. Weeks and J. Zhang for discussions. This work was partly conducted at the ALS on the BCSB beamlines, the APS on the 24-ID-C (NE-CAT) and 12-ID-C beamlines, and at SSRL, which are all supported by the U.S. National Institutes of Health (NIH, GM103403 and GM103393 to APS and SSRL, respectively). Use of ALS, APS and SSRL was supported by the U.S. Department of Energy. This work was supported in part by the NIH (R01 NS010249 to S.R.J. and F32 GM106683 to R.L.S.), the European Union FP7 Marie-Curie IEF program (A.T), the NIH-Oxford-Cambridge Research Scholars Program (K.D.W. and M.C.C.), and the intramural program of the NHLBI, NIH.
Footnotes
AUTHOR CONTRIBUTIONS
K.D.W. and A.R.F. designed experiments, W.S., R.L.S. and S.R.J. synthesized chromophores and some aptamers, K.D.W. carried out biochemistry, crystallization and SAXS, K.D.W. and A.R.F. collected diffraction data, K.D.W., A.T. and A.R.F. reduced data, A.T. solved the heavy atom substructure and calculated initial phases, K.D.W. built the crystallographic model and K.D.W. and A.T. refined it, M.C.C. performed NMR, A.R.F. and K.D.W., with help from M.C.C., A.T. and S.R.J., wrote the manuscript, and all authors reviewed it.
COMPETING FINANCIAL INTERESTS
S.R.J. and R.L.S. are authors of a patent application (provisional patent USPTO# 61/874,819) related to RNA-fluorophore complexes described in this paper. The other authors declare no competing financial interests.
ACCESSION CODES
Atomic coordinates and structure factor amplitudes for the Spinach-DFHBI complex in the presence of K+ and Ba2+ or K+ and Mg2+ have been deposited with the Protein Data Bank under accession codes 4TS0 and 4TS2, respectively.
REFERNCES
- 1.Tsien RY. The green fluorescent protein. Annu Rev Biochem. 1998;67:509–544. doi: 10.1146/annurev.biochem.67.1.509. [DOI] [PubMed] [Google Scholar]
- 2.Day RN, Davidson MW, editors. The fluorescent protein revolution. CRC Press; Boca Raton, FL: 2014. [Google Scholar]
- 3.Chalfie M, Tu Y, Euskirchen G, Ward W, Prasher D. Green fluorescent protein as a marker for gene expression. Science. 1994;263:802–805. doi: 10.1126/science.8303295. [DOI] [PubMed] [Google Scholar]
- 4.Ormö M, et al. Crystal structure of the Aequorea victoria green fluorescent protein. Science. 1996;273:1392–1395. doi: 10.1126/science.273.5280.1392. [DOI] [PubMed] [Google Scholar]
- 5.Yang F, Moss LG, Phillips GN. The molecular structure of green fluorescent protein. Nature Biotech. 1996;14:1246–1251. doi: 10.1038/nbt1096-1246. [DOI] [PubMed] [Google Scholar]
- 6.Paige JS, Wu KY, Jaffrey SR. RNA mimics of green fluorescent protein. Science. 2011;333:642–646. doi: 10.1126/science.1207339. [DOI] [PMC free article] [PubMed] [Google Scholar]
- 7.Shimomura O. Structure of the chromophore of Aequorea green fluorescent protein. FEBS letters. 1979;104:220–222. [Google Scholar]
- 8.Strack RL, Disney MD, Jaffrey SR. A superfolding Spinach2 reveals the dynamic nature of trinucleotide repeat-containing RNA. Nature Methods. 2013;10:1219–1224. doi: 10.1038/nmeth.2701. [DOI] [PMC free article] [PubMed] [Google Scholar]
- 9.Babendure JR, Adams SR, Tsien RY. Aptamers switch on fluorescence of triphenylmethane dyes. J Am Chem Soc. 2003;125:14716–14717. doi: 10.1021/ja037994o. [DOI] [PubMed] [Google Scholar]
- 10.Constantin TP, et al. Synthesis of new fluorogenic cyanine dyes and incorporation into RNA fluoromodules. Organic Lett. 2008;10:1561–1564. doi: 10.1021/ol702920e. [DOI] [PubMed] [Google Scholar]
- 11.Pothoulakis G, Ceroni F, Reeve B, Ellis T. The Spinach RNA aptamer as a characterization tool for synthetic biology. ACS Synthetic Biol. 2014;3:182–187. doi: 10.1021/sb400089c. [DOI] [PubMed] [Google Scholar]
- 12.Strack RL, Song W, Jaffrey SR. Using Spinach-based sensors for fluorescence imaging of intracellular metabolites and proteins in living bacteria. Nature Protocols. 2013;9:146–155. doi: 10.1038/nprot.2014.001. [DOI] [PMC free article] [PubMed] [Google Scholar]
- 13.Strack RL, Jaffrey SR. New approaches for sensing metabolites and proteins in live cells using RNA. Current Op Chem Biol. 2013;17:651–655. doi: 10.1016/j.cbpa.2013.05.014. [DOI] [PMC free article] [PubMed] [Google Scholar]
- 14.Paige JS, Nguyen-Duc T, Song W, Jaffrey SR. Fluorescence imaging of cellular metabolites with RNA. Science. 2012;335:1194–1194. doi: 10.1126/science.1218298. [DOI] [PMC free article] [PubMed] [Google Scholar]
- 15.Kellenberger CA, Wilson SC, Sales-Lee J, Hammond MC. RNA-Based fluorescent biosensors for live cell imaging of second messengers cyclic di-GMP and dyclic AMP-GMP. J Am Chem Soc. 2013;135:4906–4909. doi: 10.1021/ja311960g. [DOI] [PMC free article] [PubMed] [Google Scholar]
- 16.Nakayama S, Luo Y, Zhou J, Dayie TK, Sintim HO. Nanomolar fluorescent detection of c-di-GMP using a modular aptamer strategy. Chemical Comm. 2012;48:9059–9061. doi: 10.1039/c2cc34379g. [DOI] [PubMed] [Google Scholar]
- 17.Neidle S, Balasubramanian S. Quadruplex nucleic acids. RSC Pub; Cambridge, UK: 2006. [Google Scholar]
- 18.Gellert M, Lipsett MN, Davies DR. Helix formation by guanylic acid. Proc Natl Acad Sci U S A. 1962;48:2013–2018. doi: 10.1073/pnas.48.12.2013. [DOI] [PMC free article] [PubMed] [Google Scholar]
- 19.Paul BK, Guchhait N. Looking at the green fluorescent protein (GFP) chromophore from a different perspective: a computational insight. Spectrochimica Acta A. 2013;103:295–303. doi: 10.1016/j.saa.2012.11.007. [DOI] [PubMed] [Google Scholar]
- 20.Auffinger P, Bielecki L, Westhof E. Anion binding to nucleic acids. Structure. 2004;12:379–388. doi: 10.1016/j.str.2004.02.015. [DOI] [PubMed] [Google Scholar]
- 21.Draper DE. A guide to ions and RNA structure. RNA. 2004;10:335–343. doi: 10.1261/rna.5205404. [DOI] [PMC free article] [PubMed] [Google Scholar]
- 22.Song W, Strack RL, Svensen N, Jaffrey SR. Plug-and-play fluorophores extend the spectral properties of spinach. J Am Chem Soc. 2014;136:1198–1201. doi: 10.1021/ja410819x. [DOI] [PMC free article] [PubMed] [Google Scholar]
- 23.Guedin A, Gros J, Alberti P, Mergny JL. How long is too long? Effects of loop size on G-quadruplex stability. Nucleic Acids Res. 2010;38:7858–7868. doi: 10.1093/nar/gkq639. [DOI] [PMC free article] [PubMed] [Google Scholar]
- 24.Hud NV. Nucleic acid-metal ion interactions. RSC Pub; Cambridge, UK: 2009. [Google Scholar]
- 25.Collie GW, Haider SM, Neidle S, Parkinson GN. A crystallographic and modelling study of a human telomeric RNA (TERRA) quadruplex. Nucleic Acids Res. 2010;38:5569–5580. doi: 10.1093/nar/gkq259. [DOI] [PMC free article] [PubMed] [Google Scholar]
- 26.Wang PC, et al. Photochemical properties of Spinach and its use in selective imaging. Chemical Sci. 2013;4:2865–2873. [Google Scholar]
- 27.Han KY, Leslie BJ, Fei JY, Zhang JC, Ha T. Understanding the photophysics of the Spinach-DFHBI RNA aptamer-fluorogen complex to improve live-cell RNA imaging. J Am Chem Soc. 2013;135:19033–19038. doi: 10.1021/ja411060p. [DOI] [PMC free article] [PubMed] [Google Scholar]
- 28.Phan AT, et al. Strucuture-function studies of FMRP RGG peptide recognition of an RNA duplex-quadruplex junction. Nat Struct Mol Biol. 2011;18:796–804. doi: 10.1038/nsmb.2064. [DOI] [PMC free article] [PubMed] [Google Scholar]
- 29.Remington SJ. Green fluorescent protein: a perspective. Protein Sci. 2011;20:1509–1519. doi: 10.1002/pro.684. [DOI] [PMC free article] [PubMed] [Google Scholar]
- 30.Smith FW, Feigon J. Quadruplex Structure of Oxytricha Telomeric DNA Oligonucleotides. Nature. 1992;356:164–168. doi: 10.1038/356164a0. [DOI] [PubMed] [Google Scholar]
- 31.Batey RT, Gilbert SD, Montange RK. Structure of a natural guanine-responsive riboswitch complexed with the metabolite hypoxanthine. Nature. 2004;432:411–415. doi: 10.1038/nature03037. [DOI] [PubMed] [Google Scholar]
- 32.Montange RK, Batey RT. Structure of the S-denosylmethionine riboswitch regulatory mRNA element. Nature. 2006;441:1172–1175. doi: 10.1038/nature04819. [DOI] [PubMed] [Google Scholar]
- 33.Serganov A, Huang L, Patel DJ. Structural insights into amino acid binding and gene control by a lysine riboswitch. Nature. 2008;455:1263–7. doi: 10.1038/nature07326. [DOI] [PMC free article] [PubMed] [Google Scholar]
- 34.Klein D, Edwards T, Ferré-D'Amaré A. Cocrystal structure of a class I preQ1 riboswitch reveals a pseudoknot recognizing an essential hypermodified nucleobase. Nat Struct Mol Biol. 2009;16:343–344. doi: 10.1038/nsmb.1563. [DOI] [PMC free article] [PubMed] [Google Scholar]
- 35.Flinders J, et al. Recognition of planar and nonplanar ligands in the malachite green-RNA aptamer complex. Chembiochem. 2004;5:62–72. doi: 10.1002/cbic.200300701. [DOI] [PubMed] [Google Scholar]
- 36.Huppert JL, Balasubramanian S. Prevalence of quadruplexes in the human genome. Nucleic Acids Res. 2005;33:2908–2916. doi: 10.1093/nar/gki609. [DOI] [PMC free article] [PubMed] [Google Scholar]
- 37.Sigel A, Sigel H, Sigel RKO. Structural and Catalytic Roles of Metal Ions in RNA. RSC Pub; Cambridge, UK: 2011. [PubMed] [Google Scholar]
- 38.Leontis NB, Westhof E. Geometric nomenclature and classification of RNA base pairs. RNA. 2001;7:499–512. doi: 10.1017/s1355838201002515. [DOI] [PMC free article] [PubMed] [Google Scholar]
- 39.Arpino J, Rizkallah P, Jones D. Crystal structure of enhanced green fluorescent protein to 1.35 Å resolution reveals alternative conformations for Glu222. PLoS One. 2012;7:e47132. doi: 10.1371/journal.pone.0047132. [DOI] [PMC free article] [PubMed] [Google Scholar]
- 40.Rogers TA, Andrews GE, Jaeger L, Grabow WW. ACS Synthetic Biology. 2014. Fluorescent monitoring of RNA assembly and processing using split-spinach aptamer. Published online April 29. [DOI] [PubMed] [Google Scholar]
- 41.Song W, Strack RL, Jaffrey SR. Imaging bacterial protein expression using genetically encoded RNA sensors. Nature Methods. 2013;10:873–875. doi: 10.1038/nmeth.2568. [DOI] [PMC free article] [PubMed] [Google Scholar]
- 42.Xiao H, Edwards TE, Ferré-D'Amaré AR. Structural basis for specific, high-affinity tetracycline binding by an in vitro evolved aptamer and artificial riboswitch. Chem Biol. 2008;15:1125–1137. doi: 10.1016/j.chembiol.2008.09.004. [DOI] [PMC free article] [PubMed] [Google Scholar]
- 43.Otwinowski Z, Minor W. Processing of diffraction data collected in oscillation mode. Meth Enzymol. 1997;276:307–326. doi: 10.1016/S0076-6879(97)76066-X. [DOI] [PubMed] [Google Scholar]
- 44.Leslie AGW, Powell HR. Evolving Methods for Macromolecular Crystallography. Springer; Dordrecht, The Netherlands: 2007. Processing diffraction data with mosflm; pp. 41–51. [Google Scholar]
- 45.Battye TGG, Kontogiannis L, Johnson O, Powell HR, Leslie AGW. iMOSFLM: a new graphical interface for diffraction-image processing with MOSFLM. Acta Crystallogr D. 2011;67:271–281. doi: 10.1107/S0907444910048675. [DOI] [PMC free article] [PubMed] [Google Scholar]
- 46.Evans PR, Murshudov GN. How good are my data and what is the resolution? Acta Crystallogr D. 2013;69:1204–1214. doi: 10.1107/S0907444913000061. [DOI] [PMC free article] [PubMed] [Google Scholar]
- 47.Evans P. Scaling and assessment of data quality. Acta Crystallogr D. 2006;62:72–82. doi: 10.1107/S0907444905036693. [DOI] [PubMed] [Google Scholar]
- 48.Kabsch W. XDS. Acta Crystallogr D. 2010;66:125–132. doi: 10.1107/S0907444909047337. [DOI] [PMC free article] [PubMed] [Google Scholar]
- 49.Sheldrick GM. A short history of SHELX. Acta Crystallogr A. 2008;64:112–122. doi: 10.1107/S0108767307043930. [DOI] [PubMed] [Google Scholar]
- 50.Sheldrick GM, et al. Ab initio phasing. In: Arnold E, Himmel DM, Rossmann MG, editors. International Tables for Crystallography. F. IUCr and Kluwer Academic Publishers; Dordrecht, The Netherlands: 2011. pp. 413–432. [Google Scholar]
- 51.Emsley P, Lohkamp B, Scott WG, Cowtan K. Features and development of Coot. Acta Crystallogr D. 2010;66:486–501. doi: 10.1107/S0907444910007493. [DOI] [PMC free article] [PubMed] [Google Scholar]
- 52.Brünger AT, et al. Crystallography and NMR system: a new software system for macromolecular structure determination. Acta Crystallogr D. 1998;54:905–921. doi: 10.1107/s0907444998003254. [DOI] [PubMed] [Google Scholar]
- 53.Murshudov GN, Vagin AA, Dodson EJ. Refinement of macromolecular structures by the maximum-likelihood method. Acta Crystallogr D. 1997;53:240–255. doi: 10.1107/S0907444996012255. [DOI] [PubMed] [Google Scholar]
- 54.Chou FC, Sripakdeevong P, Dibrov SM, Hermann T, Das R. Correcting pervasive errors in RNA crystallography through enumerative structure prediction. Nature Methods. 2013;10:74–U105. doi: 10.1038/nmeth.2262. [DOI] [PMC free article] [PubMed] [Google Scholar]
- 55.McCoy A, et al. Phaser crystallographic software. J Appl Cryst. 2007;40:658–674. doi: 10.1107/S0021889807021206. [DOI] [PMC free article] [PubMed] [Google Scholar]
- 56.Afonine PV, et al. Towards automated crystallographic structure refinement with phenix.refine. Acta Crystallogr D. 2012;68:352–367. doi: 10.1107/S0907444912001308. [DOI] [PMC free article] [PubMed] [Google Scholar]
- 57.Ho BK, Gruswitz F. HOLLOW: generating accurate representations of channel and interior surfaces in molecular structures. Bmc Structural Biology. 2008;8:49. doi: 10.1186/1472-6807-8-49. [DOI] [PMC free article] [PubMed] [Google Scholar]
- 58.Konarev PV, Volkov VV, Sokolova AV, Koch MHJ, Svergun DI. PRIMUS: a Windows PC-based system for small-angle scattering data analysis. J Appl Cryst. 2003;36:1277–1282. [Google Scholar]
- 59.Svergun DI, Bargerato C, Koch MHJ. CRYSOL - a program to evaluate X-ray solution scattering of biological macromolecules from atomic coordinates. J Appl Cryst. 1995;28 :768–773. [Google Scholar]
Associated Data
This section collects any data citations, data availability statements, or supplementary materials included in this article.