Abstract
The structural characteristics of the HyperCel family of cellulosic ion-exchange materials (Pall Corporation) were assessed using methods to gauge the pore dimensions and the effect of ionic strength on intraparticle architecture. Inverse size exclusion chromatography (ISEC) was applied to the S and STAR AX HyperCel derivatives. The theoretical analysis yielded an average pore radius for each material of about 5 nm, with a particularly narrow pore-size distribution. Electron microscopy techniques were used to visualize the particle structure and relate it to macroscopic experimental data. Microscopy of Q and STAR AX HyperCel anion exchangers presented some qualitative differences in pore structure that can be attributed to the derivatization using conventional quaternary ammonium and salt-tolerant ligands, respectively. Finally, the effect of ionic strength was studied through the use of salt breakthrough experiments to determine to what extent Donnan exclusion plays a role in restricting the accessible pore volume for small ions. It was determined that Donnan effects were prevalent at total ionic strengths (TIS) less than 150 mM, suggesting the presence of a ligand-containing partitioning volume within the pore space.
Keywords: Cellulosic materials, ion-exchange chromatography, salt-tolerant adsorbents, inverse size exclusion chromatography, electron microscopy, Donnan equilibrium
1. Introduction
Cellulosic ion-exchange materials display qualities very well suited for liquid chromatographic processes. The fine, fibrous structure provides a large surface area for protein adsorption [1,2] and the natural carbohydrates that compose these materials give them a hydrophilic quality that minimizes non-specific binding due to hydrophobic and other effects [3]. These features have led to a variety of beaded cellulosic supports [4–7]. Ion-exchange chromatography (IEC) resins based on cellulose presumably have an open microstructure for easily accessible transport of proteins [3], and characterization of these materials from a more quantitative standpoint has shown that varying the cellulose concentration or the degree of cross-linking can be used to tailor pore dimensions and interconnectivity [4,6–8]. However, differences in the pore structures of cellulosic supports can be expected to result from differences in synthesis procedures, and additional variations may be caused by functionalization. Of particular interest is whether significant functional differences are due solely to differences in the ligand chemistry or also to effects on the physical structure. Here we report such a comparison between several beaded exchangers of the same base matrix with functionalities providing varying levels of salt-tolerance.
Due to the complex nature of the fibrous networks in cellulosic materials, it is difficult to quantify an average pore radius and pore-size distribution in a way that can be related to the adsorption capacity. Inverse size-exclusion chromatography (ISEC) can be used to estimate the pore size distribution (PSD) of a stationary phase from experimental size-exclusion chromatography results for non-interacting solutes of known size, such as uncharged dextran or PEG standards [9–11]. The PSD can then be used to estimate the accessible binding area per unit pore volume (the phase ratio) and the mean pore radius. ISEC analysis has been carried out for carbohydrate-based resins in previous studies [12,13], with the mathematical PSD function used to fit the calibration curves optimized for a simplified pore model. Comparison of data obtained under different conditions allowed the dynamics of the internal structure, specifically the robustness of the pore-size distribution to changes in solution conditions, to be estimated. However, ISEC is incapable of determining information about the pore geometry.
Although ISEC provides a functional measure of the pore-size distribution, it does not directly reflect the details of the pore architecture and geometry [10]. Therefore, in order to complement the macroscopic structural characterization of the HyperCel materials, several electron microscopy techniques were used to gain a qualitative understanding of the particle morphology and pore architecture. Scanning electron microscopy (SEM) was used to image the topography of the particle surface, but also provided ample resolution to investigate the pore structure of each resin. Transmission electron microscopy (TEM) was used to complement the images obtained via SEM and provided a more detailed picture of the intraparticle space.
Salt accessibility studies allow the extent of salt exclusion within the pore space at low total ionic strengths to be determined. This is the regime in which the Donnan equilibrium effect [14] is most pronounced. This effect was considered in much earlier studies of ion-exchange chromatography [15] but has not been examined extensively as an effect in ion-exchange of biopolymers. The effect, where present, can result in a significant difference between the salt concentration in the ambient electrolyte solution and the actual concentration of co- and counter-ions in the medium of interest. This medium is one in which immobilized ionic groups are sufficiently closely spaced that the electrostatic interaction between them is at most only partially screened by the ions in the intervening solution. In ion exchangers this occurs when charged ligands are immobilized on a polymer matrix, giving rise to a 3-D distribution of fixed charge. It occurs, for instance, in polymer-derivatized ion exchangers [16], and it is possible that HyperCel materials exhibit similar structural characteristics to the broader class of polymer-derivatized resins if cellulose chains span the extended pore space, acting much like a grafted polymer extender. Cellulosic exchangers exhibiting functionalized polymer grafts have been synthesized previously [17], which greatly increased adsorptive capacity but hindered flow through pores. The inclusion of a polymer layer such as this would greatly increase exclusion due to Donnan equilibrium at low ionic strengths, including solutes such as proteins, but in this study only salt exclusion was assessed as protein effects would be much more complex to analyze.
The characterization performed here provides structural information that can help in the interpretation of functional characteristics of the stationary phases studied. Extensive functional studies are reported in a companion paper [18].
2. Materials and Methods
2.1. Stationary Phases
S, Q and STAR AX HyperCel (lot AU31072012-3, -4 and -5 for Q, S and STAR AX, respectively) were provided by Pall Corporation (Northborough, MA). All resins were synthesized from the same cellulosic base matrix with different functionalities (sulfonate on S HyperCel, quaternary amine on Q HyperCel, and a proprietary primary amine group on STAR AX HyperCel). The average particle size is on the order of 75–80 μm for all three resins.
2.2. Buffers
Monobasic sodium phosphate (NaH2PO4) and bis-tris were purchased from Fisher Scientific (Fair Lawn, NJ) and Sigma Aldrich (St. Louis, MO), respectively, and used to prepare buffer solutions at pH 7. The packing buffers used were 20 mM bis-tris with 1 M NaCl for use with the anion-exchange (AEX) resins and 10 mM sodium phosphate with 1 M NaCl for S HyperCel. The running buffers for the ISEC experiments contained 20 mM bis-tris or 10 mM sodium phosphate with 0 mM, 100 mM or 1 M NaCl added. The running buffers for the salt exclusion experiments consisted of 50 mM bis-tris with the total ionic strengths (TIS) adjusted with NaCl to 50, 100 and 200 mM. Buffers containing 10–200 mM sodium phosphate were also used to determine phosphate exclusion in separate experiments.
2.3. Inverse Size Exclusion Chromatography
2.3.1. Standards
A set of dextran standards ranging from 180 to 3,000,000 Da was purchased from Polymer Standards Service (Silver Spring, MD). PEG standards (Sigma Aldrich/Fluka) ranging from 100 to 35,000 Da were also used in complementary ISEC experiments. Characteristics of the dextran and PEG standards used are shown in Tables 1 and 2, respectively.
Table 1.
Dextran characteristics, including Mw weight-average molecular weight (Mw), number-average molecular weight (Mn), molar mass at peak maximum (Mp), polydispersity index (PDI, as reported by Polymer Standards Service) and viscosity radius (Rη, derived from Equation 2 [19]).
| Dextran | Mw (kDa) | Mp (kDa) | Mn (kDa) | PDI | Rη (nm) |
|---|---|---|---|---|---|
| dxtp1 | 0.18 | 0.18 | 0.18 | 1.00 | 0.36 |
| dxtp2 | 0.342 | 0.342 | 0.342 | 1.00 | 0.50 |
| dxt1n | 1.35 | 1.08 | 1.16 | 1.16 | 0.88 |
| dxt5 | 5.2 | 4.4 | 3.3 | 1.58 | 1.77 |
| dxt12 | 11.6 | 9.9 | 8.1 | 1.43 | 2.65 |
| dxt25 | 23.8 | 21.4 | 18.3 | 1.30 | 3.89 |
| dxt50 | 48.6 | 43.5 | 35.6 | 1.37 | 5.53 |
| dxt150 | 148 | 124 | 100 | 1.48 | 9.32 |
| dxt270 | 273 | 196 | 164 | 1.66 | 11.71 |
| dxt410 | 410 | 277 | 236 | 1.74 | 13.91 |
| dxt3000k | 3000 | 2800 | 1230 | 2.44 | 44.02 |
Table 2.
PEG characteristics; viscosity radii derived from Equation 3 [19]. PDI values not provided by manufacturer.
| PEG | Mw (kDa) | Rη (nm) |
|---|---|---|
| 100 | 0.1 | 0.29 |
| 400 | 0.4 | 0.60 |
| 2000 | 2.05 | 1.40 |
| 3000 | 3.35 | 1.80 |
| 4000 | 4 | 1.97 |
| 8000 | 8 | 2.82 |
| 20000 | 20 | 4.54 |
| 35000 | 35 | 6.06 |
Standard solutions were prepared by dissolving dextran or PEG standards in running buffer to a concentration of 1 mg/mL and storing them at 4 °C for at least 24 hours prior to their use in ISEC experiments. All samples were filtered through 0.22 μm syringe filters prior to injection to remove any higher molecular weight aggregates.
2.3.2. ISEC Procedures
Resin was slurried in a 75/25 resin to buffer ratio and poured into a graduated cylinder to a volume of 180–200 mL. Packing buffer was added and the resin was suspended and then allowed to settle to a target volume of 135–140 mL. Packing buffer was added and decanted a total of three times. Packing buffer was then added to produce a suspension of 50% v/v resin. The suspension was poured along the inside wall of a vertical GE Healthcare XK 16/70 (i.d. 1.6 cm) column with attached reservoir column. The column was topped off with packing buffer and the top flow adapter attached. The flow of packing buffer was initiated and gradually increased to 4 mL/min (120 cm/hr). The top flow adapter was repeatedly lowered to the top of the bed every hour while packing continued until no noticeable further drop in bed height was observed. The final packed bed height was 50 ± 3 cm in all cases (total column volume 100.5 ± 6.0 mL). Properties of the individual columns are shown in Table 3. Intraparticle void fractions, εp, were determined based on the retention of glucose injections, and interstitial void fractions, ε, were determined based on the retention of dxtb3000k (3,000,000 Da dextran) injections. Chromatography was performed using a Waters 2695 separation module equipped with a Waters 2414 RI detector. Solute injections of 100 μL were used at a flow rate of 1.5 mL/min (45 cm/hr).
Table 3.
Column characteristics, including interstitial, intraparticle and total porosities and the bed height of each packed column.
| ε | εp | εT | L (cm) | |
|---|---|---|---|---|
| S HyperCel | 0.35 | 0.74 | 0.83 | 49.5 |
| STAR AX HyperCel | 0.35 | 0.66 | 0.78 | 47.6 |
2.3.3. Analysis
ISEC data are in the form of a calibration curve of distribution coefficients, or Kd values, determined by
| (1) |
where Vr is the elution volume of the solute, V0 is the interstitial void volume determined from an excluded solute (such as dxtb3000k), and Vt is the total mobile-phase volume determined from a glucose injection.
The Kd calibration curve, expressed as a function of the size of each standard probe, is used to estimate the pore-size distribution of the resin, from which the mean pore size and the accessible pore area can also be estimated. The probe size is most often expressed as the viscosity radius, Rη, based on empirical correlations [19]. For dextran standards the form used is usually
| (2) |
where Mp is the peak molecular weight of the dextran standard, given in Daltons, and the radius is given in nm. For PEG standards the correlation used was
| (3) |
The ISEC procedure fits the experimental Kd values to a PSD function. Since this regression is based on a finite number of data points, it is best carried out using a suitable functional form characterized by a small number of parameter values. We generally use the log normal distribution
| (4) |
where the two parameters directly characterize the shape of the distribution: rp is a measure of the mode of the distribution and sp a measure of the width. The PSD is related to the distribution coefficients by
| (5) |
where rm is the solute viscosity radius for one particular standard. This relationship simply represents Kd as a ratio of accessible pore volume to total pore volume, with partitioning represented as that of a sphere in a cylindrical pore. This partitioning model is highly idealized, and although it provides a reasonable estimate of the characteristic size distribution of the pore space, the limitations of the model should be borne in mind.
Although the sensitivity to pore size is much greater than that to pore shape, we also explored PSD fits for the Ogston model [20], which is more plausible as a physical representation of the fibrous nature of the HyperCel family of materials. An adaptation of the Ogston model was derived from the work of Laurent and Killander [21] and Slater et al. [22] that describes the available volume by assuming that the cellulosic matrices are comprised of a network of straight, rigid fibers that are infinitely long and distributed at random, and assuming that the solute radius is much greater than the radius of the cellulosic fibers:
| (6) |
Here rmean is simply the mean pore radius provided by the distribution. Multiplying the Kd values obtained from this PSD by 1/εT provides a more accurate model prediction by accounting for empirical interstitial and intraparticle porosities of the materials.
Fitting of the experimental data was performed in MATLAB using the ‘quadgk’ function to evaluate the integrals and ‘nlinfit’ to fit the PSD parameters using nonlinear least-squares regression. Once parameters had been determined for the PSD, values for the mean pore radius (first moment of the distribution) were derived using the methods described in [12].
2.4. Electron Microscopy
2.4.1. Scanning Electron Microscopy
Samples were prepared by dehydrating resin in ethanol and placing the particles in 30 μm microporous capsules. Samples were critical-point dried using a Tousimis Autosamdri-815B critical-point drier and mounted on aluminum stubs using double-sided carbon tabs. Samples were then sputter-coated with gold-palladium in a Denton Bench Top Turbo III coater for 4 minutes at a current of 30 mA and an argon pressure of 65 mtorr. Several samples were left uncoated in order to observe the effects of electron charging on the materials while imaging was performed.
Additional samples were temporarily fixed with 1% glutaraldehyde and 1% paraformaldehyde before being chemically fixed with 1% osmium tetroxide (OsO4) in DI water. Samples were washed with DI water and dehydrated in ethanol before the same processing method was followed as for the samples that were not chemically fixed, to allow for a qualitative comparison between particles with and without chemical fixation. All SEM imaging was performed using a Hitachi S4700 FESEM operated in secondary electron mode with a voltage of 3.0 kV and a working distance of 2–3 mm.
2.4.2. Transmission Electron Microscopy
Resin particles were temporarily fixed with 1% glutaraldehyde and 1% paraformaldehyde before being chemically fixed with 1% osmium tetroxide in DI water. Samples were dehydrated into 100% acetone and infiltrated with Embed-812 resin in increasing fractions of resin in acetone. Samples were cured at 65 °C for 72 hours before being sectioned via microtome to slices 50–70 nm in thickness. Sections were post-stained with uranyl and lead acetate and placed on 200 mesh formvar-carbon supported copper grids.
Q and STAR AX HyperCel materials were also stained using 1% glutaraldehyde and 1% tannic acid followed by the remainder of the standard sample processing. This fixation method, referred to as the TAGO method (tannic acid-glutaraldehyde-osmium tetroxide) [23], provides increased contrast in samples with fewer binding sites for osmium, e.g., amine functional groups, as the tannic acid acts as a mordant between the heavy metal and the sample. All TEM imaging for particle sections was performed on a Zeiss LIBRA 120 transmission electron microscope operated at 120 kV.
2.5. Salt Exclusion
Apart from steric exclusion effects of the kind measured by ISEC, there may also be electrostatic exclusion effects for proteins [24,25]. However, small ions may also be excluded due to the Donnan equilibrium effect [14] within a 3-D volume bearing fixed charges; the effect is apparent at ambient salt concentrations lower than the local volumetric density of fixed charge. When the material is regenerated using high salt concentrations and then equilibrated with a running buffer with a relatively low salt concentration, a higher counterion concentration will be present within the polymer layer than in the bulk fluid. Conversely, because of the presence of the fixed charges, the free co-ion concentration in the polymer is lower than that in the bulk fluid. The resulting concentration gradients tend to drive counterions into the bulk fluid and co-ions into the polymer layer. However, these opposing fluxes would disrupt the required electroneutrality within the polymer, so the exchange would give rise to an electrical potential difference between the polymer interior and the bulk fluid. The energetic cost of the potential difference gives rise to an equilibrium that prevents the exchange from occurring. As a result, at low bulk salt concentrations the effective salt concentration inside the polymer is appreciably below that in the bulk fluid, and it is only when the bulk salt concentration approaches the local volumetric density of fixed charge inside the polymer that the intrapolymer salt concentration approaches the bulk value [15].
Donnan exclusion measurements were performed as described by Bowes et al. [16]. Resin was packed into 5 mm i.d. Waters AP Minicolumns with a bed height of 10 ± 1.0 cm. Salt breakthrough experiments were carried out on a GE Healthcare ÄKTA Purifier system equipped with a conductivity meter to measure salt concentration. Low-salt buffer was fed through pump A and high-salt buffer (either 50, 100 or 200 mM TIS buffer) was fed through pump B. Starting at 10% B, the concentration of high-salt buffer was increased stepwise by 5% every 20 minutes until 70% B was achieved. Mixtures below 10% B and above 70% B were omitted as those ranges produced the least accurate mixing by the ÄKTA. All steps were conducted at a linear velocity of 120 cm/hr. Steps were performed with and without the column in place in order to find the mixture-dependent dead volume for each step and subtract it from the integrated area for salt breakthrough on the column at the same concentration steps. Column properties were determined in a similar manner to that used in the ISEC experiments.
The analysis of the data is in terms of apparent partitioning behavior. The interstitial porosity is given by ε = V0/Vc, where V0 is the intraparticle void volume determined from dxtb3000k injections and Vc is the total column volume. The intraparticle porosity is given by εp = (VT/Vc- ε)/(1- ε), where VT is the total mobile phase volume determined from glucose injections. The apparent pore volume fraction accessed by salt at each step is given by (VBT-Vd,BT-εVc)/[εp(1-ε)Vc], where VBT is the column breakthrough volume for a single concentration step, determined by the integrated area under the conductivity breakthrough curve, and Vd,BT is the dead volume for the same step determined by the integrated area without a column in place.
3. Results and Discussion
3.1. Inverse Size Exclusion Chromatography
Figure 1 shows chromatograms for the dextran standards in STAR AX HyperCel, in units of column volumes. These raw SEC data readily elucidate which standards are on the order of the mean pore size of the material. Total exclusion and inclusion are clearly apparent at the extremes of probe size, while dextran standards of intermediate size show the transition between the two extremes. The peaks with intermediate retention appear broad and non-Gaussian in shape, but their first moments were still calculated in order to estimate the retention volumes. The peak shapes may be due to the polydispersity of the dextran standards, as PEG standards of intermediate size show much more satisfactory peak shapes (Figure 2). Although the PDI values were not provided by the manufacturers for the PEG samples used in our experiments, PEG standards from other vendors (e.g., Polymer Standards Service) report PDI values of less than 1.25 for PEG polymers of similar molecular weights, The SEC calibration curves, developed using raw data such as those shown in Figures 1 and 2, are shown in Figure 3 for four IEC materials: S HyperCel, STAR AX HyperCel, Q Sepharose FF and Q Sepharose XL [26]. Consistent with the qualitative interpretation of the data in Figures 1 and 2, the set of dextran standards shows Kd values ranging from almost 1 (completely included) to near zero (completely excluded). It is clear that the two HyperCel materials and the dextran-modified Sepharose XL have very similar pore space dimensions. Q Sepharose FF presents a pore space with a much larger characteristic size, implying that the pore structure of HyperCel shares characteristics with regard to pore size with the polymer-modified variant, Sepharose XL, but not Sepharose FF, which lacks polymer derivatization. Pore dimension parameters for the Q Sepharose materials have previously been evaluated by ISEC [13] and are shown in Table 4.
Figure 1.
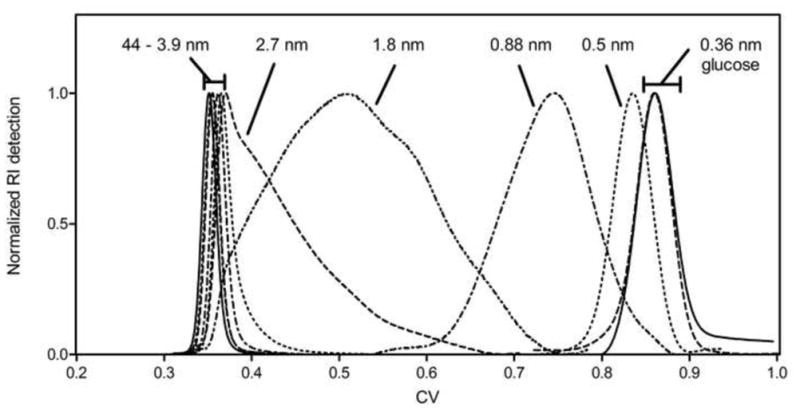
Dextran retention volume chromatograms in STAR AX HyperCel (20 mM bis-tris, 100 mM NaCl, pH 7).
Figure 2.
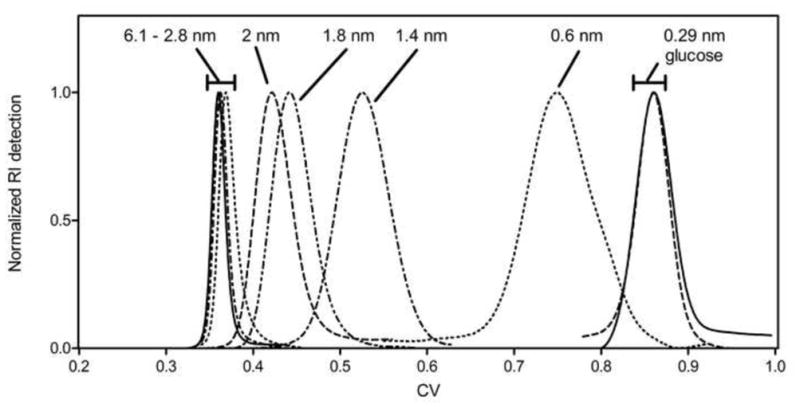
PEG retention volume chromatograms in STAR AX HyperCel (20 mM bis-tris, 100 mM NaCl, pH 7).
Figure 3.
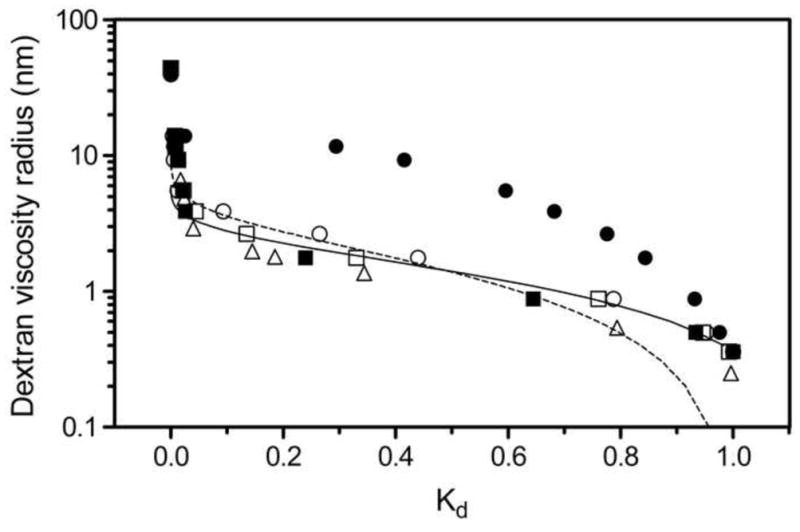
Dextran calibration curves for S HyperCel (■), STAR AX HyperCel (□), Q Sepharose FF (●), and Q Sepharose XL (○); PEG calibration curve for STAR AX HyperCel (△) also shown; log-normal (---) and Ogston (—) models applied to the dextran calibration curve for STAR AX HyperCel (100 mM NaCl, pH 7).
Table 4.
Pore size distribution parameters and mean pore radii for S HyperCel, STAR AX HyperCel, Q Sepharose FF and Q Sepharose XL materials determined by ISEC analysis; Sepharose parameters were taken from Yao and Lenhoff [13].95% confidence intervals included for values fitted in this work.
| Cylindrical pore model | Ogston model | |||
|---|---|---|---|---|
| rp | sp | rmean (nm) | rmean (nm) | |
| S HyperCel | 4.4 ± 1.4 | 0.9 ± 2.0 | 4.4 | 3.6 ± 0.4 |
| STAR AX HyperCel | 5.0 ± 1.2 | 0.7 ± 1.1 | 5.1 | 4.7 ± 0.4 |
| Q Sepharose FF | 25.8 | 0.47 | 28.8 | NA |
| Q Sepharose XL | 5.9 | 0.006 | 5.9 | 9.2 ± 3.3 |
We investigated the sensitivity of the Kd data to several experimental parameters. First, the large differences apparent in the peak shapes of dextran and PEG probes of intermediate size (Figures 1 and 2) are not reflected in appreciable differences in the Kd values for STAR AX HyperCel (Figure 3). Indeed, the small offset may be due to uncertainties in the empirical correlations used for determining the viscosity radii of PEGs and dextrans, as well as the contribution of the polydispersity of especially the dextran probes.
The effect of changes in ionic strength was studied by using running buffers with different concentrations of sodium chloride. Figure 4 shows the dextran calibration curves of STAR AX and S HyperCel at 0 M NaCl, 100 mM NaCl and 1 M NaCl. For the salt-tolerant AEX resin, the small shift in Kd with salt concentration indicates a more open structure with increasing salt, which may be interpreted as a collapse in the polymer. However, the effect is small, leading to the conclusion that different ionic strengths do not significantly alter the pore structure, and hence the pore volume, so this appears not to be implicated in the mechanism for the salt tolerance. Calibration curves for S HyperCel at various salt concentrations also show similar curvature, so it can be inferred that changes in solution ionic strength do not severely affect the pore structure of the standard derivatizations along with the salt-tolerant material. The effect in Figure 4 is similar in magnitude to that reported recently for PEI-derivatized Sepharose [27], but smaller than that on some other ion-exchange materials, including other polymer-modified resins, which show a more appreciable expansion in pore size at elevated salt, presumably due to contraction or collapse of the polymer layer [12,28]. The apparent rigidity that the HyperCel materials display is most likely due to the high degree of cross-linking within the particle structure.
Figure 4.
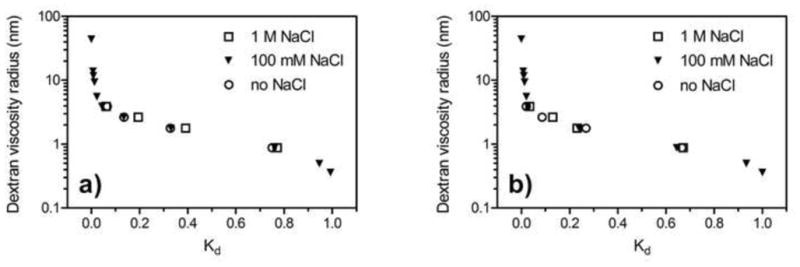
Dextran calibration curves for (a) STAR AX HyperCel and (b) S HyperCel at different NaCl concentrations (20 mM bis-tris, pH 7).
Figure 3 also shows fits of the log-normal and Ogston PSD models to the STAR AX HyperCel dextran calibration curve. The poor fit at high Kd (small probes) for the log-normal model appears to be a result of assumptions rooted in the cylindrical-pore model, which are especially apparent for the relatively narrow pores observed here. Additional uncertainties may result from correlations between the two parameters in the log-normal distribution [29]. Applying the Ogston model to the calibration curve gives a better fit, which is reassuring since it was developed to estimate the pore size distribution in a network of randomly placed fibers, such as a gel [21,22], but this does not affect the intrinsic conclusions here regarding the effective pore size.
Fitting parameters and derived characteristics of the S and STAR AX HyperCel materials are shown in Table 4, including rp, sp, and the mean pore radii determined by the ISEC analyses, rmean, by application of the log-normal cylindrical pore and Ogston models. These reflect a relatively narrow pore structure, comparable to those of dextran-modified Sepharose XL or other polymer-grafted resins [13,30]. On such resins the access (or lack thereof) of uncharged probe molecules or proteins can provide a misleading indication of accessibility in the presence of an electrostatic driving force [31,32], so exclusion of large proteins such as monoclonal antibodies would not likely be an issue. Conversely, the mean pore sizes for the HyperCel resins differ appreciably from the pore size reported previously for MEP HyperCel [29], which may be a result of differences in the base matrices or the ligands in the respective materials.
3.2. Scanning Electron Microscopy
Whole-particle SEM was performed on particles with and without chemical fixation by OsO4, and with no adsorbed protein and with adsorbed protein (in which the samples were required to be chemically fixed beforehand). Results for only protein-free materials are presented here for the purpose of structural characterization, but TEM imaging of phases containing protein are presented elsewhere [18]. Corresponding results are presented in Figures 5 and 6, which differ only in the magnification. As shown in Figures 5–6a and b, there is little difference between Q HyperCel samples that are and are not chemically fixed. The fibrous network shown is characteristic of natural carbohydrate polymer adsorbents [31,33], and appears to contain “pores” on the order of 10–50 nm in characteristic dimension. STAR AX HyperCel appears to include a finer network of fibers within the larger pore volume when chemical fixation is performed (Figures 5–6c), but appears qualitatively similar to Q HyperCel without any prior fixation (Figures 5–6d). This suggests that fixation of the material either alters the inner pore structure or locks the native structure in place, revealing the true nature of the pore volume and suggesting that this structural characteristic is lost without performing chemical fixation.
Figure 5.
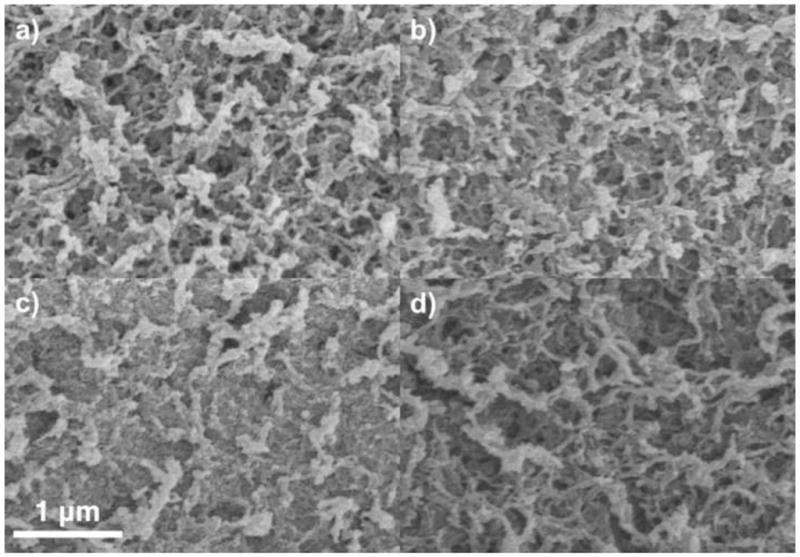
SEM images of Q (a and b) and STAR AX (c and d) HyperCel. a and c show the resin chemically fixed with OsO4; b and d show resin without chemical fixation.
Figure 6.
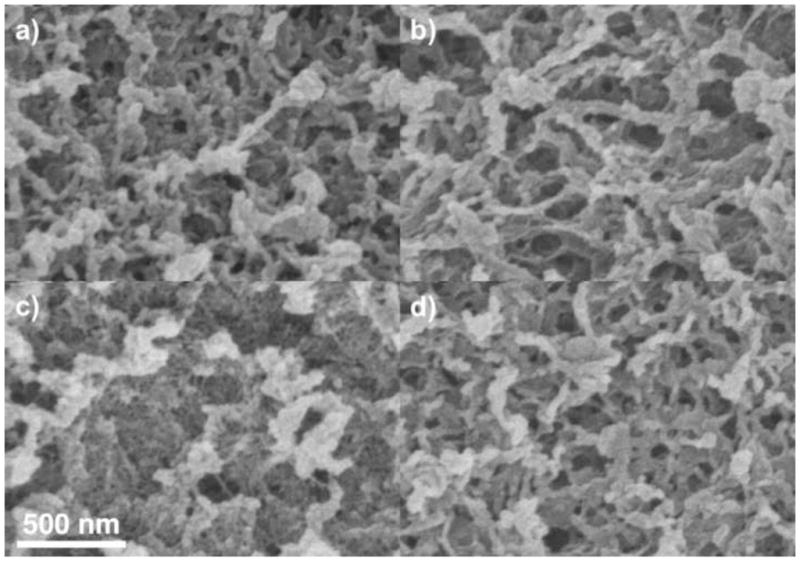
SEM images of Q (a and b) and STAR AX (c and d) HyperCel at higher magnification. a and c show the resin chemically fixed with OsO4; b and d show resin without chemical fixation.
That the observed pore space has features noticeably larger than suggested by the results from ISEC could stem from several factors. First, cellulose, being very hydrophilic, may have its native structure significantly altered when undergoing sample processing, specifically critical point drying. While this would suggest that the microscopy results are unreliable, the micrographs still provide a qualitative comparison between the materials and display these materials’ significant pore connectivity due to the fibrous nature of the carbohydrate base matrix. Second, the resolution of the microscopy images may not have been high enough to visualize structural details that were postulated, such as the possibility of freely bound cellulosic chains that extend into the pore space, similarly to how grafted functionalized polymers comprise the porous space in “tentacle”-type exchangers. The conditions required for sample processing may have caused a collapse of this layer. Finally, the EM methods may simply not resolve pore space dimensions of order 5 nm as suggested by ISEC, leaving the larger features as the more visible ones.
Based on the theoretical assessment of pore size via ISEC analysis, the pore dimensions for S and STAR AX HyperCel are quantitatively similar. Also, Q and S HyperCel are assumed to have almost identical architecture, as the only fundamental difference is in the ion-exchange ligands. The ligand chemistry in the STAR AX material differs in character from that of both the S and Q adsorbents, and is the most likely reason for the difference in pore structure seen in the SEM images when the material was chemically fixed with OsO4. However, without more detailed knowledge of the ligand chemistry it is not possible to draw further conclusions.
3.3. Transmission Electron Microscopy
3.3.1. Effect of Preparation Buffer
All TEM was performed on sections 50 nm thick. All sample preparation was done using 10 mM sodium phosphate buffer at pH 7 for the initial fixation, as the amine groups in bis-tris can cause undesired artifacts by reacting with glutaraldehyde [23]. Figure 7 shows a comparison of Q HyperCel initially prepared in 10 mM sodium phosphate, 50 mM bis-tris and 10 mM sodium cacodylate (a commonly used TEM buffer). The sample prepared in bis-tris lacks the generally fibrous appearance that is apparent in the sodium phosphate and cacodylate buffers. These artifacts are likely present due to residual bis-tris buffer not being completely washed from the sample prior to osmication, leaving excess positively charged functional groups within the pore space of the sample and acting as a mordant for the heavy-metal stain. Therefore, for all TEM imaging experiments, sodium phosphate buffer was used in lieu of bis-tris buffer for the anion exchange adsorbents.
Figure 7.
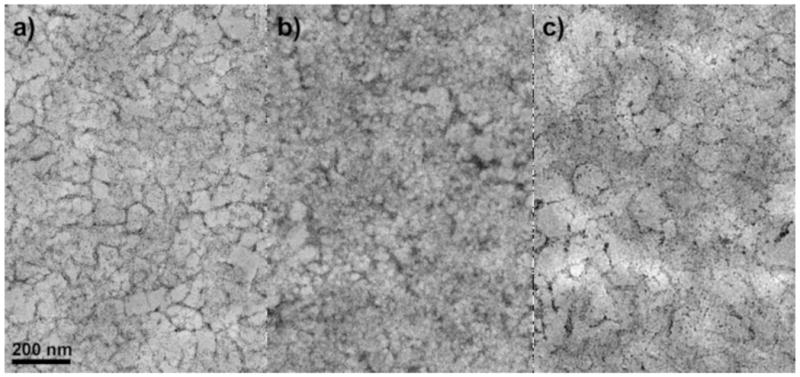
TEM images of Q HyperCel prepared in 10 mM sodium phosphate (a), 50 mM bis-tris (b) and 10 mM sodium cacodylate (c) buffers during fixation.
3.3.2. Q HyperCel
Two different methods of chemical fixation were used: the standard method using 1% glutaraldehyde and 1% paraformaldehyde to temporarily fix the material, followed by OsO4, and the TAGO method, which utilizes 1% tannic acid instead of 1% paraformaldehyde. Tannic acid acts as a mordant for the OsO4, binding to the cellulosic backbone of the material as opposed to attaching only to the functionalized ligands of the ion exchangers. This increases the contrast provided by the OsO4 as well as allowing the staining of material without a moiety with specific affinity for the heavy metal stain (e.g., sulfonated resins).
Figure 8 shows TEM images of Q HyperCel at 10000x and 31500x magnification using both methods of fixation. The TAGO method yields images showing a more disconnected pore network within the material. Pore diameters appear to be on the order of 50 nm, similar to those of other natural carbohydrate polymer matrices, e.g., Sepharose FF [12,26] and to some of the pore space seen in SEM. Possible reasons for the difference between these pore dimensions and those based on ISEC were discussed above. In the case of TEM, dehydration into solvent prior to resin infiltration may have been the culprit, as the cellulosic materials are highly hydrophilic, but the resolution of the microscope may also have been a factor. Since the heavy metal stain adheres to the positively charged functional groups on the surface of the material, it may not give significant contrast to these extenders as they may have far less functionalization than the cellulosic backbone.
Figure 8.
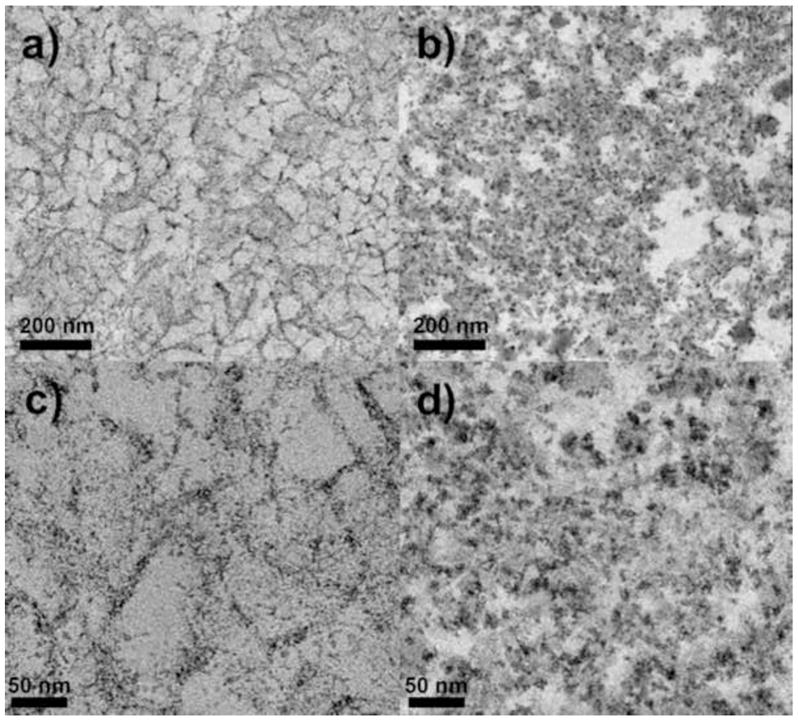
TEM images of Q HyperCel prepared using standard aldehyde fixation (a and c) and TAGO fixation (b and d); low (a and b) and high (c and d) magnification.
The dark spots present in the TAGO-fixed samples are probably deposits of OsO4 that aggregated during osmication. It was verified that these were not artifacts of the post-staining procedure by imaging sections that had undergone fixation but not post-staining.
3.3.3. STAR AX HyperCel
Images of STAR AX HyperCel (Figure 9) differ from those of Q HyperCel in that the structure seems to be more homogeneous, with less definition between pore space and cellulose. The TAGO fixation method does not seem to change the result much from the standard aldehyde fixation, albeit there is more contrast in these samples since tannic acid acts as a mordant for the OsO4. There is little to no heterogeneity in the structure, implying a much smaller and more complex pore network than the Q and S HyperCel moieties. Pore dimensions cannot be determined using either method of fixation and dark spots are most likely OsO4 deposits (which are also seen for Q HyperCel) and do not signify any particular structural characteristic.
Figure 9.
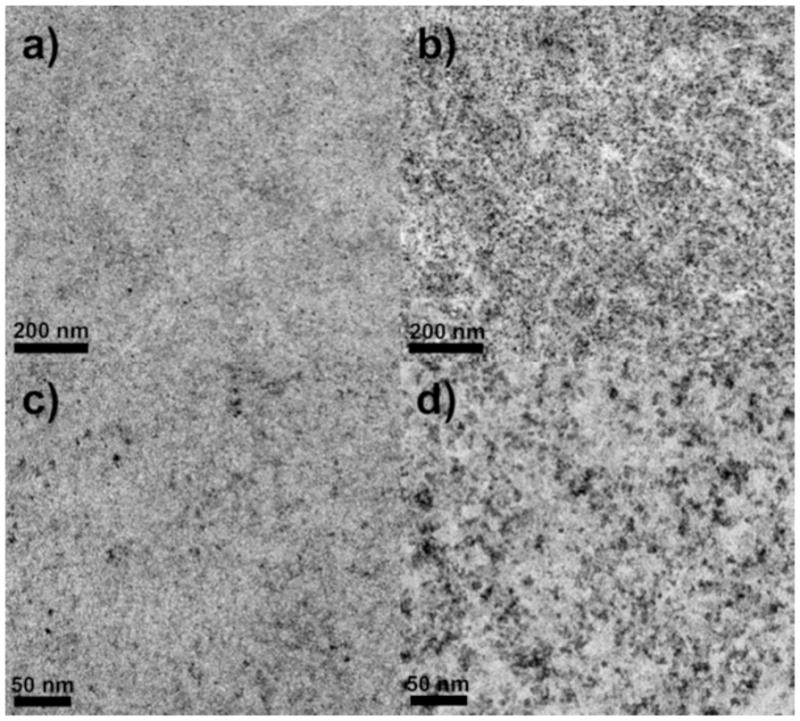
TEM images of STAR AX HyperCel prepared using standard aldehyde fixation (a and c) and TAGO fixation (b and d); low (a and b) and high (c and d) magnification.
3.3.4. Intraparticle Voids
A recurring feature that appeared in TEM and SEM images was intraparticle voids in sections of the HyperCel materials. These seemed to be areas of lower cellulosic content that may have been formed during the manufacturing process. These voids were also visible when protein uptake and elution were imaged by confocal microscopy [18], so the possibility that they may have been formed by the sample processing methods or microtome sectioning can be ruled out. Although these voids were present in all HyperCel materials, they most likely do not contribute to any negative effects with regards to protein sorption or transport; they do not contribute to the extraparticle volume as the large dextran probes used to determine the extraparticle porosity cannot access the porous space and they do not seem to hinder the adsorptive capacity or protein uptake rates [18]. These voids were also imaged in two-dimensional slices, so the portion of intraparticle space they occupy is much less in a real three-dimensional volume.
Figure 10 shows some examples of the low-density voids within Q and STAR AX HyperCel, but similar formations were present in S HyperCel as well. It is easy to see from Figures 10a and b that the voids are lower in cellulosic content than the bulk of the material, but still appear functionalized. Figure 10c shows a low-magnification image of STAR AX HyperCel to display the distribution and relative sizes of these voids within the entire particle; Q and S HyperCel show a similar distribution of voids. Void sizes seem to range from approximately 100 nm to several hundred nanometers in diameter. Figure 10d shows protein-adsorbed STAR AX HyperCel, as voids were not apparent in the unadsorbed phase due to the increased level of homogeneity. If regions with higher contrast are assumed to be the cellulosic backbone, the voids in this case are actually higher in density than the surrounding cellulose in the STAR AX material. If the regions of higher contrast are areas of more abundant protein localization, these voids could still be sparse in terms of cellulose content, but the ligand chemistry would still allow adsorption of protein.
Figure 10.
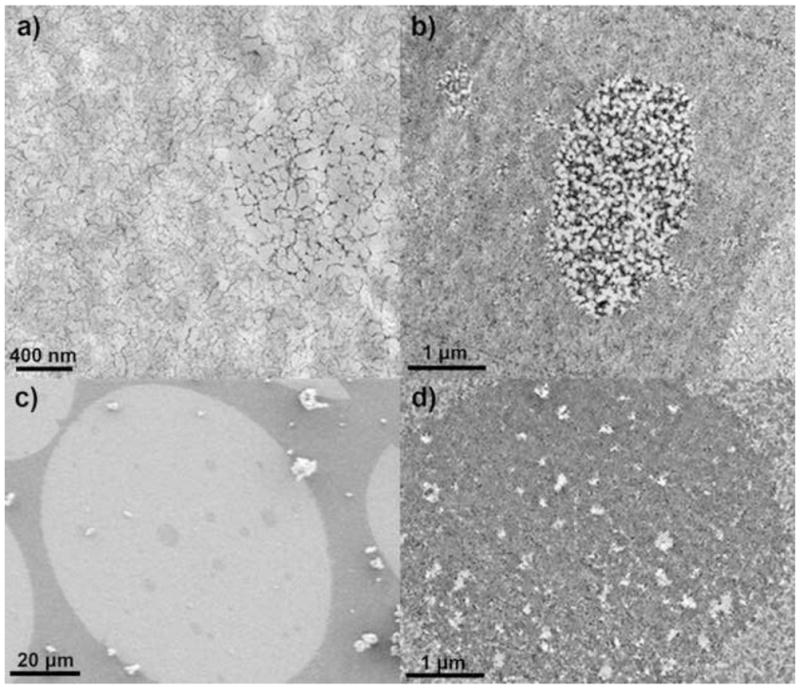
Micrographs of HyperCel materials showing void regions. a) TEM image of Q HyperCel without protein adsorbed; b) TEM image of Q HyperCel with 50% of maximum loading of β-lactoglobulin; c) SEM image of STAR AX HyperCel section; d) TEM image of STAR AX HyperCel with 50% of maximum loading of β-lactoglobulin.
3.4. Salt Exclusion
Data collected from salt step gradient experiments are shown in Figure 11 for Q and STAR AX HyperCel; our interest here was in the effect of the ligand type in anion exchange, so S HyperCel was not investigated. The different symbols in Figures 11a and 11b correspond to the values of TIS for the high-salt buffers used in conjunction with the 50 mM bis-tris (13 mM TIS) low-salt buffer to generate feeds of different ionic strengths. The STAR AX material displayed more scattered data for the same salt concentration steps as for Q, so these experiments were run in triplicate; the reason for the higher degree of scatter is not known. In both resins, salt exclusion is clearly apparent at low salt, but it becomes insignificant at TIS values greater than about 150 mM TIS. This similarity implies that the two resins have similar charge densities, despite their differing ligand chemistries.
Figure 11.
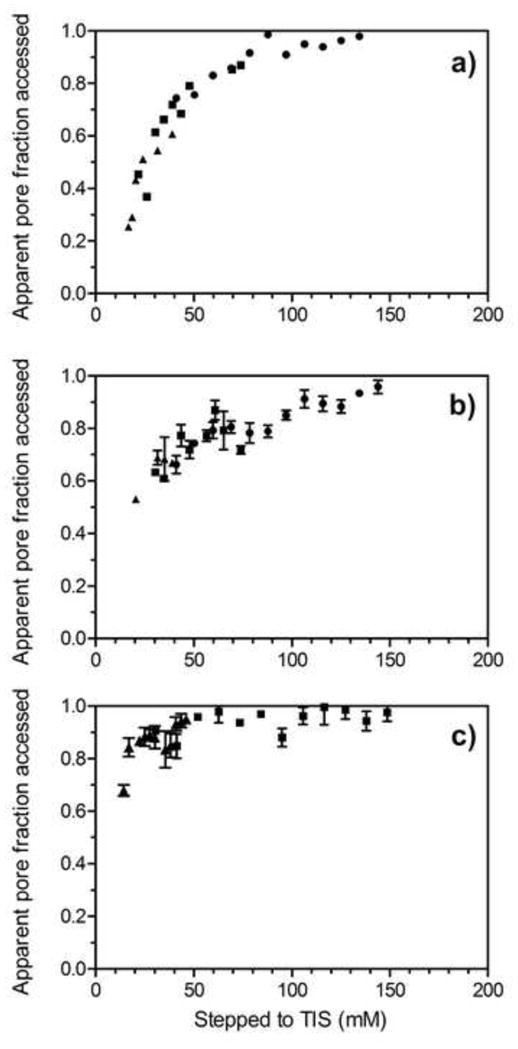
Salt exclusion in Q HyperCel (a) and STAR AX HyperCel (b, c). Solution conditions for (a) and (b) were 50 mM bis-tris, pH 7, with TIS adjusted with NaCl. Symbols denote maximum TIS of buffer used for each range of ionic strengths: 200 (●), 100 (■), and 50 (▲) mM TIS. Solution conditions for (c) were 10–100 mM sodium phosphate, pH 7. Symbols denote the maximum concentration of sodium phosphate used for each range of ionic strengths: 100 (■) and 30 (▲) mM sodium phosphate.
In a standard polymer-modified material, SP Sepharose XL, the salt exclusion was found to become insignificant above about 300 mM TIS [16], i.e., double the value found for AEX HyperCel materials. This presumably reflects differences in the ligand charge density in the media concerned. The ligand density as reported by the manufacturers for SP Sepharose XL, 0.18–0.25 mmol/mL, is higher than that in the HyperCel media (0.099–0.138 mmol/mL for Q HyperCel and 0.059–0.084 mmol/mL for S HyperCel). However, a direct comparison is complicated by the dependence of the Donnan behavior on the local charge density within the polymer, not the value averaged over the whole particle, which is what is reported by the manufacturers.
That the behavior seen is indeed a Donnan exclusion effect and not just the result of a reduction in double-layer thickness is indicated especially by the relatively steep approach to unity of the pore fraction accessed in each of the plots. Since the double-layer thickness varies inversely with the square root of ionic strength, a much slower approach would be expected if that were the basis for exclusion; such a slow approach is indeed seen for SP Sepharose FF (Bowes et al. 2012). It therefore appears appropriate to consider the ligand distribution within the HyperCel media to be a volumetric one, with the charges relatively closely spaced within the ligand-containing regions. In the case of the HyperCel media the possibility also exists of having ligands fairly uniformly distributed throughout the particle interior.
In addition to investigating the effect of salt exclusion in a bis-tris/NaCl buffering system, salt exclusion was assessed in a monobasic sodium phosphate buffering system for STAR AX HyperCel (Figure 11c). Using 30 and 100 mM sodium phosphate as the upper limits in the step gradients, salt exclusion was found to be insignificant above 50 mM TIS, 100 mM less than for the bis-tris/NaCl buffering system. This is consistent with the direction of change expected [15] for the multivalent phosphate ions, as opposed to the monovalency of Cl−, although a direct quantitative comparison is not readily performed.
4. Conclusions
The structural characteristics of the cellulosic IEX resins studied here are of interest because they directly dictate functional characteristics, such as protein sorption and transport within the porous network. The use of both macroscopic (column-level) and microscopic techniques was aimed at gleaning as much of a physical understanding of these materials as possible. The picture that emerges from our results is of materials with a much greater degree of homogeneity of structure than is the case for another class of highly cross-linked carbohydrate-based adsorbents, namely those on agarose base matrices. Although electron microscopy shows apparent pores of dimension 10–50 nm and therefore approaching the typical mean pore size of agarose media such as Sepharose FF, the intrinsic pore space in the HyperCel cellulosic media is closer to 5 nm in dimension, as indicated by ISEC. EM imaging did reveal, however, significant apparent differences in pore structure between the salt-tolerant and non-salt-tolerant moieties, presumably due to the unique ligand chemistry of STAR AX HyperCel.
A specific aspect of interest here was whether the known differences in salt-tolerance between STAR AX and Q HyperCel are apparent in any of the structural characteristics probed. Although differences are seen in EM appearance, they may be due to the effects of ligand chemistry on EM sample preparation, and it is likely that differences in salt tolerance are simply due to the presence of the primary amine group on the SALT AX ligand.
Another structural characteristic that can have a direct impact on functional characteristics of the HyperCel media is the ligand distribution. Salt exclusion experiments suggest that, like the structure generally, the ligand distribution is relatively homogeneous, resulting in an effectively 3-D distribution of ligands. That the overall ligand density, based on the whole particle volume, is already somewhat low would result in a low local ligand density, which may have implications for protein transport in these media.
Acknowledgments
The financial support provided by Pall Corporation is gratefully acknowledged. The electron microscopy was performed at the Delaware Biotechnology Institute Bioimaging Facility, which is supported in part by NIH grants P30 GM103519 and P20 GM103446 from the IDeA program of the National Institute of General Medical Sciences. We thank Shannon Modla, Deborah Powell and Michael Moore for their outstanding technical support.
References
- 1.Peterson EA, Sober HA. J Am Chem Soc. 1956;78:751. [Google Scholar]
- 2.Graham EE, Fook CF. AIChE J. 1982;28:245. [Google Scholar]
- 3.Peterson EA. In: Laboratory Techniques in Biochemistry and Molecular Biology. 1. Work TS, Work E, editors. North-Holland Publishing Company; Amsterdam: 1970. [Google Scholar]
- 4.Bai YX, Li YF. Carbohydrate Polymers. 2006;64:402. [Google Scholar]
- 5.Boeden HF, Pommerening K, Becker M, Rupprich C, Holtzhauer M, Loth F, Müller R, Bertram D. J Chromatogr A. 1991;552:389. doi: 10.1016/s0021-9673(01)95956-4. [DOI] [PubMed] [Google Scholar]
- 6.Du KF, Yan M, Wang QY, Song H. J Chromatogr A. 2010;1217:1298. doi: 10.1016/j.chroma.2009.12.037. [DOI] [PubMed] [Google Scholar]
- 7.Wang DM, Hao G, Shi QH, Sun Y. J Chromatogr A. 2007;1146:32. doi: 10.1016/j.chroma.2007.01.089. [DOI] [PubMed] [Google Scholar]
- 8.de Oliveira W, Glasser WG. J Appl Polym Sci. 1996;60:63. [Google Scholar]
- 9.Halasz I, Vogtel P. Angew Chem Int Ed Engl. 1980;19:24. [Google Scholar]
- 10.Knox JH, Ritchie HJ. J Chromatogr A. 1987;387:65. [Google Scholar]
- 11.Hagel L, Östberg M, Andersson T. J Chromatogr A. 1996;743:33. [Google Scholar]
- 12.DePhillips P, Lenhoff AM. J Chromatogr A. 2000;883:39. doi: 10.1016/s0021-9673(00)00420-9. [DOI] [PubMed] [Google Scholar]
- 13.Yao Y, Lenhoff AM. J Chromatogr A. 2006;1126:107. doi: 10.1016/j.chroma.2006.06.057. [DOI] [PubMed] [Google Scholar]
- 14.Donnan FG, Barker JT. Proc Roy Soc London Ser A. 1911;85:557. [Google Scholar]
- 15.Helfferich F. Ion Exchange. McGraw Hill; New York: 1962. [Google Scholar]
- 16.Bowes BD, Traylor SJ, Timmick SM, Czymmek KJ, Lenhoff AM. Chem Eng Technol. 2012;35:91. [Google Scholar]
- 17.Wang DM, Sun Y. Biochem Eng J. 2007;37:332. [Google Scholar]
- 18.Angelo JM, Cvetkovic A, Gantier R, Lenhoff AM. 2013. in preparation. [Google Scholar]
- 19.Kremer M, Pothmann E, Roessler T, Baker J, Yee A, Blanch H, Prausnitz JM. Macromolec. 1994;27:2965. [Google Scholar]
- 20.Ogston AG. Trans Faraday Soc. 1958;54:1754. [Google Scholar]
- 21.Laurent TC, Killander J. J Chromatogr A. 1964;14:317. [Google Scholar]
- 22.Slater GW, Rousseau J, Noolandi J, Turmel C, Lalande M. Biopolymers. 1988;27:509. doi: 10.1002/bip.360270311. [DOI] [PubMed] [Google Scholar]
- 23.Hayat MA. Principles and Techniques of Electron Microscopy: Biological Applications. 4. Cambridge University Press; 2000. [Google Scholar]
- 24.Harinarayan C, Mueller J, Ljunglöf A, Fahrner R, Van Alstine J, van Reis R. Biotechnol Bioeng. 2006;95:775. doi: 10.1002/bit.21080. [DOI] [PubMed] [Google Scholar]
- 25.Zydney AL, Harinarayan C, van Reis R. Biotechnol Bioeng. 2009;102:1131. doi: 10.1002/bit.22145. [DOI] [PubMed] [Google Scholar]
- 26.Yao Y, Lenhoff AM. J Chromatogr A. 2004;1037:273. doi: 10.1016/j.chroma.2004.02.054. [DOI] [PubMed] [Google Scholar]
- 27.Yu LL, Sun Y. J Chromatogr A. 2013;1305:85. doi: 10.1016/j.chroma.2013.07.016. [DOI] [PubMed] [Google Scholar]
- 28.Müller E. Chem Eng Technol. 2005;28:1295. [Google Scholar]
- 29.Tatárová I, Gramblička M, Antošová M, Polakovič M. J Chromatogr A. 2008;1193:129. doi: 10.1016/j.chroma.2008.04.023. [DOI] [PubMed] [Google Scholar]
- 30.Jerabek K, Revillon A, Puccilli E. Chromatographia. 1993;36:259. [Google Scholar]
- 31.Bowes BD, Koku H, Czymmek KJ, Lenhoff AM. J Chromatogr A. 2009;1216:7774. doi: 10.1016/j.chroma.2009.09.014. [DOI] [PMC free article] [PubMed] [Google Scholar]
- 32.Almodovar EXP, Tao Y, Carta G. Biotechnol Prog. 2011;27:1264. doi: 10.1002/btpr.643. [DOI] [PubMed] [Google Scholar]
- 33.Koku H. Doctoral Dissertation. University of Delaware; 2011. [Google Scholar]


